毕业设计英语翻译Word版
毕业设计中英文翻译【范本模板】
英文The road (highway)The road is one kind of linear construction used for travel。
It is made of the roadbed,the road surface, the bridge, the culvert and the tunnel. In addition, it also has the crossing of lines, the protective project and the traffic engineering and the route facility。
The roadbed is the base of road surface, road shoulder,side slope, side ditch foundations. It is stone material structure, which is designed according to route's plane position .The roadbed, as the base of travel, must guarantee that it has the enough intensity and the stability that can prevent the water and other natural disaster from corroding.The road surface is the surface of road. It is single or complex structure built with mixture。
The road surface require being smooth,having enough intensity,good stability and anti—slippery function. The quality of road surface directly affects the safe, comfort and the traffic。
毕业设计英语翻译全文
[1]. These brake systems use compressed air as the energy transmitting medium to actuate the foundation brakes mounted on the axles.The air brake system currently found in commercial vehicles is made up of two subsystems —the pneumatic subsystem and the mechanical subsystem. The pneumatic subsystem includes the compressor, storage reservoirs, treadle valve (or the brake application valve), brake lines, relay valves, quick release valve, brake chambers, etc. The mechanical subsystem starts from the brake chambers and includes push rods, slack adjusters, S-cams, brake pads and brake drums. One of the most important differences between a hydraulic brake system (found in passenger cars) and an air brake system is in their mode of operation. In a hydraulic brake system, the force applied by the driver on the brake pedal is transmitted through the brake fluid to the wheel cylinders mounted on the axles. The driver obtains a sensory feedback in the form of pressure on his/her foot. If there is a leak in the hydraulic brake system, this pressure will decrease and the driver can detect it through the relatively easy motion of the brake pedal. In an air brake system, the application of the brake pedal by the driver meters out compressed air from a supply reservoir to the brake chambers. The force applied by the driver on the brake pedal is utilized in opening certain ports in the treadle valve and is not used to pressurize air in the brake system. This leads to a lack of variation in the sensory feedback to the driver in the case of leaks, worn brake pads and other defects in the brake system.Air brake systems can degrade significantly with use and need periodic inspection and maintenance [2]. As a result, periodic maintenance inspections are performed by fleet owners and roadside enforcement inspections are carried out by state and federal inspection teams. The performance requirements of brakes in newly manufactured and “on-the-road”commercial vehicles in the United States are specified by the Federal Motor V ehicle Safety Standard (FMVSS) 121 [3]and the Federal Motor Carrier Safety Regulation (FMCSR) Part 393 [4], respectively. These regulations specify the stopping distance, deceleration and brake force that should be achieved when the vehicle is braked from an initial speed of 20 mph. Due to the difficulty in carrying out such tests on the road, equivalent methods have been developed to inspect the brake system. A chronology of the development of the various commercial vehicle brake testing procedures used in the United States can be found in [5].Inspection techniques that are currently used to monitor the air brake system can be broadly divided into two categories —“visual inspections”and “performance-based inspections”[6]. Visual inspections include observing the stroke of the push rod, thickness of the brake linings, checking for wear in other components and detecting leaks in the brake system through aural and tactile means. They are subjective, time-consuming and difficult on vehicles with a low ground clearance since an inspector has to go underneath a vehicle to check the brake system. In fact, the average time required for a typical current roadside inspection of a commercial vehicle is 30 min, with approximately half of the time spent on inspecting brakes [7]. Performance-based inspections involve the measurement of the braking force/torque, stopping distance, brake pad temperature, etc. A description of two performance-based brake testers —the roller dynamometer brake tester and the flat plate brake tester —and the associated failure criteria when an air brake system is tested with them can be found in [8]. It is appropriate to point out that, in an appraisal of the future needs of the trucking industry [9], the authors call for the development of improved methods of brake inspections.Also, in recent years, studies have been carried out to develop “Adaptive Cruise Control”(ACC)systems or “Autonomous Intelligent Cruise Control”(AICC) systems. The objective of these systems is to maintain a constant distance between two consecutive vehicles by mainly controlling the engine throttle and the brake system. While most of the research on ACC systems has focused on passenger cars, the benefits of implementing such systems on heavy trucks are significant [10].A typical ACC system for heavy trucks controls the engine throttle, the transmission and the brake system and will be interfaced with existing systems like the Antilock Braking System (ABS), Traction Control System (TCS), etc. A typical truck ABS monitors the speed of the wheels and modulates the brake system pressure in the event of an impending wheel lock-up [11]. The ABS consists of an Electronic Control Unit (ECU) that receives signals from the wheel speed sensors and processes this information to regulate the brake system pressure through modulator valves. It should be noted that ABS does not control the treadle valve to regulate the pressure in the brake system. It reduces the brake system pressure that is “commanded”by the driver when it senses an impending wheel lock-up. It cannot provide a higher pressure than that corresponding to the pedal input from the driver.It is important to note that the ABS modulates the brake system pressure only under conditions when a wheel lock-up is impending. The ABS is disengaged during “normal”braking operations. In fact, it has been pointed out in [12] that ABS is “passive during the vast majority of braking operations”. During such braking operations, the pressure of air in the brake system is the level that is commanded by the driver through the motion of the brake pedal. Hence, in order to implement ACC systems on commercial vehicles it is necessary to develop control schemes that will automatically regulate the brake system pressure during all braking operations.Motivated by the above issues, our overall objective is to develop model-based control and diagnostic systems for air brake systems. Such a model of the air brake system should correlate the pressure transients in all the brake chambers of the air brake system with the treadle valve plunger displacement (i.e., the displacement of the brake pedal) and the supply pressure of air provided from the reservoirs to the treadle and relay valves. We have already developed a model [13], and control and diagnostic schemes [14] and [15]based on this model, for the configuration of the air brake system where the primary circuit of the treadle valve is directly connected to one of the two front brake chambers. This model predicts the pressure transients in a front brake chamber during a given brake application with the input data being the treadle valve plunger displacement and the supply pressure to the treadle valve. In order to extend these control and diagnostic schemes, a model should be developed to predict the response of all the brake chambers in the air brake system. One of the steps involved in obtaining a model for the entire air brake system is to develop a model to predict the response of the relay valve, and this is the focus of this article.We will show in the subsequent sections that a relay valve has three phases (or modes) of operation and the evolution of pressure in each of the modes is different. The transition from one mode to another depends primarily on the pressure in the brake chamber and for this reason, it can be naturally modeled as a hybrid system.This article is organized as follows. In Section 2, we present a brief description of the air brake system and the experimental setup that has been constructed at Texas A&M University. A hybrid dynamical model of the relay valve to predict its pressure response is derived in Section 3. We present the equations governing the motion of the mechanical components in the relay valve and the flow of air in the system. This model is corroborated against experimental data and the resultsare provided in Section 4.2. A brief description of the air brake system and the experimental setupA layout of the air brake system found in a typical tractor is presented in Fig. 1. An engine-driven air compressor is used to compress air and the compressed air is collected in storage reservoirs. The pressure of the compressed air in the reservoirs is regulated by a governor. Compressed air is supplied from these reservoirs to the treadle and relay valves. The driver applies the brake by pressing the brake pedal on the treadle valve. This action meters the compressed air from the supply port of the treadle valve to its delivery port. Then, the compressed air travels from the delivery port of the treadle valve through air hoses to the relay valve (referred to as the service relay valve in Fig. 1) and the quick release valve and finally to the brake chambers mounted on the axles.Fig. 1. A general layout of a truck air brake system.View thumbnail imagesThe S-cam foundation brake, found in more than 85% of the air-braked vehicles in the United States [1], is illustrated in Fig. 2. Compressed air metered from the storage reservoirs enters the brake chamber and acts against the diaphragm, generating a force resulting in the motion of the push rod. The motion of the push rod serves to rotate, through the slack adjuster, a splined shaft on which a cam in the shape of an ‘S’is mounted. The ends of two brake shoes rest on the profile of the S-cam and the rotation of the S-cam pushes the brake shoes outwards so that the brake pads make contact with the rotating drum. This action results in the deceleration of the rotating drum. When the brake pedal is released by the driver, air is exhausted from the brake chamber and the push rod strokes back into the brake chamber thereby rotating the S-cam in the opposite direction. The contact between the brake pads and the drum is now broken and the brake is thus released.Fig. 2. The S-cam foundation brake.View thumbnail imagesA schematic of the experimental setup at Texas A&M University is provided in Fig. 3. Two “Type-20”brake chambers (having an effective cross-sectional area of 20 in2) are mounted on a front axle of a tractor and two “Type-30”brake chambers (having an effective cross-sectional area of 30 in2) are mounted on a fixture designed to simulate the rear axle of a tractor. The air supply to the system is provided by means of two compressors and storage reservoirs. The reservoirs are chosen such that their volume is more than twelve times the volume of the brake chambers that they provide air to, as required by the Federal Motor V ehicle Safety Standard (FMVSS) 121 [3]. Pressure regulators are mounted at the delivery ports of the reservoirs to control the supply pressure to the treadle valve and the relay valve. A cross-sectional view of the treadle valve used in the experiments is illustrated in Fig. 4. The treadle valve consists of two circuits —the primary circuit and the secondary circuit. The delivery port of the primary circuit is connected to the control port of the relay valve and the delivery ports of the relay valve are connected to the two rear brake chambers. The relay valve has a separate port for obtaining compressed air supply from the reservoir. The delivery port of the secondary circuit is connected to the Quick Release V alve (QRV) and the delivery ports of the QRV are connected to the two front brake chambers.Fig. 3. A schematic of the experimental facility.View thumbnail imagesFig. 4. A sectional view of the treadle valve.View thumbnail imagesThe treadle valve is actuated by means of a pneumatic actuator and compressed air is supplied to this actuator from the storage reservoirs through a pressure regulator. The displacement of the treadle valve plunger is measured by means of a displacement transducer. A pressure transducer is mounted at the entrance of each of the four brake chambers by means of a custom designed and fabricated pitot tube fixture. A displacement transducer is mounted on each of the two front brake chamber push rods through appropriately fabricated fixtures in order to measure the push rod stroke. All the transducers are interfaced with a connector block through shielded cables. The connector block is connected to a PCI-MIO-16E-4 Data Acquisition (DAQ) board [16] (mounted on a PCI slot inside a desktop computer) that collects the data during brake application and release. An application program is used to collect and store the data in the computer.3. Modeling the response of the relay valveIn this section, we shall present a description of the model of the relay valve. We adopt a lumped parameter approach in the development of this model. Friction at the sliding surfaces in the treadle and relay valves is neglected since they are well lubricated. The springs present in these valves have been experimentally found to be nearly linear in the range of their operation (except the rubber graduating spring used in the treadle valve, see Fig. 4) and the spring constants have been determined from experimental data. Other parameters such as areas, initial deflections, etc., are measured and used in the model.In this article, our objective is to develop a model for predicting the pressure transients in the rear brake chambers actuated by the relay valve during the brake application process. The relay valve is controlled by means of the compressed air delivered by the primary circuit of the treadle valve during a brake application. We shall consider the configuration of the brake system where the delivery port of the primary circuit of the treadle valve is connected to the control port of the relay valve. Compressed air is provided from the storage reservoirs to the relay valve at its supply port and one of the delivery ports of the relay valve is connected to a rear brake chamber. We shall measure the pressure transients at the primary delivery port of the treadle valve and in the rear brake chamber in our experiments. The pressure measured at the primary delivery port of the treadle valve will be provided as input to the numerical scheme that solves the model equations developed to predict the pressure transients in the rear brake chamber.When the driver presses the brake pedal, the primary piston in the treadle valve (see Fig. 4) first closes the primary exhaust port (by moving a distance equal to xpt) and then opens up the primary inlet port (xpp>xpt, xpp being the displacement of the primary piston from its initial position). This action serves to meter the compressed air from the reservoir to the primary delivery port. We shall refer to this phase as the “apply phase”. When the pressure in the primary circuit increases to a level such that it balances the force applied by the driver, the primary piston closes the primary inlet port with the exhaust port also remaining closed (xpp=xpt). We shall refer to this phase as the “hold phase”. When the driver releases the brake pedal, the primary piston return spring forces the primary piston to its initial position. This action opens the exhaust port (xpp<xpt) and air is exhausted from the primary delivery port to the atmosphere. We shall refer to this phase as the “exhaust phase”. A detailed derivation of the model of the treadle valve can be foundin [13].A schematic of the cross-sectional view of the relay valve used in our experimental setup is presented in Fig. 5. The compressed air from the delivery port of the primary circuit of the treadle valve enters the control port of the relay valve. The resulting force pushes the relay valve piston and the exhaust port of the relay valve is closed when the relay valve piston moves a distance equal to xrpt. Once the pre-loads on the relay valve assembly gasket are overcome, the inlet port of the relay valve is opened (xrpp>xrpt, xrpp being the displacement of the relay valve piston from its initial position). Compressed air is now metered from the supply port of the relay valve to its delivery port and subsequently to the rear brake chambers. This is the apply phase associated with the operation of the relay valve. When the pressure in the delivery port of the relay valve increases to a level such that it balances the forces acting on the relay valve piston due to the compressed air from the treadle valve, the inlet port of the relay valve is closed with its exhaust port also remaining closed (xrpp=xrpt). This is the hold phase associated with the operation of the relay valve. When the brake pedal is released by the driver, air is exhausted from the primary circuit of the treadle valve and consequently from the control port of the relay valve. Due to the presence of compressed air in the delivery port of the relay valve, the relay valve piston is pushed back to its initial position and this opens the exhaust port of the relay valve (xrpp<xrpt). Thus, air is exhausted from the delivery port of the relay valve to the atmosphere. This is the exhaust phase associated with the operation of the relay valve.Fig. 5. A sectional view of the relay valve.View thumbnail imagesThe equation of motion governing the mechanics of the operation of the relay valve piston and the relay valve assembly gasket during the apply and the hold phases is given by(1)where Mrpp and Mrv denote respectively the mass of the relay valve piston and the relay valve assembly gasket, xrpp denotes the displacement of the relay valve piston from its initial position, xrpt is the distance traveled by the relay valve piston before it closes the relay valve exhaust port, Krv is the spring constant of the relay valve assembly return spring, Fkrvi is the pre-load on the same, Arpp is the net area of the relay valve piston exposed to the pressurized air at the control port of the relay valve, Arpp1 is the net area of the relay valve piston exposed to the pressurized air at the delivery port of the relay valve, Arpp2 is the net area of the relay valve piston exposed to the exhaust port of the relay valve, Arv1 is the net cross-sectional area of the relay valve assembly gasket exposed to the pressurized air at the supply port of the relay valve, Arv2 is the net cross-sectional area of the relay valve assembly gasket exposed to the pressurized air at the delivery port of the relay valve, Ppd is the pressure of air at the delivery port of the primary circuit of the treadle valve, Prs is the pressure of air being supplied to the relay valve, Prd is the pressure of air at the delivery port of the relay valve and is the atmospheric pressure.The mass of the relay valve piston is of the order of around 0.1 kg and the magnitude of the spring and pressure forces is found to be of the order of 102 N. Thus, the acceleration required for the inertial forces to be comparable with the spring force and the pressure force terms has to be of theorder of 102–103 m/s2, which is not the case. Hence the inertial forces are neglected and the above equation reduces to(2)The equation of motion of the relay valve piston during the exhaust phase is given by(3)Neglecting inertial forces, the above equation reduces to(4)PpdArpp=Prd(Arpp1+Arpp2).Next, we will consider the flow of air in the portion of the brake system under study. The relay valve opening is modeled as a nozzle. For the flow through a restriction, if the ratio of the cross-sectional area of the upstream section to the cross-sectional area of the restriction is 4.4 or higher, the approach velocity to this restriction can be neglected and the upstream properties (such as pressure, enthalpy, temperature, etc.) can be taken to be the upstream total or stagnation properties [17]. In our case, the minimum ratio of the cross-sectional area of the supply chamber of the relay valve to the cross-sectional area of the relay valve opening (the restriction) is found to be more than this value. Hence, we can consider the valve opening as a nozzle and take the properties in the supply chamber of the valve as the stagnation properties at the inlet section of the nozzle. The flow through the nozzle is assumed to be one-dimensional and isentropic. We also assume that the fluid properties are uniform at all sections in the nozzle. Air is assumed to behave like an ideal gas with constant specific heats. Under the above assumptions, the part of the pneumatic subsystem under consideration can be visualized as illustrated in Fig. 6.Fig. 6. The simplified visualization of the pneumatic subsystem under consideration.View thumbnail imagesThe energy equation for the flow of air through the nozzle under the above assumptions can be written as [18](5)where ho is the specific stagnation enthalpy at the entrance section of the nozzle, h is the specific enthalpy at the exit section of the nozzle and u is the magnitude of the velocity of air at the exit section of the nozzle.For isentropic flow of an ideal gas with constant specific heats, the pressure (P), density (ρ) and temperature (T) are related by(6)where γis the ratio of specific heats.The mass flow rate of air from the relay valve opening at any instant of time (denoted by ) isgiven bywhere Ap is the cross-sectional area of the valve opening. This is the rate at which air is accumulating in the hoses and the brake chamber once the relay valve is actuated. Since we lump the properties of air inside the hose and the brake chamber, the mass of air in the brake chamber at any instant of time is obtained from the ideal gas equation of state as(8)where Vb is the volume of air in the brake chamber and Trd is the temperature of air in the brake chamber at that instant of time.Let us now consider the mechanics of the operation of the brake chamber. A cross-sectional view of the brake chamber is shown in Fig. 7. When the brake is applied, the brake chamber diaphragm starts to move only after a minimum threshold pressure is reached. This pressure is required to overcome the pre-loads on the diaphragm. When this pressure is attained in the brake chamber, the diaphragm moves such that the push rod is pushed out of the brake chamber. Once the brake pads contact the brake drum and steady state is reached, the volume of air in the brake chamber will be the maximum during that particular brake application. Thus, the volume of air in the brake chamber at any instant of time during the brake application process is given by(9)where V o1 is the initial volume of air in the brake chamber before the application of the brake, V o2 is the maximum volume of air in the brake chamber, Ab is the cross-sectional area of the brake chamber, xb is the displacement of the brake chamber diaphragm, i.e., the stroke of the push rod, and xbmax is the maximum stroke of the push rod.Fig. 7. A sectional view of the brake chamber.View thumbnail imagesIn our current experimental setup, the rear brake chambers are mounted on a fixture and the end of the push rod outside the brake chamber is not connected to a slack adjuster. The push rod is brought to rest during a given brake application when it strikes a plate mounted with its face perpendicular to the direction of motion of the push rod. The position of this plate can be adjusted to vary the push rod stroke. Hence, a reasonable model for the brake chamber is given by(10)where Mb is the mass of the brake chamber diaphragm, Kb is the spring constant of the brake chamber return spring and Fkbi is the pre-load on the brake chamber diaphragm return spring. It should be noted that the pressure of air in the rear brake chamber at any instant of time is assumed to be the same as the pressure of air at the delivery port of the relay valve at that instant of time. Neglecting inertial forces when compared to the force due to the pressure and spring forces, the above equation reduces toIn the case of a brake chamber mounted on an actual axle, the relationship between the push rod stroke and the brake chamber pressure has been found to be different than the one given by Eq.(11) due to the presence of additional components such as the slack adjuster, S-cam, brake pads and brake drum [15]. Thus, the model relating the push rod stroke and the brake chamber pressure for a rear brake chamber mounted on an actual rear axle should be developed as described in [15]. Differentiating Eq. (8) with respect to time and comparing the result with Eq. (7), and using Eqs.(5), (6), (9) and (11), we obtain the equation describing the pressure response of the relay valve during the apply and hold phases as(12)where Trs is the temperature of the air being supplied to the relay valve, CD is the discharge coefficient, R is the specific heat of air, γis the ratio of specific heats of air (both R and γare assumed to be constants) and(13)Ap=2πrrv(xrpp−xrpt),with rrv being the external radius of the relay valve inlet section. The discharge coefficient (CD) is used in order to compensate for the losses during the flow. Due to the complexity involved in calibrating the valve to determine the value of the discharge coefficient, we assumed a value of 0.82 for CD as recommended in [17]. The pressure transients in the brake chamber during the apply and hold phases are obtained by solving Eqs. (2) and (12) along with the initial condition that at the start of a given brake application, the brake chamber pressure is equal to the atmospheric pressure.4. Corroboration of the modelIn this section, we corroborate the model for the relay valve by comparing its predictions against experimental data obtained from various test runs carried out over a range of supply pressures. It should be noted that the typical supply pressure in air brake systems is usually between 825.3 kPa (105 psig) and 928.8 kPa (120 psig) and this is the pressure range provided by the compressor used in our experimental setup. Eqs. (2) and (12) are solved numerically to obtain the pressure transients in the rear brake chamber during the apply and hold phases of a given brake application. The pressure measured at the delivery port of the primary circuit of the treadle valveis given as the input data to the numerical scheme. The prediction of the model for a test run is compared with the data collected during that test run and the results from various test runs are presented in Fig. 8, Fig. 9, Fig. 10, Fig. 11 and Fig. 12. In these figures, time (in seconds) and brake chamber pressure (in Pa) have been plotted on the abscissa and the ordinate respectively. The value corresponds to that instant of time at which the computer program for collecting the data is started.Fig. 8. Pressure transients at 653 kPa (80 psig) supply pressure —apply phase.View thumbnail imagesFig. 9. Pressure transients at 722 kPa (90 psig) supply pressure —apply phase.View thumbnail imagesFig. 10. Pressure transients at 584 kPa (70 psig) supply pressure —apply and exhaust phases. View thumbnail imagesFig. 11. Pressure transients at 653 kPa (80 psig) supply pressure —apply and exhaust phases. View thumbnail imagesFig. 12. Pressure transients at 584 kPa (70 psig) supply pressure —repeated application.View thumbnail imagesIt can be observed from these figures that the model is able to predict the beginning and end of each brake application reasonably well. The steady state brake chamber pressure is also predicted well by the model in all the cases. The model has also captured the pressure transients well in the exhaust phase during a complete brake application and release cycle as shown in Fig. 10 and Fig. 11. It has also predicted the pressure transients well in the case of repeated brake applications as can be observed from Fig. 12.5. ConclusionsIn this article, we have developed a hybrid model for predicting the response of the relay valve used in air brake systems of commercial vehicles. The relay valve is actuated by the compressed air from the delivery port of the primary circuit of the treadle valve. We have presented the main governing equations for the pressure transients in a rear brake chamber attached to a delivery port of the relay valve. We have corroborated this model using data obtained from experimental test runs performed over a range of supply pressures. We plan to incorporate this model of the relay valve into an overall model of the air brake system which can be used in control and diagnostic applications.References[1]S.F. Williams, R.R. Knipling, Automatic slack adjusters for heavy vehicle air brake systems, Tech. Rep. DOT HS 807 724, National Highway Traffic Safety Administration, Washington, D. C., February 1991。
毕设英文翻译英文版
72页Machine Tools Objectived.Machine tools are the main engines of the manufacturing industry. This chapter covers a few of the details that are common to all classes of machine tools discussed in this book. After completing the chapter, the reader will be able to>understand the classification of the various machine tools used in manufacturing industries.>identify the differences between generating and forming of surfaces. > identify various methods used to generate different types of surfaces. >distinguish between the different accuracies and surface finishes that are achievable with different machine tools.>understand the different components of the machine tools and their functions.>learn about the different support structures used in the machine tools. >understand the various actuation systems that are useful to generate the required surfaces.>Learn the different types of guideways used in the machine tools.>understand the work holding requirements.3.1 INTRODUCTIONThe earliest known machine tools are the Egyptian foot-operated lathes.These machine tools were developed essentially to allow for the introduction of accuracy in manufacturing.A machine tool is defined as one which while holding the cutting tools, would be able to remove metal from a workpiece in order to generate the requisite job of given size, configuration, and finish. It is different from a machine, which is essentially a means of converting the source of power from one form to the other. The machine tools are the mother machines since without them, no components can be produced in their finished form. They are very old and the industrial revolution owes its success to them.A machine tool is required to provide support to the workpiece and cutting tools as well as provide motion to one or both of them in order to generate the required shape on the workpiece. The form generated depends upon the type of machine tool used.In the last two centuries, the machine tools have been developed substantially. The machine tool versatility has grown to cater to the varied needs Of the new inventors coming with major developments. For example,James Watt's steam engine could be proven only after a satisfactory method was found to bore the engine cylinder with a boring bar by Wilkinson around 1775.A machine tool is designed to perform certain primaryfunctions,but the extent to which it can be exploited to perform secondary functions is a measure of its flexi bility.Generally,the flexibility of the machine tool is inc reased by the use of secondary functional attachments,s uch as radius or spherical turning attachment for a cent re lathe.Alternatively,to improve productivity,special atta chments are added,which also reduce the flexibility.3.2CLASSIFICATION OF MACHINE TOOLSThere are many ways in which the machine tools can be classified.One such classification based on the produc tion capability and application is shown below:1.General purpose machine tools(GPM)are those designed to perform a variety of machining operations on a wide range of components.By the very nature of generalisation,the general purpose machine tools are thou gh capable of carrying out a variety of tasks,would no t be suitable for large production,since the setting time for any given operation is large.Thus,the idle time on the general purpose machine tools is more and the mac hine utilisation is poor.The machine utilisation may be termed as the percentage of actual machining or chip g enerating time to the actual time available.This is much lower for the general purpose machine tools.They m ay also be termed as the basic machine tools. Further,skilled operators would be required to run the general purpose machine tools.Hence,their utility is in job shops,such as catering to small batch and large v ariety job production,where the requirement is versatility rather than production capability.Examples are lathe,shaper,and milling machine.2Production machine tools are those where a number of functions of the machine tools are automated such t hat the operator skill required to produce the component is reduced.Also,this would help in reducing the idle t ime of the machine tool,thus improving the machine ut ilisation.It is also possible that a general purpose machi ne tool may be converted into a production machine to ol by the utilisation of jigs and fixtures for holding the workpiece.These have been developed from the basic m achine tools.Some examples are capstan lathes,turret la thes,automats,and multiple spindle drilling ma chines. The setting time for a given job is more.Also,tooling design for a given job is more time consuming and ex pensive.Hence the production machine tools can only beused for large volume production.3.Special purpose machine tools(SPM)are those mac hine tools in which the setting operation for the job a nd tools is practically eliminated and complete automationi s achieved.ms greatly reduces the actual manufacturing t ime of a component and helps in the reduction of cos ts.These tools are used for mass manufacturing.These machine tools are expensive compared to the general pur pose machines since they are specifically designed for the given application,and are restrictive in their application c apabilities.Examples are cam shaft grinding machine,conn ecting rod twin boring machine,and piston turning lathe.4.Single purpose machine tools are those,which are designed specifically for doing a single operation ona class of jobs or on a single job.These tools ha ve thehighest amount of automation and are used for really high rates of production.These are used specifically for one product only,and thus have the least flexibili ty.However,these do not require any manual interven tion andare most cost effective.Examples are transfer linescomposed of unit heads for completely machining any given product.The application of the above four types can be shown graphically in Fig. 3.1.Fig. 3.1Application of machine tools based on the capability. 3.3GENERATING AND FORMINGGenerally,the component shape is produced in machine tools by two different techniques,generating and forming. Generating is the technique in which the required pr ofile is obtained by manipulating the relative motionsof the workpiece and the cutting tool edge.Thus,the obtained contour would not be identical to the shape of the cutting tool edge.This is generally used for a majority of the general profiles required.The type of surface generated depends on the primary motion ofthe workpiece as well as the secondary or feed motio n of the cutting tool.For example,when the workpiece is rotated and a single point tool is moved along a straight line paralle l to the axis ofrotation of the workpiece,a helical s urface is generated,as shown in Fig. 3.2(a).If the pitch of the helix or feed rate is extremely small,or the surface generated may be approximated to a cylin der.This is carried out in ladles and is called turning or cylindrical turning.Fig. 3.2Generating and forming of surfaces by machine tools.An alternate method of obtaining the given profile is called forming in which,the shape of the cutting toolis impressed upon the workpiece,as shown in fig. 3.2 (b).Thus,the accuracy Of the obtained shape dependupon the accuracy of the form of the tool used.However,many of the machine tool operations areactually combinations of the above two.For example. when a dove tail is cut,the actual profile is obtained by sweeping the angular cutter along the straight line. Thus,it involves forming(angular cutter profile)and gene rating(sweeping along a line),as shown in Fig. 3.3.Fig3.3Generation of surface.3.4METHODS OF GENERATING SURFACESFig. 3.4Classification of machine tools using single point cuttingtools.A large number of surfaces can be generated or formed with the help of the motions given to the tooland the workpiece.The shape of the tool also makesa very important contribution to the final surface obtaine d Basically,there are two types of motions given in a machine tool.The primary motion given to the workpiece or cutting tool constitutes the cutting speed,which cause s a relative motion between the tool and workpiece suc h that the face of the cutting tool approaches the mat erial to be ually,the primary motion consum es most of the cutting power.The secondary motion is one which feeds the tool relatively past the workpiece. The combination of the primary and secondary motions is responsible for the generation of specific surfaces.Someti mes,there would be a tertiary movement in between thecuts for specific surfaces.A classification of machine tools based on the motions is shown in Fig. 3.4,for single point tools,an d Fig. 3.5for multi-point tools.In the case of job rot ation,cylindrical surfaces would be generated,as shown i n Fig. 3.6,when a tool is fed in a direction parallelto the axis of rotation.When the feeding direction is not parallel to the axis of rotation,complex surfaces, such as cones(Fig. 3.7),or contours(Fig. 3.8)can begenerated.The tools used in the above cases are of si ngle point.If the tool motion is perpendicular to the a xis of rotation,a plane surface would be generated,as shown in Fig. 3.9.However,if a cutting tool of a giv en form is fed in a direction perpendicular to the axis of rotation,also called plunge cutting,a contour surface of revolution would be obtained,as shown in Fig. 3.10.Fig. 3.5Classification of machine tools using multi-point cutting tools. Plane surface generation in shaping Plane surfaces can be generated when the job or tool reciprocates for the primary motion,as shown in Fig. 3.11,without any rota tion.With the multi-point tools generally plane surfaces aregene rated,as shown in Fig. 3.12.However,in this situation, a combination of forming and generating,is used to get a variety of complex surfaces,which are otherwise i mpossible to get through the single-point tool operations. Some typical examples are the spur gear hobbing and spiral milling of formed cavities.3.5ACCURACY AND FINISH ACHIEVABLEIt is necessary to select a given machine tool or m chining operation for a job such that it is the lowest cost option.There are various operations possible for a given type of surface and each one has its own charac teristics in terms of possible accuracy,surface finish,and cost.This selection is made at the time of process pla nning.The obtainable accuracy for various types of machi ne tools is shown in Table 3.1.The surface finish expe cted from the various processes is shown in Fig. 3.13.The values presented in Table 3.1and Fig. 3.13areonly a rough guide.The actual values greatly vary depe nding on the condition of the machine tool,the cutting tool used,and the various cutting process parameters.80Manufacturing TechnologyBASIC ELEMENTS OF MACHINE TOOLS3.6 BASIC ELEMENTS OF MACHINE TOOLSThe various components that are present in all the mac hine tools may be identified as follows:•Work holding device to hold the workpiece in the correct orientation to achieve the required in manufacturin g,for example chuck.•Tool holding device to hold the cutting tool in the correct position with respect to the workpiece,and provi de enough holding force to counteract the cutting forces acting on the tool,example tool•Work motion mechanism to provide the necessary sp eed to the workpiece for generating the surface,example head stock.•Tool motion mechanism to provide the various motio ns needed for the tool in conjunction with workpiece m otion in order to generate the required surface profiles, example carriage.•Support structure to support all the mechanisms sho wn above,and maintain their relative position with respe ct to each other,and allow for relative movement betw een the various parts to obtain the*requisite part pr ofile and accuracy,example bed.The type of device or mechanism used varies depending on the type of machine tool and the function it is expected to serve.In this chapter,someof the more common elements would be discussed.How ever,further details may be found in the chapters wher e the actual machine tools are discussed.The various motions that need to be provided in the machine tool are cutting speed and feed.The range of speed and feed rates to be provided in a given machi ne tool depends on the capability of the machine tool and the range of work materials that are expected to be processed.Basically,the actual speed and feed chosen depends upon the•work material,•required production rate,•required surface finish,and•expected accuracy.The drive units in a machine tool are expected to provide the required speed and convert the rotational sp eed into linear motion.Details of these may be foundin books dealing with machine tool design.3.7 SUPPORT STRUCTURESThe broad categories of support structures found in vario us machine tools are shown in Fig. 3.14.They may be classified as beds(horizontal structures)or columns(vertic al structures).The main requirements of the support structure are •Rigidity•Accuracy of guideways•Impact resistance•Wear resistanceBed provides a support for all the elements presentin a machine tool.It also provides the true relative po sitions Of all units in machine tools.Some of these un its may be sliding on the bed or fixed.For the purpo se Of sliding,accurate guideways are provided.Bed weig ht is approximately half the total weight of the machine tool.The basic construction of a bed is like a box,to provide the highest possible rigidity with low weight.To increase the rigidity,the basic box structure is added wi th various types of ribs,as shown in Fig. 3.15.The a ddition of ribs complicates the manufacturing process for the beds.Beds are generally constructed using cast iron or alloy c ast iron consisting of alloying elements,such as nickel,c hromium,and molybdenum.With cast iron,because of t he intricate designs of the beds,the casting defects may not be fully eliminated.Alloy steel structure is also used for making beds. The predominant manufacturing method used is welding.T he following advantages can be claimed for steel constru ction:(a)With steels,the wall thickness can be reduced .Thus,greater strength and stiffness for the same weight would be possible with alloy steel bed construction.(b)Walls of different thicknesses can be conveniently welded.Whereas in casting,this would create problems.(c)Repair of welded structures would be easier.(d)Large machining allowances would have to be provi ded for casting to remove the defects and hard Concrete is also tried as bed material.Its choice is ma inly because of the large damping capacity.For precision machine tools and measuring machines,granite is also us ed as the bed material.The major types of bed styles used in the machine tools are shown in Fig. 3.16.。
毕业设计英文翻译(英文)
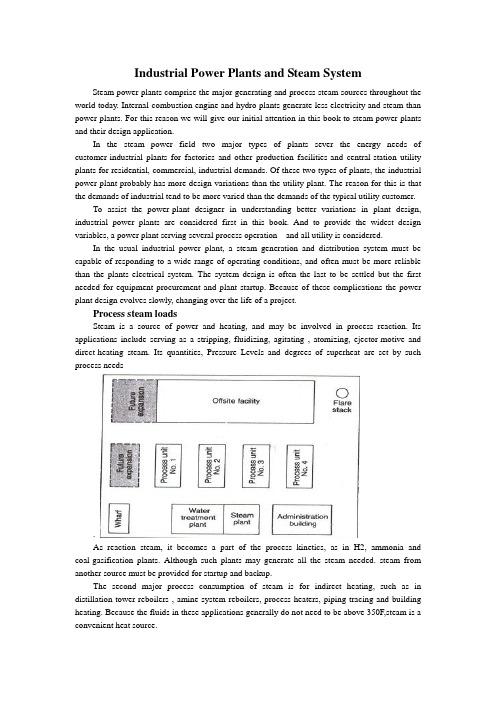
Industrial Power Plants and Steam SystemSteam power plants comprise the major generating and process steam sources throughout the world today. Internal-combustion engine and hydro plants generate less electricity and steam than power plants. For this reason we will give our initial attention in this book to steam power plants and their design application.In the steam power field two major types of plants sever the energy needs of customer-industrial plants for factories and other production facilities-and central-station utility plants for residential, commercial, industrial demands. Of these two types of plants, the industrial power plant probably has more design variations than the utility plant. The reason for this is that the demands of industrial tend to be more varied than the demands of the typical utility customer.To assist the power-plant designer in understanding better variations in plant design, industrial power plants are considered first in this book. And to provide the widest design variables, a power plant serving several process operation and all utility is considered.In the usual industrial power plant, a steam generation and distribution system must be capable of responding to a wide range of operating conditions, and often must be more reliable than the plants electrical system. The system design is often the last to be settled but the first needed for equipment procurement and plant startup. Because of these complications the power plant design evolves slowly, changing over the life of a project.Process steam loadsSteam is a source of power and heating, and may be involved in process reaction. Its applications include serving as a stripping, fluidizing, agitating , atomizing, ejector-motive and direct-heating steam. Its quantities, Pressure Levels and degrees of superheat are set by such process needs.As reaction steam, it becomes a part of the process kinetics, as in H2, ammonia and coal-gasification plants. Although such plants may generate all the steam needed. steam from another source must be provided for startup and backup.The second major process consumption of steam is for indirect heating, such as in distillation-tower reboilers , amine-system reboilers, process heaters, piping tracing and building heating. Because the fluids in these applications generally do not need to be above 350F,steam is a convenient heat source.Again, the quantities of steam required for the services are set by the process design of the facility. There are many options available to the process designer in supplying some of these low-level heat requirements, including heat-exchange system , and circulating heat-transfer-fluid systems, as well as system and electricity. The selection of an option is made early in the design stage and is based predominantly on economic trade-off studies.Generating steam from process heat affords a means of increasing the overall thermal efficiency of a plant. After providing for the recovery of all the heat possible via exchanges, the process designer may be able to reduce cooling requirements by making provisions for the generation of low-pressure(50-150 psig)steam. Although generation at this level may be feasible from a process-design standpoint, the impact of this on the overall steam balance must be considered, because low-pressure steam is excessive in most steam balances, and the generation of additional quantities may worsen the design. Decisions of this type call close coordination between the process and utility engineers.Steam is often generated in the convection section of fired process heaters in order to improve a plant’s thermal efficiency. High-pressure steam can be generated in the furnace convection section of process heater, which have radiant heat duty only.Adding a selective –catalytic-reduction unit for the purpose of lowing NOx emissions may require the generation of waste-heat steam to maintain correct operating temperature to the catalytic-reduction unit.Heat from the incineration of waste gases represents still another source of process steam. Waste-heat flues from the CO boilers of fluid-catalytic crackers and from fluid-coking units, for example, are hot enough to provide the highest pressure level in a steam system.Selecting pressure and temperature levelsThe selecting of pressure and temperature levels for a process steam system is based on:(1)moisture content in condensing-steam turbines,(2)metallurgy of the system,(3)turbine water rates,(4)process requirements ,(5)water treatment costs, and(6)type of distribution system.Moisture content in condensing-steam turbines---The selection of pressure and temperature levels normally starts with the premise that somewhere in the system there will be a condensing turbine. Consequently, the pressure and temperature of the steam must be selected so that its moisture content in the last row of turbine blades will be less than 10-13%. In high speed, a moisture content of 10%or less is desirable. This restriction is imposed in order to minimize erosion of blades by water particles. This, in turn, means that there will be a minimum superheat for a given pressure level, turbine efficiency and condenser pressure for which the system can be designed.System mentallurgy- A second pressure-temperature concern in selecting the appropriate steam levels is the limitation imposed by metallurgy. Carbon steel flanges, for example, are limited to a maximum temperature of 750F because of the threat of graphite (carbides) precipitating at grain boundaries. Hence, at 600 psig and less, carbon-steel piping is acceptable in steam distribution systems. Above 600 psig, alloy piping is required. In a 900- t0 1,500-psig steam system, the piping must be either a r/2 carbon-1/2 molybdenum or a l/2 chromium% molybdenum alloyTurbine water rates - Steam requirements for a turbine are expressed as water rate, i.e., lb of steam/bph, or lb of steam/kWh. Actual water rate is a function of two factors: theoretical water rate and turbine efficiency.The first is directly related to the energy difference between the inlet and outlet of a turbine, based on the isentropic expansion of the steam. It is, therefore, a function of the turbine inlet and outlet pressures and temperatures.The second is a function of size of the turbine and the steam pressure at the inlet, and of turbine operation (i.e., whether the turbine condenses steam, or exhausts some of it to an intermediate pressure level). From an energy stand point, the higher the pressure and temperature, the higher the overall cycle efficiency. _Process requirements - When steam levels are being established, consideration must be given to process requirements other than for turbine drivers. For example, steam for process heating will have to be at a high-enough pressure to prevent process fluids from leaking into the steam. Steam for pipe tracing must be at a certain minimum pressure so that low-pressure condensate can be recovered.Water treatment costs - The higher the steam pressure, the costlier the boiler feedwater treatment. Above 600 psig, the feedwater almost always must be demineralized; below 600 psig, soft,ening may be adequate. It may have to be of high quality if the steam is used in the process, such as in reactions over a catalyst bed (e.g., in hydrogen production).Type of distribution system - There are two types of systems: local, as exemplified by powerhouse distribution; and complex, by wluch steam is distributed to many units in a process plant. For a small local system, it is not impractical from a cost standpoint for steam pressures to be in the 600-1,500-psig range. For a large system, maintaining pressures within the 150-600-psig range is desirable because of the cost of meeting the alloy requirements for higher-pressure steam distribution system.Because of all these foregoing factors, the steam system in a chemical process complex or oil refinery frequently ends up as a three-level arrangement. The highest level, 600 psig, serves primarily as a source of power. The intermediate level, 150 psig, is ideally suitable for small emergency turbines, tracing off the plot, and process heating. The low level, normally 50 psig, can be used for heating services, tracing within the plot, and process requirements. A higher fourth level normally not justified, except in special cases as when alarge amount ofelectric power must be generated.Whether or not an extraction turbine will be included in the process will have a bearing on the intermediate-pressure level selected, because the extraction pressure should be less than 50% of the high-pressure level, to take into account the pressure drop through the throttle valve and the nozzles of the high-pressure section of' the turbine.Drivers for pumps and compressorsThe choice between a steam and an electric driver for a particular pump or compressor depends on a number of things, including the operational philosophy. In the event of a power failure, it must be possible to shut down a plant orderly and safely if normal operation cannot be continued. For an orderly and safe shutdown, certain services must be available during a power failure: (1) instrument air, (2) cooling water, (3) relief and blow down pump out systems, (4) boiler feedwater pumps, (5) boiler fans, (6) emergency power generators, and (7) fire water pumps.These services are normally supplied by steam or diesel drivers because a plant's steam or diesel emergency system is considered more reliable than an electrical tie-line.The procedure for shutting down process units must be analyzed for each type of processplant and specific design. In general, the following represent the minimum services for which spare pumps driven by steam must be provided: column reflux, bottoms and purge-oil circulation, and heater charging. Most important is to maintain cooling; next, to be able to safely pump the plant's inventory into tanks.Driver selection cannot be generalized; a plan and procedure must be developed for each process unit.The control required for a process is at times another consideration in the selection of a driver. For example, a compressor may be controlled via flow or suction pressure. The ability to vary driver speed, easily obtained with a steam turbine, may be basis for selecting a steam driver instead of a constant-speed induction electric motor. This is especially important when the molecular weight of the gas being compressed may vary, as in catalytic-cracking and catalytic-reforming processes.In certain types of plants, gas flow must be maintained to prevent uncontrollable high-temperature excursions during shutdown. For example, hydrocrackers are purged of heavy hydrocarbon with recycle gas to prevent the exothermic reactions from producing high bed temperatures. Steam-driven compressors can do this during a power failure.Each process operation must be analyzed from such a safety viewpoint when selecting drivers for critical equipment. The size of a relief and blowdown system can be reduced by installing steam drivers. In most cases, the size of such a system is based on a total power failure. If heat-removal powered by steam drivers, the relief system can be smaller. For example, a steam driver will maintain flow in the pump-around circuit for removing heat from a column during a power failure, reducing the relief load imposed on the flare system.Equipment support services (such as lubrication and sea-oil systems for compressors) that could be damaged during a loss of power should also be powered by steam drivers.Driver size can also be a factor. An induction electric motor requires large starting currents - typically six times the normal load. The drop in voltage caused by the startup of such a motor imposes a heavy transient demand on the electrical distribution system. For this reason, drivers larger than 10,000 hp are normally steam turbines, although synchronous motors as large as 25,000 hp are used.The reliability of life-support facilities - e.g., building heat, potable water, pipe tracing, emergency lighting-during power failures is of particular concern mates. In such a case, at least one boiler should be equipped with steam-driven auxiliaries to provide these services.Lastly, steam drivers are also selected for the purpose of balancing steam systems and avoiding large amounts of letdown between steam levels. Such decisions regarding drivers are made after the steam balances have been refined and the distribution system has been fully defined. There must be sufficient flexibility to allow balancing the steam system under all operating conditions.Selecting steam driversAfter the number of steam drivers and their services have been established, the utility, or process engineer will estimate the steam consumption for making the steam balance.The standard method of doing this is to use the isentropic expansion of steam correeted for turbine efficiency.Actual steam consumption by a turbine is determined via:SR = (TSR)(bhp)/EHere, SR = actual steam rate, lb/h; TSR = theoretical steam rate, lb/hr/bhp ; bhp = turbine brake horsepower; and E = turbine efficiency.When exhaust steam can be used for process heating, the highest thermodynamic efficiency can be achieved by means of backpressure turbines. Large drivers, which are of high efficiency and require low theoretical steam rates, are normally supplied by the high-pressure header, thus minimizing steam consumption.Small turbines that operate only in emergencies can be allowed to exhaust to atmosphere. Although their water rates are poor, the water lost in short-duration operations may not represent a significant cost. Such turbines obviously play a small role in steam balance planning.Constructing steam balancesAfter the process and steam-turbine demands have been established, the next step is to construct a steam balance for the chemical complex or oil refinery. A sample balance is shown in Fig. 1-4. It shows steam production and consumption, the header systems, letdown stations, and boiler plant. It illustrates a normal (winter) case.It should be emphasized that there is not one balance but a series, representing a variety of operating modes. The object of the balances is to determine the design basis for establishing boiler she, letdown stations and deaerator capacities, boiler feedwater requirements, and steam flows in various parts of the system.The steam balance should cover the following operating modes: normal, all units operating; winter and summer conditions; shutdown of major units; startup of major units; loss of largest condensate source; power failure with flare in service; loss of large process steam generators; and variations in consumption by large steam users.From 50 t0 100 steam balances could be required to adequately cover all the major impacts on the steam system of a large complex.At this point, the general basis of the steam system design should have been developed by the completion of the following work:1. All significant loads have been examined, with particular attention focused on those for which there is relatively little design freedom - i.e., reboilers, sparing steam for process units, large turbines required because of electric power limitation and for shutdown safety.2. Loads have been listed for which the designer has some liberty in selecting drivers. These selections are based on analyses of cost competitiveness.3. Steam pressure and temperature levels have been established.4. The site plan has been reviewed to ascertain where it is not feasible to deliver steam or recover condensate, because piping costs would be excessive.5. Data on the process units are collected according to the pressure level and use of steam - i.e., for the process, condensing drivers and backpressure drivers.6. After Step 5, the system is balanced by trial-and-error calculations or computerized techniques to determine boiler, letdown, deaerator and boiler feedwater requirements.7. Because the possibility of an electric power failure normally imposes one of the major steam requirements, normal operation and the eventuality of such a failure must both be investigated, as a minimum.Checking the design basisAfter the foregoing steps have been completed, the following should be checked:Boiler capacity - Installed boiler capacity would be the maximum calculated (with an allowance of l0-20% for uncertainties in the balance), corrected for the number of boilers operating (and on standby).The balance plays a major role in establishing normal-case boiler specifications, both number and size. Maximum firing typically is based on the emergency case. Normal firing typically establishes the number of boilers required, because each boiler will have to be shut down once a year for the code-required drum inspection. Full-firing levels of the remaining boilers will be set by the normal steam demand. The number of units required (e.g., three 50% units, four 33%units, etc.) in establishing installed boiler capacity is determined from cost studies. It is generally considered double-jeopardy design to assume that a boiler will be out of service during a power failure.Minimum boiler turndown - Most fuel-fired boilers can be operated down to approximately 20% of the maximum continuous rate. The maximum load should not be expected to be below this level.Differences between normal and maximum loads –If the maximum load results from an emergency (such as power failure), consideration should be given to shedding process steam loads under this condition in order to minimize in- stalled boiler capacity. However, the consequences of shedding should be investigated by the process designer and the operating engineers to ensure the safe operation of the entire process.Low-level steam consumption - The key to any steam balance is the disposition of low-level steam. Surplus low-level steam can be reduced only by including more condensing steam turbines in the system, or devising more process applications for it, such as absorption refrigeration for cooling process streams and ranking-cycle systems for generating power. In general, balancing the supply and consumption of low-level steam is a critical factor in the design of the steam system.Quantity of steam at pressure-reducing stations - Because useful work is not recovered from the steam passing through a pressure-reducing station, such flow should be kept at a minimum. In the Fig. 1-5 150/50-psig station, a flow of only 35,000 lb/h was established as normal for this steam balance case (normal, winter). The loss of steam users on the 50-psig systems should be considered, particularly of the large users, because a shutdown of one may demand that the 150/50-psig station close off beyond its controllable limit. If this happened, the 50-psig header would be out of control, and an immediate-pressure buildup in the header wouldbegin, setting off the safety relief valves.The station's full-open capacity should also be checked to ensure that it can make up any 50-psig steam that may be lost through the shutdown of a single large 50-psig source (a turbine sparing a large electric motor, for example}. It would be undesirable for the station to be sized so that it opens more than 80%. In some cases, range ability requirements may dictate two valves (one small and one large).Intermediate pressure level - If large steam users or suppliers may come on stream or go off steam, the normal(day-to-day) operation should be checked. No such change in normal operation should result in a significant upset (e.g.,relief valves set off, or the system pressure control lost).If a large load is lost, the steam supply should be reduced by the letdown-station. If the load suddenly increases, the 600/150-psig station must be able of supplying the additional steam. If steam generated via the process disappears, the station must be capable of making up theload. If150-psig steam is generated unexpectedly, the 600/150-psig station must be able to handle the cutback.The important point here is that where the steam flow could rise t0 700,000 lb/h, this flow should be reduced by a cutback at the 600/150-psig station, not by an increase in the flow to the lower-pressure level, because this steam would have nowhere to go. The normal (600/150-psig) letdown station must be capable of handling some of the negative load swings, even though, overall, this letdown needs to be kept to a minimum.On the other hand, shortages of steam at the 150-psig level can be made up relatively easily via the 600/150-psig station. Such shortages are routinely small in quantity or duration, or both-(startup, purging, electric drive maintenance, process unit shutdown, etc.)High-pressure level - Checking the high-pressure level is generally more straightforward because rate control takes place directly at the boilers. Firing can be increased or lowered to accommodate a shortage or surplus.Typical steam-balance casesThe Fig. 1-4 steam balance represents steady-state condition, winter operation, all process units operating, and no significant unusual demands for steam.An analysis similar to the foregoing might also be required for the normal summertime case, in which a single upset must not jeopardize control but the load may be less (no tank heating, pipe tracing, etc.)The balance representing an emergency (e.g., loss of electric power) is significant. In this case, the pertinent test point is the system's ability to simply weather the upset, not to maintain normal, stable operation. The maximum relief pressure that would develop in any of the headers represents the basis for sizing relief valves. The loss of boiler feed water or condensate return, or both, could result in a major upset, or even a shutdown.Header pressure control during upsetsAt the steady-state conditions associated with the multiplicity of balances, boiler capacity can be adjusted to meet user demands. However, boiler load cannot be changed quickly to accommodate a sharp upset. Response rate is typically limited to 20% of capacity per minute. Therefore, other elements must be relied on to control header pressures during transient conditions.The roles of several such elements in controlling pressures in the three main headers during transient conditions are listed in Table l-3. A control system having these elements will result in a steam system capable of dealing with the transient conditions experienced in moving from one balance point to another.Tracking steam balancesBecause of schedule constraints, steam balances and boiler size are normally established early in the design stage. These determinations are based on assumptions regarding turbine efficiencies, process steam generated in waste-heat furnaces, and other quantities of steam that depend on purchased equipment. Therefore, a sufficient number of steam balances should be tracked through the design period to ensure that the equipment purchased will satisfy the original design concept of the steam system.This tracking represents an excellent application for a utility data-base system and a system linear programming model. During the course of the mechanical design of a large "grass roots" complex, 40 steam balances were continuously updated for changes in steam loads via such an application.Cost tradeoffsTo design an efficient but least-expensive system, the designer ideally develops a total minimum-cost curve – which incorporates all the pertinent costs related to capital expenditures, installation, fuel, utilities, operations and maintenance-and performs a cost study of the final system. However, because the designer is under the constraint of keeping to a project schedule, major, highly expensive equipment must be ordered early in the project, when many key parts of the design puzzle are not available (e.g., a complete load summary, turbine water rates, equipment efficiencies and utility costs).A practical alternative is to rely on comparative-cost estimates, as are conventionally used in assisting with engineering decision points. This approach is particularly useful in making early equipment selections when fine-tuning is not likely to alter decisions, such as regarding the number of boilers required, whether boilers should be shop-fabricated or field-erected, and the practicality of generating steam from waste heat or via cogeneration.The significant elements of a steam-system cost-comparative study are costs for: equipment and installation; ancillaries (i.e., miscellaneous items required to support the equipment,such as additional stacks, upgraded combustion control, more extensive blowdown facilities, etc.); operation(annual); maintenance (annual); and utilities.The first two costs may be obtained from in-house data or from vendors. Operational and maintenance costs can be factored from the capital cost for equipment based on an assessment of the reliability of the purchased equipment.Utility costs are generally the most difficult to establish at an early stage because sources frequently depend on the site of the plant. Some examples of such costs are: purchased fuel gas - $5.35/million Btu, raw water - $0.60/1,000 gal, electricity - $0.07{kWh, and demineralized boiler feedwater -$1.50/1,000 gal. The value of steam at the various pressureLevels can be developed [5J.Let it be further assumed that the emergency balance requires 2,200,000 lb/h of steam (all boilers available). Listed in Table 1 4 are some combinations of boiler installations that meet the design conditions previously stipulated.Table l-4 indicates that any of the several combinations of power-boiler number and size could meet both normal and emergency demand. Therefore, a comparative-cost analysis would be made to assist in making an early decision regarding the number and size of the power boilers.(Table l-4 is based on field-erected, industrial-type boiler Conventional sizing of this type of boiler might range from 100,000 lb/h through 2,000,000 lb/h for each.)An alternative would be the packaged boiler option (although it does not seem practical at this load level. Because it is shop-fabricated, this type of boiler affords a significant saving in terms of field installation cost. Such boilers are available up to a nominal capacity of 100,000 lb/h, with some versions up t0 250,000 lb7h.Selecting turbine water rate i.e., efficiency) represents another major cost concern. Beyond the recognized payout period (e.g., 3 years), the cost of drive steam can be significant in comparison with the equipment capital cost. The typical 30% efficiency ofthe medium-pressure backpressure turbine can be boosted significantly.Driver selections are frequently made with the help of cost-tradeoff studies, unless overriding considerations preclude a drive medium. Electric pump drives are typically recommended on the basis of such studies.Steam tracing has long been the standard way of winterizing piping, not only because of its history of successful performance but also because it is an efficient way to use low-pressure steam.Design consideratonsAs the steam system evolves, the designer identifies steam loads and pressure levels, locates steam loads, checks safety aspects, and prepares cost-tradeoff studies, in order to provide low-cost energy safely, always remaining aware of the physical entity that will arise from the design.How are design concepts translated into a design document? And what basic guidelines will ensure that the physical plant will represent what was intended conceptually?Basic to achieving these ends is the piping and instrument diagram (familiar as the P&ID). Although it is drawn up primarily for the piping designers benefit, it also plays a major role in communicating to the instrumentation designer the process-control strategy, as well as in conveying specialty information to electrical, civil, structural, mechanical and architectural engineers. It is the most important document for representing the specification of the steam。
毕业设计中英文翻译
Integrated circuitAn integrated circuit or monolithic integrated circuit (also referred to as IC, chip, or microchip) is an electronic circuit manufactured by the patterned diffusion of trace elements into the surface of a thin substrate of semiconductor material. Additional materials are deposited and patterned to form interconnections between semiconductor devices.Integrated circuits are used in virtually all electronic equipment today and have revolutionized the world of electronics. Computers, mobile phones, and other digital appliances are now inextricable parts of the structure of modern societies, made possible by the low cost of production of integrated circuits.IntroductionICs were made possible by experimental discoveries showing that semiconductor devices could perform the functions of vacuum tubes and by mid-20th-century technology advancements in semiconductor device fabrication. The integration of large numbers of tiny transistors into a small chip was an enormous improvement over the manual assembly of circuits using discrete electronic components. The integrated circuit's mass production capability, reliability, and building-block approach tocircuit design ensured the rapid adoption of standardized ICs in place of designs using discrete transistors.There are two main advantages of ICs over discrete circuits: cost and performance. Cost is low because the chips, with all their components, are printed as a unit by photolithography rather than being constructed one transistor at a time. Furthermore, much less material is used to construct a packaged IC than to construct a discrete circuit. Performance is high because the components switch quickly and consume little power (compared to their discrete counterparts) as a result of the small size and close proximity of the components. As of 2006, typical chip areas range from a few square millimeters to around 350 mm2, with up to 1 million transistors per mm2.TerminologyIntegrated circuit originally referred to a miniaturized electronic circuit consisting of semiconductor devices, as well as passive components bonded to a substrate or circuit board.[1] This configuration is now commonly referred to as a hybrid integrated circuit. Integrated circuit has since come to refer to the single-piece circuit construction originally known as a monolithic integrated circuit.[2]InventionEarly developments of the integrated circuit go back to 1949, when the German engineer Werner Jacobi (Siemens AG) filed a patent for an integrated-circuit-like semiconductor amplifying device showing five transistors on a common substrate arranged in a 2-stage amplifier arrangement. Jacobi disclosed small and cheap hearing aids as typical industrial applications of his patent. A commercial use of his patent has not been reported.The idea of the integrated circuit was conceived by a radar scientist working for the Royal Radar Establishment of the British Ministry of Defence, Geoffrey W.A. Dummer (1909–2002). Dummer presented the idea to the public at the Symposium on Progress in Quality Electronic Components in Washington, D.C. on May 7, 1952.[4] He gave many sympodia publicly to propagate his ideas, and unsuccessfully attempted to build such a circuit in 1956.A precursor idea to the IC was to create small ceramic squares (wafers), each one containing a single miniaturized component. Components could then be integrated and wired into a tridimensional or tridimensional compact grid. This idea, which looked very promising in 1957, was proposed to the US Army by Jack Kilby, and led to the short-lived Micro module Program. However, as the project was gaining momentum, Jack Kilby came up with a new, revolutionary design: the IC.Newly employed by Texas Instruments, Jack Kilby recorded his initial ideas concerning the integrated circuit in July 1958, successfully demonstrating the first working integrated example on September 12, 1958.In his patent application of February 6, 1959, Jack Kilby described his new device as ―a body of semiconductor material ... wherein all the components of the electronic circuit are completely integrated.‖Jack Kilby won the 2000 Nobel Prize in Physics for his part of the invention of the integrated circuit.Jack Kilby's work was named an IEEE Milestone in 2009.Noyce also came up with his own idea of an integrated circuit half a year later than Jack Kilby. His chip solved many practical problems that Jack Kilby's had not. Produced at Fairchild Semiconductor, it was made of silicon, whereas Jack Kilby chip was made of germanium. GenerationsIn the early days of integrated circuits, only a few transistors could be placed on a chip, as the scale used was large because of the contemporary technology, and manufacturing yields were low by today's standards. As the degree of integration was small, the design was done easily. Over time, millions, and today billions of transistors could be placed on one chip, and to make a good design became a task to be planned thoroughly. This gave rise to new design methods.SSI, MSI and LSIThe first integrated circuits contained only a few transistors. Called "small-scale integration" (SSI), digital circuits containing transistors numbering in the tens for example, while early linear ICs such as the Plessey SL201 or the Philips TAA320 had as few as two transistors. The term Large Scale Integration was first used by IBM scientist Rolf Landauer when describing the theoretical concept, from there came the terms for SSI, MSI, VLSI, and ULSI.SSI circuits were crucial to early aerospace projects, and aerospace projects helped inspire development of the technology. Both the Minuteman missile and Apollo program needed lightweight digital computers for their inertial guidance systems; the Apollo guidance computer led and motivated the integrated-circuit technology,while the Minuteman missile forced it into mass-production. The Minuteman missile program and various other Navy programs accounted for the total $4 million integrated circuit market in 1962, and by 1968, U.S. Government space and defense spending still accounted for 37% of the $312 million total production. The demand by the U.S. Government supported the nascent integrated circuit market until costs fell enough to allow firms to penetrate the industrial and eventually the consumer markets. The average price per integrated circuit dropped from $50.00 in1962 to $2.33 in 1968.[13] Integrated circuits began to appear in consumer products by the turn of the decade, a typical application being FMinter-carrier sound processing in television receivers.The next step in the development of integrated circuits, taken in the late 1960s, introduced devices which contained hundreds of transistors on each chip, called "medium-scale integration" (MSI).They were attractive economically because while they cost little more to produce than SSI devices, they allowed more complex systems to be produced using smaller circuit boards, less assembly work (because of fewer separate components), and a number of other advantages.Further development, driven by the same economic factors, led to "large-scale integration" (LSI) in the mid 1970s, with tens of thousands of transistors per chip.Integrated circuits such as 1K-bit RAMs, calculator chips, and the first microprocessors, that began to be manufactured in moderate quantities in the early 1970s, had under 4000 transistors. True LSI circuits, approaching 10,000 transistors, began to be produced around 1974, for computer main memories and second-generation microprocessors.VLSIThe final step in the development process, starting in the 1980s and continuing through the present, was "very large-scale integration" (VLSI). The development started with hundreds of thousands of transistors in the early 1980s, and continues beyond several billion transistors as of 2009. Multiple developments were required to achieve this increased density. Manufacturers moved to smaller design rules and cleaner fabrication facilities, so that they could make chips with more transistors and maintain adequate yield. The path of process improvements was summarized by the International Technology Roadmap for Semiconductors (ITRS). Design tools improved enough to make it practical to finish these designs in a reasonable time. The more energy efficient CMOS replaced NMOS and PMOS, avoiding a prohibitive increase in power consumption. Better texts such as the landmark textbook by Mead and Conway helped schools educate more designers, among other factors.In 1986 the first one megabit RAM chips were introduced, which contained more than one million transistors. Microprocessor chips passed the million transistor mark in 1989 and the billion transistor mark in 2005.[14] The trend continues largely unabated, with chips introduced in 2007 containing tens of billions of memory transistors.[15]ULSI, WSI, SOC and 3D-ICTo reflect further growth of the complexity, the term ULSI that stands for "ultra-large-scale integration" was proposed for chips of complexityof more than 1 million transistors.Wafer-scale integration (WSI) is a system of building very-large integrated circuits that uses an entire silicon wafer to produce a single "super-chip". Through a combination of large size and reduced packaging, WSI could lead to dramatically reduced costs for some systems, notably massively parallel supercomputers. The name is taken from the term Very-Large-Scale Integration, the current state of the art when WSI was being developed.A system-on-a-chip (SoC or SOC) is an integrated circuit in which all the components needed for a computer or other system are included on a single chip. The design of such a device can be complex and costly, and building disparate components on a single piece of silicon may compromise the efficiency of some elements. However, these drawbacks are offset by lower manufacturing and assembly costs and by a greatly reduced power budget: because signals among the components are kept on-die, much less power is required (see Packaging).A three-dimensional integrated circuit (3D-IC) has two or more layers of active electronic components that are integrated both vertically and horizontally into a single circuit. Communication between layers useson-die signaling, so power consumption is much lower than in equivalent separate circuits. Judicious use of short vertical wires can substantially reduce overall wire length for faster operation.Advances in integrated circuitsAmong the most advanced integrated circuits are the microprocessors or "cores", which control everything from computers and cellular phones to digital microwave ovens. Digital memory chips and ASICs are examples of other families of integrated circuits that are important to the modern information society. While the cost of designing and developing a complex integrated circuit is quite high, when spread across typically millions of production units the individual IC cost is minimized. The performance of ICs is high because the small size allows short traces which in turn allows low power logic (such as CMOS) to be used at fast switching speeds.ICs have consistently migrated to smaller feature sizes over the years, allowing more circuitry to be packed on each chip. This increased capacity per unit area can be used to decrease cost and/or increase functionality—see Moore's law which, in its modern interpretation, states that the number of transistors in an integrated circuit doubles every two years. In general, as the feature size shrinks, almost everything improves—the cost per unit and the switching power consumption godown, and the speed goes up. However, ICs with nanometer-scale devices are not without their problems, principal among which is leakage current (see subthreshold leakage for a discussion of this), although these problems are not insurmountable and will likely be solved or at least ameliorated by the introduction of high-k dielectrics. Since these speed and power consumption gains are apparent to the end user, there is fierce competition among the manufacturers to use finer geometries. This process, and the expected progress over the next few years, is well described by the International Technology Roadmap for Semiconductors (ITRS).In current research projects, integrated circuits are also developed for sensoric applications in medical implants or other bioelectronic devices. Particular sealing strategies have to be taken in such biogenic environments to avoid corrosion or biodegradation of the exposed semiconductor materials.[16] As one of the few materials well established in CMOS technology, titanium nitride (TiN) turned out as exceptionally stable and well suited for electrode applications in medical implants.[17][18] ClassificationIntegrated circuits can be classified into analog, digital and mixed signal (both analog and digital on the same chip).Digital integrated circuits can contain anything from one to millions of logic gates, flip-flops, multiplexers, and other circuits in a few square millimeters. The small size of these circuits allows high speed, low power dissipation, and reduced manufacturing cost compared with board-level integration. These digital ICs, typically microprocessors, DSPs, and micro controllers, work using binary mathematics to process "one" and "zero" signals.Analog ICs, such as sensors, power management circuits, and operational amplifiers, work by processing continuous signals. They perform functions like amplification, active filtering, demodulation, and mixing. Analog ICs ease the burden on circuit designers by having expertly designed analog circuits available instead of designing a difficult analog circuit from scratch.ICs can also combine analog and digital circuits on a single chip to create functions such as A/D converters and D/A converters. Such circuits offer smaller size and lower cost, but must carefully account for signal interference.ManufacturingFabricationRendering of a small standard cell with three metal layers (dielectric has been removed). The sand-colored structures are metal interconnect, with the vertical pillars being contacts, typically plugs of tungsten. The reddish structures are poly-silicon gates, and the solid at the bottom is the crystalline silicon bulk.Schematic structure of a CMOS chip, as built in the early 2000s. The graphic shows LDD-Misfit's on an SOI substrate with five materialization layers and solder bump for flip-chip bonding. It also shows the section for FEOL (front-end of line), BEOL (back-end of line) and first parts of back-end process.The semiconductors of the periodic table of the chemical elements were identified as the most likely materials for a solid-state vacuum tube. Starting with copper oxide, proceeding to germanium, then silicon, the materials were systematically studied in the 1940s and 1950s. Today, silicon monocrystals are the main substrate used for ICs although someIII-V compounds of the periodic table such as gallium arsenide are used for specialized applications like LEDs, lasers, solar cells and the highest-speed integrated circuits. It took decades to perfect methods of creating crystals without defects in the crystalline structure of the semiconducting material.Semiconductor ICs are fabricated in a layer process which includes these key process steps:∙Imaging∙Deposition∙EtchingThe main process steps are supplemented by doping and cleaning.∙Integrated circuits are composed of many overlapping layers, each defined by photolithography, and normally shown in different colors.Some layers mark where various dopants are diffused into thesubstrate (called diffusion layers), some define where additional ions are implanted (implant layers), some define the conductors(poly-silicon or metal layers), and some define the connectionsbetween the conducting layers (via or contact layers). All components are constructed from a specific combination of these layers.∙In a self-aligned CMOS process, a transistor is formed wherever the gate layer (poly-silicon or metal) crosses a diffusion layer.∙Capacitive structures, in form very much like the parallel conducting plates of a traditional electrical capacitor, are formedaccording to the area of the "plates", with insulating material between the plates. Capacitors of a wide range of sizes are common on ICs.∙Meandering stripes of varying lengths are sometimes used to form on-chip resistors, though most logic circuits do not need any resistors.The ratio of the length of the resistive structure to its width, combined with its sheet resistivity, determines the resistance.∙More rarely, inductive structures can be built as tiny on-chip coils, or simulated by gyrators.Since a CMOS device only draws current on the transition between logic states, CMOS devices consume much less current than bipolar devices.A random access memory is the most regular type of integrated circuit; the highest density devices are thus memories; but even a microprocessor will have memory on the chip. (See the regular array structure at the bottom of the first image.) Although the structures are intricate – with widths which have been shrinking for decades – the layers remain much thinner than the device widths. The layers of material are fabricated much like a photographic process, although light waves in the visible spectrum cannot be used to "expose" a layer of material, as they would be too large for the features. Thus photons of higher frequencies (typically ultraviolet) are used to create the patterns for each layer. Because each feature is so small, electron microscopes are essential tools for a process engineer who might be debugging a fabrication process.Each device is tested before packaging using automated test equipment (ATE), in a process known as wafer testing, or wafer probing. The wafer is then cut into rectangular blocks, each of which is called a die. Each good die (plural dice, dies, or die) is then connected into a package using aluminum (or gold) bond wires which are welded and/or thermosonic bonded to pads, usually found around the edge of the die. After packaging, the devices go through final testing on the same or similar ATE used during wafer probing. Industrial CT scanning can also be used. Test cost can account for over 25% of the cost of fabrication on lower cost products, but can be negligible on low yielding, larger, and/or higher cost devices.As of 2005, a fabrication facility (commonly known as a semiconductor fab) costs over $1 billion to construct,[19] because much of the operation is automated. Today, the most advanced processes employ the following techniques:∙The wafers are up to 300 mm in diameter (wider than a common dinner plate).∙Use of 32 nanometer or smaller chip manufacturing process. Intel, IBM, NEC, and AMD are using ~32 nanometers for their CPU chips.IBM and AMD introduced immersion lithography for their 45 nmprocesses[20]∙Copper interconnects where copper wiring replaces aluminium for interconnects.∙Low-K dielectric insulators.∙Silicon on insulator (SOI)∙Strained silicon in a process used by IBM known as strained silicon directly on insulator (SSDOI)∙Multigate devices such as trin-gate transistors being manufactured by Intel from 2011 in their 22 nim process.PackagingIn the late 1990s, plastic quad flat pack (PQFP) and thin small-outline package (TSOP) packages became the most common for high pin count devices, though PGA packages are still often used for high-end microprocessors. Intel and AMD are currently transitioning from PGA packages on high-end microprocessors to land grid array (LGA) packages.Ball grid array (BGA) packages have existed since the 1970s. Flip-chip Ball Grid Array packages, which allow for much higher pin count than other package types, were developed in the 1990s. In an FCBGA package the die is mounted upside-down (flipped) and connects to the packageballs via a package substrate that is similar to a printed-circuit board rather than by wires. FCBGA packages allow an array of input-output signals (called Area-I/O) to be distributed over the entire die rather than being confined to the die periphery.Traces out of the die, through the package, and into the printed circuit board have very different electrical properties, compared to on-chip signals. They require special design techniques and need much more electric power than signals confined to the chip itself.When multiple dies are put in one package, it is called SiP, for System In Package. When multiple dies are combined on a small substrate, often ceramic, it's called an MCM, or Multi-Chip Module. The boundary between a big MCM and a small printed circuit board is sometimes fuzzy. Chip labeling and manufacture dateMost integrated circuits large enough to include identifying information include four common sections: the manufacturer's name or logo, the part number, a part production batch number and/or serial number, and a four-digit code that identifies when the chip was manufactured. Extremely small surface mount technology parts often bear only a number used in a manufacturer's lookup table to find the chip characteristics.The manufacturing date is commonly represented as a two-digit year followed by a two-digit week code, such that a part bearing the code 8341 was manufactured in week 41 of 1983, or approximately in October 1983. Legal protection of semiconductor chip layoutsLike most of the other forms of intellectual property, IC layout designs are creations of the human mind. They are usually the result of an enormous investment, both in terms of the time of highly qualified experts, and financially. There is a continuing need for the creation of new layout-designs which reduce the dimensions of existing integrated circuits and simultaneously increase their functions. The smaller an integrated circuit, the less the material needed for its manufacture, and the smaller the space needed to accommodate it. Integrated circuits are utilized in a large range of products, including articles of everyday use, such as watches, television sets, washing machines, automobiles, etc., as well as sophisticated data processing equipment.The possibility of copying by photographing each layer of an integrated circuit and preparing photomasks for its production on the basis of the photographs obtained is the main reason for the introduction of legislation for the protection of layout-designs.A diplomatic conference was held at Washington, D.C., in 1989, which adopted a Treaty on Intellectual Property in Respect of Integrated Circuits (IPIC Treaty). The Treaty on Intellectual Property in respect of Integrated Circuits, also called Washington Treaty or IPIC Treaty (signed at Washington on May 26, 1989) is currently not in force, but was partially integrated into the TRIPs agreement.National laws protecting IC layout designs have been adopted in a number of countries.Other developmentsIn the 1980s, programmable logic devices were developed. These devices contain circuits whose logical function and connectivity can be programmed by the user, rather than being fixed by the integrated circuit manufacturer. This allows a single chip to be programmed to implement different LSI-type functions such as logic gates, adders and registers. Current devices called field-programmable gate arrays can now implement tens of thousands of LSI circuits in parallel and operate up to 1.5 GHz (Anachronism holding the speed record).The techniques perfected by the integrated circuits industry over the last three decades have been used to create very small mechanical devices driven by electricity using a technology known asmicroelectromechanical systems. These devices are used in a variety of commercial and military applications. Example commercial applications include DLP projectors, inkjet printers, and accelerometers used to deploy automobile airbags.In the past, radios could not be fabricated in the same low-cost processes as microprocessors. But since 1998, a large number of radio chips have been developed using CMOS processes. Examples include Intel's DECT cordless phone, or Atheros's 802.11 card.Future developments seem to follow the multi-coremulti-microprocessor paradigm, already used by the Intel and AMD dual-core processors. Intel recently unveiled a prototype, "not for commercial sale" chip that bears 80 microprocessors. Each core is capable of handling its own task independently of the others. This is in response to the heat-versus-speed limit that is about to be reached using existing transistor technology. This design provides a new challenge to chip programming. Parallel programming languages such as theopen-source X10 programming language are designed to assist with this task.集成电路集成电路或单片集成电子电路(也称为IC、集成电路片或微型集成电路片)是一种电子电路制作的图案扩散微量元素分析在基体表面形成一层薄的半导体材料。
毕业设计中英文翻译

Bridge Waterway OpeningsIn a majority of cases the height and length of a bridge depend solely upon the amount of clear waterway opening that must be provided to accommodate the floodwaters of the stream. Actually, the problem goes beyond that of merely accommodating the floodwaters and requires prediction of the various magnitudes of floods for given time intervals. It would be impossible to state that some given magnitude is the maximum that will ever occur, and it is therefore impossible to design for the maximum, since it cannot be ascertained. It seems more logical to design for a predicted flood of some selected interval ---a flood magnitude that could reasonably be expected to occur once within a given number of years. For example, a bridge may be designed for a 50-year flood interval; that is, for a flood which is expected (according to the laws of probability) to occur on the average of one time in 50 years. Once this design flood frequency, or interval of expected occurrence, has been decided, the analysis to determine a magnitude is made. Whenever possible, this analysis is based upon gauged stream records. In areas and for streams where flood frequency and magnitude records are not available, an analysis can still be made. With data from gauged streams in the vicinity, regional flood frequencies can be worked out; with a correlation between the computed discharge for the ungauged stream and the regional flood frequency, a flood frequency curve can be computed for the stream in question. Highway CulvertsAny closed conduit used to conduct surface runoff from one side of a roadway to the other is referred to as a culvert. Culverts vary in size from large multiple installations used in lieu of a bridge to small circular or elliptical pipe, and their design varies in significance. Accepted practice treats conduits under the roadway as culverts. Although the unit cost of culverts is much less than that of bridges, they are far more numerous, normally averaging about eight to the mile, and represent a greater cost in highway. Statistics show that about 15 cents of the highway construction dollar goes to culverts, as compared with 10 cents for bridge. Culvert design then is equally as important as that of bridges or other phases of highway and should be treated accordingly.Municipal Storm DrainageIn urban and suburban areas, runoff waters are handled through a system of drainage structures referred to as storm sewers and their appurtenances. The drainage problem is increased in these areas primarily for two reasons: the impervious nature of the area creates a very high runoff; and there is little room for natural water courses. It is often necessary to collect the entire storm water into a system of pipes and transmit it over considerable distances before it can be loosed again as surface runoff. This collection and transmission further increase the problem, since all of the water must be collected with virtually no ponding, thus eliminating any natural storage; and though increased velocity the peak runoffs are reached more quickly. Also, the shorter times of peaks cause the system to be more sensitive to short-duration, high-intensity rainfall. Storm sewers, like culverts and bridges, are designed for storms of various intensity –return-period relationship, depending upon the economy and amount of ponding that can be tolerated.Airport DrainageThe problem of providing proper drainage facilities for airports is similar in many ways to that of highways and streets. However, because of the large and relatively flat surface involved the varying soil conditions, the absence of natural water courses and possible side ditches, and the greater concentration of discharge at the terminus of the construction area, some phases of the problem are more complex. For the average airport the overall area to be drained is relatively large and an extensive drainage system is required. The magnitude of such a system makes it even more imperative that sound engineeringprinciples based on all of the best available data be used to ensure the most economical design. Overdesign of facilities results in excessive money investment with no return, and underdesign can result in conditions hazardous to the air traffic using the airport.In other to ensure surfaces that are smooth, firm, stable, and reasonably free from flooding, it is necessary to provide a system which will do several things. It must collect and remove the surface water from the airport surface; intercept and remove surface water flowing toward the airport from adjacent areas; collect and remove any excessive subsurface water beneath the surface of the airport facilities and in many cases lower the ground-water table; and provide protection against erosion of the sloping areas. Ditches and Cut-slope DrainageA highway cross section normally includes one and often two ditches paralleling the roadway. Generally referred to as side ditches these serve to intercept the drainage from slopes and to conduct it to where it can be carried under the roadway or away from the highway section, depending upon the natural drainage. To a limited extent they also serve to conduct subsurface drainage from beneath the roadway to points where it can be carried away from the highway section.A second type of ditch, generally referred to as a crown ditch, is often used for the erosion protection of cut slopes. This ditch along the top of the cut slope serves to intercept surface runoff from the slopes above and conduct it to natural water courses on milder slopes, thus preventing the erosion that would be caused by permitting the runoff to spill down the cut faces.12 Construction techniquesThe decision of how a bridge should be built depends mainly on local conditions. These include cost of materials, available equipment, allowable construction time and environmental restriction. Since all these vary with location and time, the best construction technique for a given structure may also vary. Incremental launching or Push-out MethodIn this form of construction the deck is pushed across the span with hydraulic rams or winches. Decks of prestressed post-tensioned precast segments, steel or girders have been erected. Usually spans are limited to 50~60 m to avoid excessive deflection and cantilever stresses , although greater distances have been bridged by installing temporary support towers . Typically the method is most appropriate for long, multi-span bridges in the range 300 ~ 600 m ,but ,much shorter and longer bridges have been constructed . Unfortunately, this very economical mode of construction can only be applied when both the horizontal and vertical alignments of the deck are perfectly straight, or alternatively of constant radius. Where pushing involves a small downward grade (4% ~ 5%) then a braking system should be installed to prevent the deck slipping away uncontrolled and heavy bracing is then needed at the restraining piers.Bridge launching demands very careful surveying and setting out with continuous and precise checks made of deck deflections. A light aluminum or steel-launching nose forms the head of the deck to provide guidance over the pier. Special teflon or chrome-nickel steel plate bearings are used to reduce sliding friction to about 5% of the weight, thus slender piers would normally be supplemented with braced columns to avoid cracking and other damage. These columns would generally also support the temporary friction bearings and help steer the nose.In the case of precast construction, ideally segments should be cast on beds near the abutments and transferred by rail to the post-tensioning bed, the actual transport distance obviously being kept to the minimum. Usually a segment is cast against the face of the previously concerted unit to ensure a good fit when finally glued in place with an epoxy resin. If this procedure is not adopted , gaps of approximately 500mm shold be left between segments with the reinforcements running through andstressed together to form a complete unit , but when access or space on the embankment is at a premium it may be necessary to launch the deck intermittently to allow sections to be added progressively .The correponding prestressing arrangements , both for the temporary and permanent conditions would be more complicated and careful calculations needed at all positions .The pricipal advantage of the bridge-launching technique is the saving in falsework, especially for high decks. Segments can also be fabricated or precast in a protected environment using highly productive equipment. For concrete segment, typically two segment are laid each week (usually 10 ~ 30 m in length and perhaps 300 to 400 tonnes in weight) and after posttensioning incrementally launched at about 20 m per day depending upon the winching/jacking equipment.Balanced Cantiulever ConstructionDevelopment in box section and prestressed concrete led to short segment being assembled or cast in place on falsework to form a beam of full roadway width. Subsequently the method was refined virtually to eliminate the falsework by using a previously constructed section of the beam to provide the fixing for a subsequently cantilevered section. The principle is demonsrated step-by-step in the example shown in Fig.1.In the simple case illustrated, the bridge consists of three spans in the ratio 1:1:2. First the abutments and piers are constructed independently from the bridge superstructure. The segment immediately above each pier is then either cast in situ or placed as a precast unit .The deck is subsequently formed by adding sections symmetrically either side.Ideally sections either side should be placed simultaneously but this is usually impracticable and some inbalance will result from the extra segment weight, wind forces, construction plant and material. When the cantilever has reached both the abutment and centre span,work can begin from the other pier , and the remainder of the deck completed in a similar manner . Finally the two individual cantilevers are linked at the centre by a key segment to form a single span. The key is normally cast in situ.The procedure initially requires the first sections above the column and perhaps one or two each side to be erected conventionally either in situ concrete or precast and temporarily supported while steel tendons are threaded and post-tensioned . Subsequent pairs of section are added and held in place by post-tensioning followed by grouting of the ducts. During this phase only the cantilever tendons in the upper flange and webs are tensioned. Continuity tendons are stressed after the key section has been cast in place. The final gap left between the two half spans should be wide enough to enable the jacking equipment to be inserted. When the individual cantilevers are completed and the key section inserted the continuity tendons are anchored symmetrically about the centre of the span and serve to resist superimposed loads, live loads, redistribution of dead loads and cantilever prestressing forces.The earlier bridges were designed on the free cantilever principle with an expansion joint incorporated at the center .Unfortunately,settlements , deformations , concrete creep and prestress relaxation tended to produce deflection in each half span , disfiguring the general appearance of the bridge and causing discomfort to drivers .These effects coupled with the difficulties in designing a suitable joint led designers to choose a continuous connection, resulting in a more uniform distribution of the loads and reduced deflection. The natural movements were provided for at the bridge abutments using sliding bearings or in the case of long multi-span bridges, joints at about 500 m centres.Special Requirements in Advanced Construction TechniquesThere are three important areas that the engineering and construction team has to consider:(1) Stress analysis during construction: Because the loadings and support conditions of the bridge are different from the finished bridge, stresses in each construction stage must be calculated to ensurethe safety of the structure .For this purpose, realistic construction loads must be used and site personnel must be informed on all the loading limitations. Wind and temperature are usually significant for construction stage.(2) Camber: In order to obtain a bridge with the right elevation, the required camber of the bridge at each construction stage must be calculated. It is required that due consideration be given to creep and shrinkage of the concrete. This kind of the concrete. This kind of calculation, although cumbersome, has been simplified by the use of the compiters.(3) Quality control: This is important for any method construction, but it is more so for the complicated construction techniques. Curing of concrete, post-tensioning, joint preparation, etc. are detrimental to a successful structure. The site personnel must be made aware of the minimum concrete strengths required for post-tensioning, form removal, falsework removal, launching and other steps of operations.Generally speaking, these advanced construction techniques require more engineering work than the conventional falsework type construction, but the saving could be significant.大桥涵洞在大多数情况中桥梁的高度和跨度完全取决于河流的流量,桥梁的高度和跨度必须能够容纳最大洪水量.事实上,这不仅仅是洪水最大流量的问题,还需要在不同时间间隔预测不同程度的水灾。
(完整版)_毕业设计英文翻译_及格式
毕业设计(论文)英文翻译题目专业班级姓名学号指导教师职称200年月日The Restructuring of OrganizationsThroughout the 1990s, mergers and acquisitions a major source of corporate restructuring, affecting millions of workers and their families. This form of restructuring often is accompanied by downsizing. Downsizing is the process of reducing the size of a firm by laying off or retiring workers early. The primary objectives of downsizing are similar in U.S. companies and those in other countries:●cutting cost,●spurring decentralization and speeding up decision making,●cutting bureaucracy and eliminating layers of especially they did five years ago. One consequence of this trend is that today’s managers supervise larger numbers of subordinates who report directly to them. In 1990, only about 20 percent of managers supervise twelve or more people and 54 percent supervised six or fewer.Because of downsizing, first-line managers quality control, resources, and industrial engineering provide guidance and support. First-line managers participate in the production processes and other line activities and coordinate the efforts of the specialists as part of their jobs. At the same time, the workers that first-line managers supervise are less willing to put up with authoritarian management. Employees want their jobs to be more creative, challenging, fun, and satisfying and want to participate in decisions affecting their work. Thus self-managed work teams that bring workers and first-line managers together to make joint decisions to improve the way they do their jobs offer a solution to both supervision and employee expectation problems. When you ’t always the case. Sometimes entire divisions of a firm are simply spun off from the main company to operate on their own as new, autonomous companies. The firm that spun them off may then become one of their most important customers or suppliers. That AT&T “downsized” the old Bell Labs unit, which is now known as Lucent Technologies. Now, rather than - return is free to enter into contracts with companies other than AT&T. this method of downsizing is usually called outsourcing.Outsourcing means letting other organizations perform a needed service andor manufacture needed parts or products. Nike outsources the production of its shoes to low-cost plants in South Korea and China and imports the shoes for distribution in North America. These same plants also ship shoes to Europe and other parts of Asia for distribution. Thus today’s managers face a new challenge: t o plan, organize, lead, and control a company that may as a modular corporation. The modularcorporation is most is most common in three industries: apparel, auto manufacturing, and electronics. The most commonly out-sourced function is production. By out sourcing production, a company can switch supplier best suited to a customer’s needs.Decisions about what to outsource and what to keep in- to contract production to another company is a sound business decision to contract production to another company is a sound business decision, at least for U.S. manufacturers. It appears to the unit cost of production by relieving the company of some overhead, and it frees the company to allocate scarce resources to activities for which the company examples of modular companies are Dell Computer, Nike, Liz Claiborne fashions, and ship designer Cyrix.As organizations downsize and outsource functions, they become flatter and smaller. Unlike the behemoths of the past, the new, smaller firms are less like autonomous fortresses and more like nodes in a net work of complex relationships. This approach, called the network form of organization, involves establishing strategic alliances among several entities.In Japan, cross-ownership and alliances among firms-called keiretsu-both foreign and U.S. auto parts producers. It also owns 49 percent of Hertz, the car rental company that is also a major customer. Other alliances include involvement in several research consortia. In the airline industry, a common type of alliance is between an airline and an airframe manufacture. For example, Delta recently agreed to buy all its aircraft from Boeing. Boeing Airlines. Through these agreements, Boeing guarantees that it will be able to sell specified models of its aircraft and begin to adapt their operations to the models they will be flying in the future. Thus both sides expect to reap benefits from these arrangements for many years.Networks forms of organizations are prevalent in access to the universities and in small, creative organizations. For example, the U.S. biotechnology industry is characterized by network of relationships between new biotechnology firms dedicated to research and new products development and established firms in industries that can use these new products, such as pharmaceuticals. In return for sharing technical information with the larger firms, the smaller firms gain access to their partners’ resources for product testing, marketing, and distribution. Big pharmaceutical firms such as Merk or Eli Lily gain from such partnerships because the smaller firms typically development cycle in the larger firms.Being competitive increasingly requires establishing and managing strategic alliances with other firms. In a strategic alliance, two or more firms agree to cooperate in a venture that is expected to benefit both firms.企业重组整个20世纪90年代中,合并和收购一直是企业重组的主要起源,影响着千百万的工人和他们的家庭。
毕业设计英文翻译》【范本模板】
外文文献翻译(译成中文1000字左右):【主要阅读文献不少于5篇,译文后附注文献信息,包括:作者、书名(或论文题目)、出版社(或刊物名称)、出版时间(或刊号)、页码。
提供所译外文资料附件(印刷类含封面、封底、目录、翻译部分的复印件等,网站类的请附网址及原文】太阳能—地源热泵的热源性能Y。
Bi1,2,L. Chen1*and C. Wu3本论文研究了中国天津冬季里的太阳能—地源热泵的太阳能与地源性能。
结果被用于设计和分析的太阳能集热器和地面热交换器。
太阳能-地源热泵在这个地区的使用可行性是成立的. 关键词:太阳能,地源热泵,可行性。
介绍地源热泵(GSHP)利用地下相对稳定的温度作为热源或水槽提供热源或调节空气。
GSHP 系统寻求利用常规空气—空气热泵系统的两方面可用的功能。
首先,地下环境温度缓慢地变化,归结于其高的热质量,导致了相对稳定的源或者散热器的温度而不受较大的极限。
其次,被地面吸收的太阳能在整个冬季可以热源。
自从地源热泵的观念在二十世纪四十年代被发展,大量的理论和实验工作都完成了,实验研究审查了具体的地源热泵系统和现场数据。
理论研究已经集中于用数值方法模拟地下盘管换热器以及研究参数对系统性能的影响。
太阳能—地源热泵(SGSHP)采用太阳能集热器和大地作为热源开始发展于1982年。
热泵实验系统用垂直双螺旋线圈(VSDC)地下换热器(GHX)为太阳能—地源热泵(SGSHP)利用低品位能源,这种方法已经被作者们所创造。
(图1)蒸汽压缩热泵的加热负荷和性能系数(COP)取决于蒸发温度和热源温度。
SGSHP采用太阳能集热器和大地作为热源,因此,其应用主要是依靠太阳能和土壤源性能。
在本论文中,中国天津的气象数据被用来分析SGSHP在该区域的应用可行性。
太阳能源分析天津的太阳能在中国处于中等水平。
1966—1976年期间天津的太阳能辐射月平均变化如图2所示。
结果表明,该太阳能集热器在夏天可以直接用于提供热水。
毕业设计英文翻译原文
英文原文1. General description of the SIEMAG disc brake unitThis brake unit is the electro-hydraulic control system of a gearless disc brake for winders. The brake unit operates on the exhaust principle, i.e. the braking force is generated by sets of disc springs and released by hydraulic pressure.The braking force generators with the brake shoes directly act axially on the brake disc. The braking force is generated by sets of disc springs and transmitted onto the brake shoes. The number of brake elements determines the respective braking force required.As soon as the brakes are being released, the brake shoes are lifted form the brake disc with the aid of pressure oil. During the braking, the oil flows back into the tank and the brake shoes are being pressed against the brake disc.The braking force generators type BSFG 408 are s series product supplied by the Swedish firm ASEA-Hagglunds. They have a maximum press-down force of2X7906 kN.For reasons of better system availability, the hydraulic pressure is generated by two regulating pumps that are each driven by an electric motor. Both pumps are started when the system is being switched on. Any failure of a pump will be signaled.The oil filtration is undertaken by a pressure filter‘6.2’provided in front of the braking force generators. Furthermore, two gear pumps that are directly coupled with the regulating pumps, maintain a permanent oil cooling and filtering circuit during system operation (filter‘6.1’and cooler ‘14’). Both filters have an electrical contamination control. The mesh size of the filters is specified by the supplier to be 10μm (see TAS No.3.9.6.4). The equipment includes a controlled electrical tank heating. The fluid level in the tank is monitored as well.The service braking is done with the aid of two electrically controlled proportional pressure relief valves‘43.1’and‘43.2’that are hydraulically connected in series.The safety braking is done with the aid of position-controlled 4/2-way electro valves‘53.1’、‘53.2’、‘39.1’、‘39.2’、‘58.1’、‘58.2’、‘66.1’,and‘66.2’which are electrically actuated in closed-circuit connection.In the event of a safety braking, the directional control valves‘39.1’and‘39.2’are switched off, separating thus the pump pressure from the remaining brake releasing system(hydraulic shunt).During the safety braking, the directional control valves‘6.1’and‘66.2’are acting as pilot valves for the 2/2-way valves‘65.1’and ‘65.2’which again release the pressure relief valves‘64.1’and‘64.2’.The electro valves‘53.1’and‘53.2’operate as outlet valves according to TAS No.3.9.5.9.The mechanically controlled pressure relief valves‘60.1’and‘60.2’are arranged in the outlet line of these valves. They determine the residual pressures in the course of safety braking. These residual pressures (pressure stages 1 and 2) are maintained by bladder-type accumulators.The gas pressure of the respective accumulator used is monitored.The march of pressure is adjusted with the aid of mechanical skids which are adapted to the braking process desired.A hand-operated pump‘48’is provided for assembly purposes, when the controlled main stop cocks‘46.1’and‘46.2’in the outlet line of the brake elements are locked.The position-controlled 4/2-way valves‘63’and the pressure relief valves ‘25.1’and‘25.2’(residual pressure accumulator) are fed by a back-up power supply in open-circuit connection. The valves get open when the solenoids are energized.With the command‘RELEASE BRAKE’,the two residual pressure accumulators are filled through the check valves‘87.1’and‘87.2’.The residual pressure accumulator‘24.1’(pressure stage 1) is connected through the 4/2-way valve‘86’. The residual pressure accumulator‘24.2’(pressure stage 2) is automatically connected by a change-over of the 4/2-way valve‘86’, when the hoisting load changes accordingly.2. Functional description of the electro-hydraulic control system corresponding to the hydraulic drawing No.0905216/12.1 Method of operation of the brake unitThe braking force is the sum of pressing forces per brake shoe, reduced by the forces being generated by the oil pressure in the cylinders of the brake element.The force required for the service braking is achieved by controlling the oil pressure. Two pressure regulating valves‘43.1’and‘43.2’, each being fitted with separate control electronics and function control, are connected in series, permitting thus a stepless adjustment of the valves between a minimum and a maximum pressure. In the case of failure of one brake is applied when the spring forces press the brake shoes against the brake disc without counterpressure. The brake is released when the pressure oil in the cylinders of the brake elements reduces the spring forces to zero and the brake shoes are lifted the brake disc.The brake releasing pressure is generated through the pressure-controlled pumps‘1.1’and‘1.2’which are driven by electric motors‘3.1’and‘3.2’. The pressure regulating valves of the pumps are adjusted in such a way that, as soon as the brake releasing pressure has been reached, the pumps reduce the flow rate from the maximum value to the quantity required for maintaining the releasing the pressure. This means in other words that the pumps only deliver the quantity of oil that is demanded to replace any oil losses from leakage and to maintain the pressure adjusted on the pressure regulating valves‘43.1’and‘43.2’.When starting the safety braking, the circuit of the electro-hydraulic brake control system (including pump motors) is cut off. The 4/2-way valves ‘53.1’,‘53.2’,‘39.1’and‘39.2’are thus de-energized and the pump circuit is separated form the brake elements and the pressure accumulators‘24’. The service brake valves‘43.1’and‘43.2’remain energized through a back-up current supply. The residual pressure is as high as to ensure the winder retardation being below the rope slip limit.The hand-operated pump‘48’is only connected for the start-up operation and stored separately.2.2 Operating states2.2.1 Starting the systemThe winder is at standstill and the brake applied. The control voltage and the voltage for the pump motors‘3.1’and‘3.2’is available. The electrical monitoring system signals the system to be trouble-free and all preconditions for starting the pumps‘1.1’and‘1.2’fulfilled (please see also item 2.3.1), which means that the safety circuit is closed as well.The 4/2-way valves‘39.1’and‘39.2’are energized by starting the pump motors‘3.1’and‘3.2’,thus opening the cross section between pumps and brake elements. The safety brake valves ‘53.1’、‘53.2’、‘58.1’、‘58.2’、‘66.1’and‘66.2’close.The pumps‘1.1’and‘1.2’are now connected through the pressure regulating valves‘43.1’and‘43.2’with the brake elements. The coils of these valves are de-energized, i.e. the valves are open, permitting the oil to return without pressure form the pumps‘1.1’and‘1.2’through the pressure regulating valves into the tank.2.2.2 Releasing the service brakeWith the command‘RELEASE BRAKE’, the coils of the pressure regulating valves‘43.1’and‘43.2’are fed with the maximum valve of regulable current, and the valves retain the maximum releasing pressure adjusted. The pumps‘1.1’and‘1.2’thus feed the oil through the valves‘39.1’and‘39.2’to the brake element. The accumulators for the residual pressure‘24.1’and‘24.2’are also filled through the operating pumps. The brake elements are released as soon as the maximum releasing pressure has been reached. The pressure-controlled pumps then reduce the flow rate to the quantity required for compensating all oil loses form leakage. The releasing pressure is maintained by the pressure regulating valves‘43.1’and‘43.2’.The pressure switches‘34.1’/‘34.2’monitor the filling of the bladder-type accumulators for residual pressure‘24.1’/‘24.2’.With this operating state, the valves‘53.1’and‘53.2’are closed and the outlets of the hydraulic safety circuit thus locked.2.2.3 Service brakingDuring the service braking, the pressure regulating valves‘43.1’and‘43.2’are steplessly controlled. This reduces the releasing pressure in conformity with the position of the brake lever. The oil displaced form the brake elements as well as the excess oil form the pumps‘1.1’and‘1.2’flows back through the pressure regulating valves‘43.1’and‘43.2’into the tank.These proportional pressure regulating valves comprise a pilot control valve and a main valve. They are operated by parallel control of the pilot control valves with the main valves connected in series.This means in other words that both proportional pressure regulating valves are always active in the pilot control circuit. However, the main pressure regulating function is always fulfilled by that valve which is nearer to the pressure source. Only in the event of a failure this function is performed by the subsequent valve.The power supply to the control electronics of each regulating valve is additionally backed up by a battery ensuring, in the event of a total power failure or wire brakeage, that at least one regulating valve remains operative.The buffered voltage supplies are monitored for a failure of the buffering in the electrical and electronical circuits of the brake control system.2.2.4 Safety brakingAs soon as the safety circuit is actuated, the pump motors‘3.1’and‘3.2’and the entire electrical control system, except the control of the service brake regulating valves, are de-energized.The oil draining pressure is released through the pressure relief valves ‘64.1’and‘64.2’by de-energizing the solenoid valves‘66.1’and‘66.2’. The releasing pressure in the brake elementsand in the conduits is thus rapidly reduced to that value at which the brake shoes touch the brake discs without pressing force.The de-energized valves‘39.1’and‘39.2’(hydraulic shunt) isolate the pumps‘1.1’and‘1.2’form the brake elements and, at the same time, connect the brake elements with the residual pressure accumulator ‘24.1’and‘24.2’.The hydraulic pressure is further reduced the residual pressure lever through the directional control valves‘53.1’and‘53.2’, the throttling valves ‘56.1’and‘56.2’as well as the cam-controlled pressure relief valves‘60.1’and‘60.2’connected in parallel.The opening time of the above valves determines the threshold time, it can be adjusted through the throttling valves‘59.1’and‘59.2’in a range of 0.2 and 1.0 s. The minimum pressure valve of the open valves‘60.1’and‘60.2’is equivalent to the residual pressure valve and is limited by the final position of the mechanical cam plate.The residual pressure valve is reached after a prolon-gated threshold time of approx.0.1s.For a fine adjustment of the threshold curve and as an additional safety measure ,two throttling valves‘57’are provided for the respective residual pressure value. These components permit the pressure reduction characteristic (braking curve) to be variably adjusted (depending on requirements) and reproduced at any time.The capacity of the residual pressure accumulator is adapted to the maximum braking time of the winder, under consideration of the opening cross sections of the valves ‘57’and of the leakage rate of all valves. The time of maintaining residual pressure is abt.50% longer than the maximum braking time.When the winder comes to a standstill, a time element is started. After abt.2s, the valve‘63’is opened by a starting pulse and the residual pressure reduced to zero. At the same time, the residual pressure accumulator not needed is discharged through the pressure relief valve‘25.1’or‘25.2’(the valve is energized for a short moment).The possibility of adjusting and reproducing the braking curve between application pressure and residual pressure is of particular importance since, within this period, rope vibrations may occur which, with Koepe winders, may cause a slipping of ropes.The valves‘58’,‘65’,and‘66’as well as‘53’and‘39’are monitored for their position and, prior to the start of the winder releasing the safety brake checked for conformity.Furthermore, the starting and end positions of all curves are checked for conformity and thus also for correct functioning.During the safety braking, the pressure relief valves‘43.1’and‘43.2’remain operative.2.2.5 Releasing the safety brakeSince the control system including the pump motors is de-energized as soon as safety braking is started, the brake control system is in a resting state. The system is depressurized and the brake applied.The power required for the pump motors‘3.1’and‘3.2’and the control system is available.The system can be started when1. the electrical monitoring system does not signal any failure.2.all prerequisites for starting the pumps‘1.1’and‘1.2’are fulfilled.3.conformity of the valves‘39’、‘53’、‘58’、65‘、65’、‘66’and‘89’is given.The system is started and the brake released as described under items 2.2.1and 2.2.2.。
毕业设计中英文翻译
1 Introduction and scope1.1 Aims of the ManualThis Manual provides guidance on the design of reinforced and prestressed concrete building structures. Structures designed in accordance with this Manual will normally comply with DD ENV 1992-1-1: 19921 (hereinafter referred to as EC2).1.2 Eurocode systemThe structural Eurocodes were initiated by the European Commission but are now produced by the Comité Européen de Normalisation (CEN) which is the European standards organization, its members being the national standards bodies of the EU and EFTA countries,e.g. BSI.CEN will eventually publish these design standards as full European Standards EN (Euronorms), but initially they are being issued as Prestandards ENV. Normally an ENV has a life of about 3 years to permit familiarization and trial use of the standard by member states. After formal voting by the member bodies, ENVs are converted into ENs taking into account the national comments on the ENV document. At present the following Eurocode parts have been published as ENVs but as yet none has been converted to an EN:DD ENV 1991-1-1: Basis of design and actions on structures (EC1)DD ENV 1992-1-1: Design of concrete structures (EC2)DD ENV 1993-1-1: Design of steel structures (EC3)DD ENV 1994-1-1: Design of composite steel and concrete structures (EC4)DD ENV 1995-1-1: Design of timber structures (EC5)DD ENV 1996-1-1: Design of masonry structures (EC6)DD ENV 1997-1-1: Geotechnical design (EC7)DD ENV 1998-1-1: Earthquake resistant design of structures (EC8)DD ENV 1999-1-1: Design of aluminium alloy structures (EC9)Each Eurocode is published in a number of parts, usually with ‘General rules’ and ‘Rules for buildings’ in Part 1. The various parts of EC2 are:Part 1.1 General rules and rules for buildings;Part 1.2 Supplementary rules for structural fire design;Part 1.3 Supplementary rules for precast concrete elements and structures;Part 1.4 Supplementary rules for the use of lightweight aggregate concrete;Part 1.5 Supplementary rules for the use of unbonded and external prestressing tendons;Part 1.6 Supplementary rules for plain or lightly reinforced concrete structures;Part 2.0 Reinforced and prestressed concrete bridges;Part 3.0 Concrete foundations;Part 4.0 Liquid retaining and containment structures.All Eurocodes follow a common editorial style. The codes contain ‘Principles’ and‘Application rules’. Principles are general statements, definitions, requirements and sometimes analytical models. All designs must comply with the Principles, and no alternative is permitted. Application rules are rules commonly adopted in design. They follow the Principles and satisfy their requirements. Alternative rules may be used provided that compliance with the Principles can be demonstrated.Some parameters in Eurocodes are designated by | _ | , commonly referred to as boxed values. The boxed values in the Codes are indicative guidance values. Each member state is required to fix the boxed value applicable within its jurisdiction. Such information would be found in the National Application Document (NAD) which is published as part of each ENV.There are also other purposes for NADs. NAD is meant to provide operational information to enable the ENV to be used. For certain aspects of the design, the ENV may refer to national standards or to CEN standard in preparation or ISO standards. The NAD is meant to provide appropriate guidance including modifications required to maintain compatibility between the documents. Very occasionally the NAD might rewrite particular clauses of the code in the interest of safety or economy. This is however rare.1.3 Scope of the ManualThe range of structures and structural elements covered by the Manual is limited to building structures that do not rely on bending in columns for their resistance to horizontal forces and are also non-sway. This will be found to cover the vast majority of all reinforced and prestressed concrete building structures. In using the Manual the following should be noted:• The Manual has been drafted to comply with ENV 1992-1-1 together with the UK NAD• Although British Standards have been referenced as loading codes in Sections 3 and 6,to comply with the UK NAD, the Manual can be used in conjunction with other loading codes • The structures are braced and non-sway• The concrete is of normal weight• The structure is predominantly in situ• Prestressed concrete members have bonded or unbonded internal tendons• The Manual can be used in conjunction with all commonly used materials in construction; however the data given are limited to the following:– concrete up to characteristic cylinder strength of 50N/mm2 (cube strength 602N/mm)– high-tensile reinforcement with characteristic strength of 4602N/mm– mild-steel reinforcement with characteristic strength of 2502N/mm– prestressing tendons with 7-wire low-relaxation (Class 2) strands• High ductility (Class H) has been assumed for:– all ribbed bars and grade 250 bars, and– ribbed wire welded fabric in wire sizes of 6mm or over• Normal ductility (Class N) has been assumed for plain or indented wire welded fabric.For structures or elements outside this scope EC2 should be used.1.4 Contents of the ManualThe Manual covers the following design stages:• gene ral principles that govern the design of the layout of the structure• initial sizing of members• estimating of quantities of reinforcement and prestressing tendons• final design of members.2 General principlesThis section outlines the general principles that apply to both initial and final design of both reinforced and prestressed concrete building structures, and states the design parameters that govern all design stages.2.1 GeneralOne engineer should be responsible for the overall design, including stability, and should ensure the compatibility of the design and details of parts and components even where some or all of the design and details of those parts and components are not made by the same engineer.The structure should be so arranged that it can transmit dead, wind and imposed loads in a direct manner to the foundations. The general arrangement should ensure a robust and stable structure that will not collapse progressively under the effects of misuse or accidental damage to any one element.The engineer should consider engineer site constraints, buildability2, maintainability and decommissioning.The engineer should take account of his responsibilities as a ‘Designer’ under the Construction (Design & Management) Regulations.32.2 StabilityLateral stability in two orthogonal directions should be provided by a system of strongpoints within the structure so as to produce a braced non-sway structure, in which the columns will not be subject to significant sway moments. Strongpoints can generally be provided by the core walls enclosing the stairs, lifts and service ducts. Additional stiffness can be provided by shear walls formed from a gable end or from some other external or internal subdividing wall. The core and shear walls should preferably be distributed throughout the structure and so arranged that their combined shear centre is located approximately on the line of the resultant in plan of the applied overturning forces. Where this is not possible, the resulting twisting moments must be considered when calculating the load carried by each strongpoint. These walls should generally be of reinforced concrete not less than 180mm thick to facilitate concreting, but they may be of 215mm brickwork or 190mm solid blockwork properly tied and pinned up to the framing for low- to medium-rise buildings.Strongpoints should be effective throughout the full height of the building. If it is essential for strongpoints to be discontinuous at one level, provision must be made to transfer the forces toother vertical components.It is essential that floors be designed to act as horizontal diaphragms, particularly if precast units are used.Where a structure is divided by expansion joints each part should be structurally independent and designed to be stable and robust without relying on the stability of adjacent sections.2.3 RobustnessAll members of the structure should be effectively tied together in the longitudinal, transverse and vertical directions.A well-designed and well-detailed cast-in situ structure will normally satisfy the detailed tying requirements set out in subsection 5.11.Elements whose failure would cause collapse of more than a limited part of the structure adjacent to them should be avoided. Where this is not possible, alternative load paths should be identified or the element in question strengthened.2.4 Movement jointsMovement joints may need to be provided to minimize the effects of movements caused by, for example, shrinkage, temperature variations, creep and settlement.The effectiveness of movement joints depends on their location. Movement joints should divide the structure into a number of individual sections, and should pass through the whole structure above ground level in one plane. The structure should be framed on both sides of the joint. Some examples of positioning movement joints in plan are given in Fig. 2.1.Movement joints may also be required where there is a significant change in the type of foundation or the height of the structure. For reinforced concrete frame structures in UK conditions, movement joints at least 25mm wide should normally be provided at approximately 50m centres both longitudinally and transversely. In the top storey and for open buildings and exposed slabs additional joints should normally be provided to give approximately 25m spacing. Joint spacing in exposed parapets should be approximately 12m.Joints should be incorporated in the finishes and in the cladding at the movement joint locations.2.5 Fire resistance and durabilityFor the required period of fire resistance (prescribed in the Building Regulations), the structure should:• have adequate loadbearing capacity• limit the temperature rise on the far face by sufficient insulation, and• have sufficient integrity to prevent the formation of crack s that will allow the passage of fire and gases.Fig. 2.1 Location of movement jointsThe design should take into account the likely deterioration of the structure and its components in their environment having due regard to the anticipated level of maintenance. The following inter-related factors should be considered:• the required performance criteria• the expected environmental conditions• the composition, properties and performance of materials• the shape of members and detailing• the quality of workmanship• any protective measure• the likely maintenance during the intended life.Concrete of appropriate quality with adequate cover to the reinforcement should be specified. The above requirements for durability and fire resistance may dictate sizes for members greater than those required for structural strength alone.。
- 1、下载文档前请自行甄别文档内容的完整性,平台不提供额外的编辑、内容补充、找答案等附加服务。
- 2、"仅部分预览"的文档,不可在线预览部分如存在完整性等问题,可反馈申请退款(可完整预览的文档不适用该条件!)。
- 3、如文档侵犯您的权益,请联系客服反馈,我们会尽快为您处理(人工客服工作时间:9:00-18:30)。
电动汽车永磁无刷直流电机的轴向永磁体的运动轨迹设计N. A. Rahim, Member, IEEE, Hew Wooi Ping, Member, IEEE, M Tadjuddin 摘要:汽车制造商如丰田、本田、福特和现代都在从事紧急的研究、开发和制造燃料高效、环保的混合动力电动汽车。
电动机是混合动力车辆一个主要的能源消耗零件。
在驱动时电机除了要求高效率,还必须有强转矩和紧凑的设计。
本文设计一个电动马达直接驱动电动车辆。
设计了一种永磁电机以轴向磁槽内stator-non类型。
初步设计了一个电机转子16对磁极低速稳定的旋转下高转矩和大密度能量。
电机设计时利用Ansoft Maxwell3D进行了模拟电磁仿真有限元法(FEM)软件得到一定的参数。
电机安装在一个实验平台上,用实验测试数据对其结果进行比较,得到了仿真结果。
关键词:电动车、轴向磁永久性的永磁电机、驱动1引言电动汽车(EV)在不久的将来能成为一种非常明智的选择的交通工具。
一般而言,它是物美价廉,无污染的个人运输需要一种的新的方法。
大卫卡先生在1870年开发了一辆由笨重蓄电池和轻型电机组成的汽车,但是驾驶的速度和续航里程都很差。
在这多年后, 1898年年仅23岁得费迪南德保时捷博士制造了自己的第一辆车,Lohner电动四轮马车。
这是世界上第一辆前轮驱动的汽车。
他的第二辆汽车是一个混合型的,利用内燃机旋转带动发电机发电,驱动安装在车轮毂中的电动机。
单靠电池这辆车可以行使40公里。
在世界各地,有很多研究人员和工程师一直研究和开发最适合的电动汽车电机,是一个正在进行的敏锐过程。
永磁无刷直流电机已经成为电动汽车运用中最普遍的电机。
高级电源电子技术,比如适当的转换拓扑结构,自控制技术和强大的数字信号处理使我们能够建造一个高效、紧凑的驱动系统。
永磁无刷电机最突出的特点紧实度、低重量和高效率。
正是由于这些原因,永磁无刷电机为电动的发展提供了一个很好的选择。
永磁无刷电机已经成为实现发展电动汽车的实特殊要求的电机。
如高功率密度、高效率、高起点转矩、高航速。
运用于电动汽车中的电动机又被划分为间接驱动电动机和直接驱动电动机。
设计在车轮里的直接驱动电机叫做车轮马达或者轮毂电机。
它直接安装在车轮里面。
该款电动机不使用传动齿轮和机械差动齿轮传递机械作用力,同时直接驱动电机使用机械传动系统把力从电动马达传递给车轮。
机械传动系统造成额外的体积、重量和功率损失。
没有机械传动部件直接驱动系统通常提高整体效率,使车辆更小。
根据磁通量的不同,电机又被划分为两种类型。
径向式转子磁路电机(RFM)和切向式转子磁路电机(AFM)。
径向式转子磁路电机的磁通量径向通过定子、气门间隙和转子而AFM 是切向方向的。
和RFM相比,AFM能够提供更高的电磁转矩[6]。
对于直接驱动电机来讲,AFM比RFM更有优势。
例如平衡定子的吸引力、更优良的散热性能和调气隙。
多种构造的切向式转子磁路电机被用于许多高性能中[1, 3]。
这种电机能够用于更高效率的比转矩。
和有槽的切向式转子磁路电机相比,无槽的转矩脉动低[3]。
有许多轴向磁介质、大功率永磁转子与外部的运用,尤其是对电动汽车。
这种类型的电机具有突出的低速性能、高转矩特别,特别适合来来往往的巴士和穿梭挺。
小型电动汽车可以直接安装在车里上[2]。
本文的设计和实验室用的切向无槽式永磁电机,它被放置在一辆摩托车车轮里面。
2 设计原理电机设计进行了一下部分讨论,电机原先是被设计安装在电动摩托车的车轮里面。
2.1车辆动力学一个对车辆性能展现的简单车辆动力模型。
车辆动力模型包括负载(Fw)、,滚动阻力(fro )、空气阻力(fro )和上坡阻力(fst )。
F w = fro + fl + fst (1)滚动阻力是道路使轮胎变形产生的:fro = fr . m . g (2)上坡阻力(f st 是正号)下坡阻力(fst 是负号):fst = m . g . sin α (3)由表-1中的参数建立的模型已经被用于评估计算切向电机的衰减区域。
首先,所需的力必须要算出来。
从定义上加速度是单位质量所需的推动力:a= = dv dt =F M (4)或者时间tf 跟力的积分或者力跟速度dv 的积分:m ∫dv F Vrv 0 = ∫dv tf0 (5) 额定功率Pm 。
左边的方程式(6)可分为恒转矩(电机加速到Vrm )和恒功率(电机从Vrm 加速到Vrv )的积分:m ∫dV Pm/V Vrm 0 + m ∫dv Pm/V vrv Vrm = t f (6) 现在可以求得电机功率Pm,我们得到:Pm =m 2tf (v 2rm + v 2rv) (7) 恒转矩方式达电机速度达到vrm,然后在恒功率运行模式达到最大速度v rv的时间tf 。
如我们设计在10秒之内达到50公里/小时(13.88m/s )(vrm =10m/s,vrm = 13.88m/s 、tf= 10s)。
如果电机和乘员的质量是120kg,比功率取决于vrm 和vrv的比值。
当初速度vrm=0时,电机功率为1755.9.电机所需要的转矩可以用(1)得出。
风阻假定为0,车辆是跟道路平行。
力F 为166.5 N 、轮胎半径0.23米,转矩为38.3Nm 。
A 、 电机设计电机设计最需要强调的饿参数是共同扭矩和反电动势。
当一个通电导体被放置在一个磁性领域,它可以产生力,又称为电磁力。
这种力量是至关重要的,因为它就是电机、发电机和许多电器仪表最基本的原理。
一个力的大小取决于导体的方向对磁场的方向。
当导线垂直领域力最大和当它平行是力为零。
最大的作用力直导线上:F = Bli sinθ (8)F是导体上作用力,B是电机的磁通密度,l是导体长度, θ是导体电流方向和磁场的夹角。
在切向电机中导体的长度之间的区别是定子的外半径、磁漏和内半径。
假设电机中穿过导体截面积的磁通密度不发生明显变化,作用在导体上的机械力Fc用一个径向长度可以表示如下:Fc = B c i(r0–r i) (9)Bc是最大有效磁能的永磁体最佳工作点磁通密度标。
Fc = 2NcBci(r0-ri) (10) 单一导体的转矩为:Tc=rmB(r0-ri) (11) r m是运动的转子绕组平均半径对,定义为(ro +ri)/ 2。
比扭矩应跟每个圈数有关。
Tcoil=2NcrmB(ro-ri) (12)产生电机的运行过程中产生反电动势,利用相对速度计算了导体速度(ω)和永磁体每卷转线圈数(Nc):Ecoil=2NcwrmB(ro-ri) (13)从磁静力有限元模拟来确定电机的磁通密度。
磁线、磁通密度的情节如图1所示。
定子绕组线圈被安排在转子上面(中心的长轴)。
当前,线圈绕组注入按顺序排列。
通有电流的导体对嵌入磁铁的转子做相对运动。
三、部分的设计及模拟轴向磁永磁电机在磁路上不同于传统的电机。
电机被直接设计在车轮上驱动(in-wheel)如图2所示。
电机轴向磁放在轮胎的边缘一侧。
电机的旋转部件放置在定子的两侧。
这些部件可连同整个车轮自由旋转。
在这个设计中,三相绕组排列在环形定子上。
1.仿真参数利用Ansoft Maxwell3D设计软件电磁仿真有限元分析软件进行模拟仿真。
仿真先假设法目标模型为某电动摩托车输出(1.7 kW)。
然后进行模拟磁静态就是运行在每一步转子位置角相对位置定子。
这个模拟中输入的参数要考虑是永久性的磁体厚度、气隙宽度及磁性的活性物质图3显示的是利用Maxwell3D仿真软件做出的电机。
从这个模拟可以确定垂直通量密度,线圈(Bc)。
电机的转矩和反电势模拟值可分别采用计算方程(12)和(13)算出。
Table-II中的仿真参数要满足电动机的实际要求。
2..仿真结果图5显示模拟转矩就轴位置、图6显示仿真反电动势。
在这个模拟额定电流12A和额定转速的700 rpm,电机可以产生一个最大的扭矩的26个N.m 和反电动势157V。
这些结果表明,该电机可以实现电动摩托车动力需求。
四、制造和试验工作轴向电动机基于模拟参数制作。
马来西亚的几个实验室对其性能进行了测试研究。
1、:面向制造的设计制造该设计的轴向磁永磁电机最大的关键点的是保持定子、转子的线圈绕制的气门间隙。
磁力相互作用和转子磁铁定子背铁相当大(模拟该电机的值是752 N)。
电机的气隙间隙需要尽可能小。
设计电机的气隙间隙是1毫米。
永磁轴向电机转子装配图和零件图如图7和图8所示。
2、实验工作实验装置如图9所示。
一个和LabVIEW™合作的国家实验数据采集系统使用数据采集系统接口用来获取试验数据,绘制性能曲线。
得出实验的主要性能参数、电机的电动势和转动扭矩。
在巡航速度测试时,电机关键部分零件运动是二次测量温升也被记录在案。
图9所示的电机实验平台。
图10号和11号数据显示的反电动势扭矩。
最大的输出反电动势的300 V的峰值,扭矩输出时额定电流大约有25A。
反电动势的测量,电机在被加速到一定速度下得到了电机的转动轮子速度,然后测量终端电压。
在这种情况下,电机相当一个发电机。
在任何负荷条件下,电机终端测量的电压等于所产生的反电动势。
扭矩传感器测量使用压力传感器。
load-cell力传感器安装在自由转动的轴上。
电流以恒定值注入到电动机的逆变控制器中。
车轮因为加载负载刹车。
在很短的时间内扭矩增加到最大值。
扭矩也可以提高到额定值的两倍。
五、讨论实验结果已经进行了仿真验算。
反电动势的实际值,在测试过程中电机在301 Vp-p时转速为700rpm。
试验结果比在314 Vpp仿真下低了4.1%。
实验结果和仿真结果之间的差别的可能是由于绕组在生产过程稍微不同而产生的,由于模拟物理约束它不能做到底。
实验过程中产生的扭矩为25NM而进行了模拟扭矩的约26NM。
六、总结轴向永磁电机的设计、仿真和测试的已经作了综述。
最大扭矩大约25NM,电机反电动势301 Vp-p时转速700转/分钟。
电机的设计已经达到了规格要求和这个设计电机适用于电动汽车的应用。
为进一步调查,应采用耐久性试验来确定温升及机械装配的韧性。
优化设计参数与变化,如空气间隙、绕组和永磁体尺寸等可以提高电机的性能。
(注:可编辑下载,若有不当之处,请指正,谢谢!)。