作文:图表类常用句型
图表作文最基本句型
对比基本句:1.The cost of food accounted for thelargest proportion.2.The money which was spent onfood accounted for the largest proportion.3.The amount of money spent on foodwas the smallest/least.主语和后面的形容词一定要匹配4.British consumers spent moremoney on all items than Germans.5.In all the classes, the number ofboys is larger than that of girls.6.The smoking rate of men wasslightly/significantly higher than that of women.7.The consumption of beef wasslightly higher than that of lamb in 1991, with250 and 230 grams respectively.8. The British spent the most money/the largest amount of money on all items.9. The proportion of people aged over 65 was the highest.修饰名词:1.形容词+ 名词2.名词+ 介词短语3.名词+ 定语从句4.名词+ 分词短语The amount of acid rain which is caused by car using is the largest.The amount of acid rain caused by car using is the largest.变化基本句:1.increase—rise—growincreased—rose—grewdecrease—decline—falldecreased—declined—fell动词+副词Slightly—marginally—微小/差距很小Considerably—remarkably—可观Significantly—substantially—极其1). The proportion of people over 65 years old increased significantly from 13% in 1991 to 40% in 2011.2). The number of high school graduates who attended the High Test decreased considerably from 3.5 million in 2011 to 3.2 million in 2015.2.词组短语1). …….saw a (形容词)increase/rise/decrease/fall—名词词性2). ……witnessed a (形容词) increase/rise/decrease/fall—名词词性3). ……showed a/an upward/downward trend……A: The cost of textbooks saw an obvious increase, rising from 200 yuan to 260.B: The percentage of families having only one child witnessed a dramatic increase from 23% in 1995 to 60% in 2015.C: The number of cars using clean energy showed an upward trend, increasing from350,000 in 2012 to 600,000 in 2015.3.特殊变化Double 增长一倍Triple 增长两倍Half—halved 减少一半1). The number of Chinese tourists who visited Japan and South Korea doubled over the ten years, rising from 1.5 million in 2005 to 3 million in 2015. 2). The number of wild birds in the US almost halved, declining from 5 million in 2010 to 2.7 million in 2015.基本介绍句和过渡句:1.The chart shows information about名词短语/疑问句(how….).例句:The chart give s information about expenditures on six kinds of consumer products in four different countries in 1992.2.These charts give data regarding thepopularity of three kinds of music between genders and among different age groups.3.The graph illustrate s how thepercentages of TV viewers and radio listeners changed during a period of 24 hours.4.These charts compare five countriesin terms of illiteracy rates of males and females in 1990.5.过渡句—It is obvious that 特征描述6.过渡句—We can also see from thechart that……7.先写出一个明显特征,然后再强调在某个方面/时间尤其明显。
图表作文常用句型
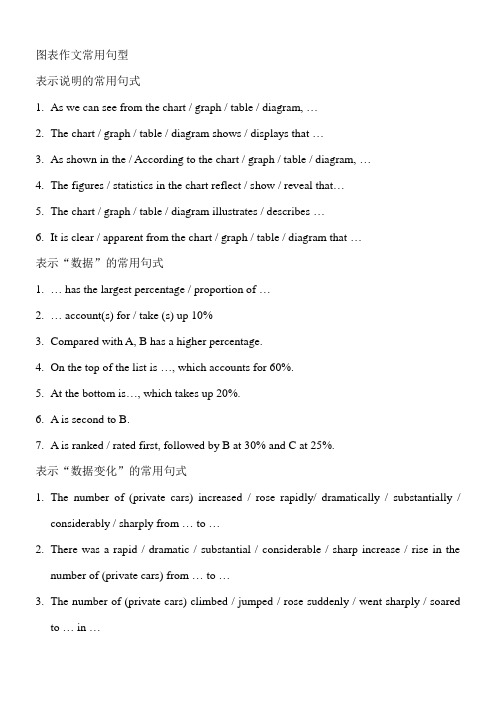
图表作文常用句型表示说明的常用句式1.As we can see from the chart / graph / table / diagram, …2.The chart / graph / table / diagram shows / displays that …3.As shown in the / According to the chart / graph / table / diagram, …4.The figures / statistics in the chart reflect / show / reveal that…5.The chart / graph / table / diagram illustrates / describes …6.It is clear / apparent from the chart / graph / table / diagram that …表示“数据”的常用句式1.… has the largest percentage / proportion of …2.… account(s) for / take (s) up 10%pared with A, B has a higher percentage.4.On the top of the list is …, which accounts for 60%.5.At the bottom is…, which takes up 20%.6.A is second to B.7.A is ranked / rated first, followed by B at 30% and C at 25%.表示“数据变化”的常用句式1.The number of (private cars) increased / rose rapidly/ dramatically / substantially /considerably / sharply from … to …2.There was a rapid / dramatic / substantial / considerable / sharp increase / rise in thenumber of (private cars) from … to …3.The number of (private cars) climbed / jumped / rose suddenly / went sharply / soaredto … in …4.There was an evident / apparent / obvious increase in … from … to …5.The number of (private cars) increased / rose steadily / gradually from … to …6.There was a steady / gradual increase / rise in the number of (private cars) from … to…7.The number of (private cars) decreased / fell / dropped suddenly / rapidly/ dramatically/ substantially / considerably / sharply from … to …8.There was a rapid / dramatic / substantial / considerable / sharp decrease / drop /reduction / decline in the number of (private cars) from … to …9.There was an evident / apparent / obvious decrease / drop / reduction / decline in …from … to …10.The number of (private cars) increased / rose // fell / dropped / declined by 10%from … to …11.T here was a slight fluctuation in the number of (private cars) from … to …表示不大或没有变化的常用结构1.The number of (private cars) remained steady / stable / constant between … and …2.There was little / hardly any change in the number of (private cars) between … and …3.The number of (private cars) appeared to level off.(私家车)的数量开始稳定下来。
大学英语写作“图表描写”常用句型

大学英语写作“图表描写”常用句型第一篇:大学英语写作“图表描写”常用句型大学英语写作“图表描写”常用句型大学英语写作“图表描写”常用句型描写图表不是要考生把图表中的数据全部写出来。
由于数据只起说明问题的材料作用,因此要对其有所挑选。
一个不漏地描述数据,不仅会让读者感到你的表达冗长、枯燥,而且会感觉你的表述不得要领,偏离重点。
因此,只要把最能说明问题的数据描述出来就可以了。
要做到对数据的描写有针对性,就必须用一句话把图表中所反映的问题或现象或趋势归纳出来,尽量放在文章开头表达清楚,这样做有一针见血之功能,也便于下面引用数据来阐述。
1.According to(As can be seen from / As shown in / It is clear / apparent from)the chart(graph / table / diagram / figure / statistics), ……2.The chart(graph / table / diagram)reveals(shows / suggests)that ……3.From the statistics(information)given in the table(graph / chart), we can estimate(see / conclude)t hat ……4.The number(percentage / figure)of …… nearly(almost)doubled, as compared withthat of last year.5.The figure(number / percentage)increased(dropped / decreased)more than(almost / about)six times(twice)compared with…6.The percentage(number)is twice(4 times / half)as much as that(those)of 1990.7.The rate(number)was X percent, less(more)than a half(third / quarter)of the 1998total.8.By comparison with 1990, it shot up(jumped / increased / rose / decreased / dropped /fell)by X percent(from X to Y percent / to X percent).9.By 1998, less than(more than / almost / about / over / as many as / nearly)three-quarters of(X percent of / one out of five / one in four / one half of)housewives(graduates / young couples / the number of students).10.A has almost(nearly / about / over)a quarter / half / twice / one third)as manystudents as(as much money as)B.11.During the period 1970—1999(From 1910 to 1974 / Since 1980 / Since the early 1980s)there was(has been)sudden jump(sharp rise / dramatic increase / a marked fluctuation / steady decrease / slight decline / gradual reduction / fall)in the number of people who… / personal income / college population.第二篇:考研英语写作漫画图表常用句型九.考研英语写作漫画图表常用句型列举几个常用于描述漫画的句式:1.The cartoon/picture briefs/depicts/shows...例句:The cartoon briefs the history of commercial fishing in the 20th century.2. In the picture,...例句:In the picture, an American girl looks so pleased in the richly decorated Chinese national costumes.3.Looking at the picture,...例句:Looking at the picture, many people cannot help laughing....4....。
图表类小作文必备句型
图表类小作文必备句型
段落一,数据展示与对比。
看这儿,图表上明明白白地写着呢!去年第四季度销售额嗖嗖地涨了15%,这都是因为咱们推出了新产品,还调整了营销策略。
而那竞争对手,市场份额就像泄了气的皮球,咱们的市场地位就更加明显了。
段落二,趋势分析与预测。
瞅瞅过去五年的销售数据,咱们的产品在市场上稳扎稳打,就像爬山一样一步步往上走。
照这个势头下去,未来几年咱们市场份额肯定还能涨,盈利也能跟着水涨船高。
段落三,数据解读与结论。
图表上那些数字可是个好兆头!客户对咱们产品的满意度越来越高,这都得归功于产品质量和售后服务的提升。
这么一来,客户们更信任咱们了,公司的长期发展也更有保障了。
段落四,数据背后的故事。
这些数据可不是天上掉下来的,背后都是咱们团队的辛勤付出。
从市场调研到产品研发,再到市场推广,每个环节都少不了团队成
员的智慧和努力。
这些成绩,都是大家用汗水和智慧换来的。
段落五,数据的启发与启示。
看着这些数据,我心里就有数了。
想要在竞争激烈的市场中站
稳脚跟,就得不断创新,满足客户需求。
这些数据不仅仅是数字,
更是咱们未来发展的指南针。
图表英语作文句子表达
图表英语作文句子表达1. 我需要写一篇描述图表和数据的英语作文,求一些常用的单词短语和句一、图表类作文常用的单词、短语和句型1. 表示数据变化的单词或短语 in the case of (在……的情况下) in terms of (在……方面)increase / raise / rise / go up(增加) decrease / grow down / drop / fall (减少) increased by (增长了) increased to (增长到)the number sharply goes up to(数字急剧上升至)significant(重大的),steady(平稳的),gradual(逐渐的),slow(慢慢的),stable(稳定的),rapid(快速的)…… 2. 表示从图表得知的信息的句型 The table / chart / graph shows that。
(这个图表告诉我们……)According to the table / chart /graph, we can see that。
(根据图表,我们可以看出……)It can be concluded from the graph that。
(从图表中可以得出……) The table shows the changes in the number of。
over the period from。
to。
(该表格描述了在……期间……数量的变化)二、图表类作文的模式图表类作文中的图表主要有以下形式:柱形图类(chart)、圆饼图类(pie chart)、曲线图类(line chart)、表格类(table)。
写文章时,首先要对图表加以描述,而后引出主题加以讨论,最后得出结论,也就是按照描述图表—解释原因—下结论的步骤来写。
切忌对图表不作交代就直接谈论主题。
1. 表格类作文的模式表格类作文一般可以分为三段:第一段对表格中的数据进行描述,只要抓住变化规律即可,切忌一一列举数据;第二段说明变化的原因;第三段得出结论。
英语六级图表作文模板及常用句型
英语六级图表作文模板及常用句型As is shown by the percentage in the picture X has been on rise/ decrease, X dramatically decreasing from X in X to X in X. From the sharp decline in the chart, it goes without saying that X.There are at least two good reasons accounting for X . In one hand, X .In the other hand, X is due to the fact thatX .In addition, X is responsible for X . Maybe there are some other reasons to show X .But itis generally believed that the above mentioned reasons are commonly convincing.As far as I am concerned, I hold the point of view that X . I am sure my opinion is both sound and well-grounded.英语六级图表作文常用句型1. 篇首As we can see from the chart/ As is shown in the table/ According to the table, the price of oil increased dramatically.The figures in the chart reflect that/ The statistics show that/The numbers in the graph reveal that people’s income has been increasing steadily.The graph suggests/shows/indicates/illustrates that there has been a sharp decline/rise in the population in this region.It’s clear/apparent that the output of this type of products is rising/dropping.2. 数据变化常用句型数据的增长The number of ….has grown steadily /has risen from / climbed / went sharply up /soared/ tends to go up / tends to increase….There was a rapid/sharp /dramatic/gradual/slowincrease/rise in the number of students.The number of students is on the rise/on the increase.数据的降低The number of … dropped steadily from / declined suddenly / fell/ tends to go down/ shows a tendency to decrease….There is a sharp fall/ gradual decrease/ sudden reduction / slow decline / drop ..in the number of ..in 2006.数据的持平In 2006, the number of … remain the same /steady /stable / constant /level.There was little change/hardly any change in the number of between …and …/There was a slight fluctuation in the number of ..from … to…表示比较级、倍数、比例关系be in direct ratio to/with 成正比 be in inverse ratioto/with 成反比have the largest percentage /proportion of 占比例the number of .. makes up /takes up / accounts for fifty percent of the total.占总量的50%Compared with…, … has a higher / lower percentage与。
商务英语图表作文常用句型
商务英语图表作文常用句型引导语:图表作文是BEC考试中常出的题型。
对于如何描述图表,很多学生都感到困难。
那么下面,为大家了一些常用的描述图表的句型,供大家参考,希望能帮助到大家1. To sum up, ...2. This bar chart displays the numbers of...3. The chart reflects several trends.4. But... we see a different trend emerging.5. When we pare..., we see...6. This suggests increased educational opportunities for women in higher education.7. Aording to the graph, ...8. The proportion of...9. There was a slight recovery...10. ... has dropped dramatically.11. At a slower rate...12. It reflects the great differences that exist between...13. These figures were overwhelmingly greater than the corresponding figure of...14. It can be seen from the chart that significantly...~er(比较级)...than...15. In all locations, A out numbered B...16. These two pie charts (饼状图) show the differences between two groups of...17. The first point to note is the huge increase (in the number of)...18. A is more than... times (bigger) than B19. The biggest loss was to A, which decreased from... to... of the whole.20. The biggest gains (in graduate numbers) were made by A which, as a group, have increased by over...21. The general trend appears to be increases.22. There were approximately...23. ... had jumped four fold to...24. ... rose sharply from... to...25. Remained constant at...26. The overall trend for...27. The graph shows the percentage of...28. We can see that... swell during the... hours, peaking at... am.29. Although the raw data does not provide an explanation for these trends30. When coupled with the graphic information, leads to some possible conclusions...?31. This may serve to explain, at least in part, the mirror image of the two lines.32. Perhaps the most telling feature of the chart is the dominance of...33. The graph relates the percentage of...34. Rise gradually to about 10%.35. After a slight drop around lunch time, audiences begin a fairly steady climb towards the peak viewer ship in the hours from 6pm to 10pm at some 40-45%.36. A sharp decline follows to...37. Listenership drops steadily from this peak, crossing the line for television views at around 2pm.38. It continues to decline throughout the eveninguntil reaching a low point at 2am.39. The graph proves the dominance of...40. During the peak period of...41. The diagram unfolds a clear parison between...42. The United States as a whole in four aspects, namely, ...43. Obviously, in every aspect...44. ... had a much higher growth rate than... as a whole during that period.45. The number of... increased by %.46. The most rapid increase of all the four aspects... As to the other three, though the growth rates were not so high, they were indeed remarkable and impressive.47. The number of... dropped by %.48. This increased again...49. From the diagram it can be safely concluded that (in the years)...50. There were many significant changes (in modes of transport)...51. The following paragraphs will identify and discuss the trends in the aompanying graph.52. A very noticeable trend was the steady decrease in...53. During the same period, there was a large increase...。
CET6写作必备万能句型:图表

CET6写作必备万能句型:图表★以下是###英文写作翻译频道为大家整理的《CET6写作必备万能句型:图表》,供大家参考。
更多内容请看本站频道。
一. 上升增长1.…add up to… 增加了. The total amount of … added up to 14 billionpounds(14%) in 1994.2. to jump to / to soar to…… 一跃达到/ 猛增到…. The total working days lost soared to 10 million in 1979. 3.…an increase of about…percent as compared with…… 与…相比大约增加了…eg. In August as many as 39 car accidents were reported, indicating an increase of about 79% as compared with the number of Januar y. 4.…to experience an increase/incline …有了增长 eg. Tobacco consumption is experiencing an incline.二. 下降,减少1.…to sink/drop/reduce to… 减少到…eg. The rate of strikes sank/dropped to the lowest pointin 1979. 2.…to experience a decrease/decline …有了减少eg. Tobacco consumption is experiencing a decrease. 注意:修饰上升/减少的副词有:rapidly slowly dramatically respectively 表达上升/减少的最后状态的词有:the highest peak the lowest point 10 million 10%三. 起伏1.…to go up and down …起伏不定eg. The strike rate went up and down during the period from 1952 to 1967.2.There be ups and downs …有起有伏eg. Between 1972 and 1979, there were several ups and downs in (某方面).四. 稳定1.…to remain steady/level/unchanged …保持稳定,几乎不变eg. The rate of …remained steady (fairly level/almostun changed) during the four years from 1963 to 1967. 2.…to level off (vi.)eg. After a steady decline for a whole decade, the …rate shows signs of leveling off. 注意:修饰起伏或稳定状态的副词有:almost fairly 能够用于表达起伏,稳定状态的句子中的词组或句型: the general situation was not worseningshow indications of improvement it can be predictedthat…eg. The rate of …remained steady during the four years from 1963 to 1967,and it can be predicted that the general situation was not worsening.eg. The rate of …remained steady during the four years from 1963 to 1967,showing signs of improvement in …五. 成正比,反比1.…be in direct /inverse ratio to/with 与…成正比/反比eg. Male illustrations are in direct ratio to /with the advancement of grades, while female illustrations are in inverse ratio.六. 占百分之几,几分之几1….to form/comprise/make up/constitute ….percent …占百分之… eg. Women comprise more than 50% of the U.S. population.eg. Females make up only 24% of the illustrations whereas males constitute 76%.2.…to form/comprise/constitute a half/thi rd/fourth of……占…的1/2,1/3,1/4eg. Female illustrions form less than a fourth of the total. 3.…account for…percent 占百分之几eg. ……, accounting for approximately 20 percent of…七. 倍数1.A be …times as much/many as Beg. The annual rainfall of Hunan is 5 times as much as that of Sichuan.2.A doubles/is half/triples B A是B的两倍,一半,三倍eg. The annual rainfall of Jidda doubles that of Janta, but is only half the amount of rain Kuwait receives each year.。
- 1、下载文档前请自行甄别文档内容的完整性,平台不提供额外的编辑、内容补充、找答案等附加服务。
- 2、"仅部分预览"的文档,不可在线预览部分如存在完整性等问题,可反馈申请退款(可完整预览的文档不适用该条件!)。
- 3、如文档侵犯您的权益,请联系客服反馈,我们会尽快为您处理(人工客服工作时间:9:00-18:30)。
1.the table shows the changes in the number of……over the period from……to……
2.the bar chart illustrates that……
3.the graph provides some interesting data regarding……
4.the diagram shows (that)……
5.the pie graph depicts (that)…….
6.this is a cure graph which describes the trend of……
7.the figures/statistics show (that)……
8.the tree diagram reveals how……
9.the data/statistics show (that)……
10.the data/statistics/figures lead us to the conclusion that……
11.as is shown/demonstrated/exhibited in the diagram/graph/chart/table……
12.according to the chart/figures……
13.as is shown in the table……
14.as can be seen from the diagram, great changes have taken place in……
15.from the table/chart/diagram/figure, we can see clearly that……or it is clear/apparent from the chart that……
16.this is a graph which illustrates……
17.this table shows the changing proportion of a &b from……to……
18.the graph, presented in a pie chart, shows the general trend in……
19.this is a column chart showing……
20.as can be seen from the graph, the two curves show the fluctuation of……
21.over the period from……to……the……remained level.
22.in the year between……and……
23.in the 3 years spanning from 1995 through 1998……
24.from then on/from this time onwards……
25.the number of……remained steady/stable from (month/year) to (month/year).。