GrADS命令大全模板
【grads】ncdump的使用总结

【grads】ncdump的使⽤总结1、参数ncdumpncdump [-c] [-h] [-v var1,...] [-b lang] [-f lang] [-l len] [-n name] [-d f_digits[,d_digits]] fileWhere:-cShow the values of coordinate variables (variables that are also dimensions) as well as the declarations of all dimensions, variables, and attribute values. Data values of non-coordinate variables are not included in the output. This is the most suitable option to use for a brief look at the structure and contents of a netCDF file.-hShow only the header information in the output, that is the declarations of dimensions, variables, and attributes but no data values for any variables. The output is identical to using the -c option except that the values of coordinate variables are not included. (At most one of -c or -h options may be present.)-v var1,...,varnThe output will include data values for the specified variables, in addition to the declarations of all dimensions, variables, and attributes. One or more variables must be specified by name in the comma-delimited list following this option. The list must be a single argument to the command, hence cannot contain blanks or other white space characters. The named variables must be valid netCDF variables in the input-file. The default, without this option and in the absence of the -c or -h options, is to include data values for all variables in the output.-b langA brief annotation in the form of a CDL comment (text beginning with the characters ``//'') will be included in the data section of the output for each `row' of data, to help identify data values for multidimensional variables. If lang begins with C or c, then C language conventions will be used (zero-based indices, last dimension varying fastest). If lang begins with F or f, then Fortran language conventions will be used (one-based indices, first dimension varying fastest). In either case, the data will be presented in the same order; only the annotations will differ. This option is useful for browsing through large volumes of multidimensional data.-f langFull annotations in the form of trailing CDL comments (text beginning with the characters ``//'') for every data value (except individual characters in character arrays) will be included in the data section. If lang begins with C or c, then C language conventions will be used (zero-based indices, last dimension varying fastest). If lang begins with F or f, then Fortran language conventions will be used (one-based indices, first dimension varying fastest). In either case, the data will be presented in the same order; only the annotations will differ. This option may be useful for piping data into other filters, since each data value appears on a separate line, fully identified.-l lenChanges the default maximum line length (80) used in formatting lists of non-character data values.-n nameCDL requires a name for a netCDF data set, for use by ncgen -b in generating a default netCDF file name. By default, ncdump constructs this name from the last component of the pathname of the input netCDF file by stripping off any extension it has. Use the -n option to specify a different name. Although the output file name used by ncgen -b can be specified, it may be wise to have ncdump change the default name to avoid inadvertantly overwriting a valuable netCDF file when using ncdump, editing the resulting CDL file, and using ncgen -b to generate a new netCDF file from the edited CDL file.-d float_digits[,double_digits]Specifies default number of significant digits to use in displaying floating-point or double precision data values for variables that don't have a `C_format' attribute. Floating-point data will be displayed with float_digits significant digits. If double_digits is also specified, double-precision values will be displayed with that many significant digits. If a variable has a `C_format' attribute, that overrides any specified floating-point default. In the absence of any -d specifications, floating-point and double-precision data are displayed with 7 and 15 significant digits respectively. CDL files can be made smaller if less precision is required. If both floating-point and double-presision precisions are specified, the two values must appear separated by a comma (no blanks) as a single argument to the command. If you really want every last bit of precision from the netCDF file represented in the CDL file for all possible floating- point values, you will have to specify this with -d 9,17.Usage Notesncdump generates an ASCII representation of a specified netCDF file on standard output. The ASCII representation is in a form called CDL (``network Common Data form Language'') that can be viewed, edited, or serve as input to ncgen. ncgen is a companion program that can generate a binary netCDF file from a CDL file. Hence ncgen and ncdump can be used as inverses to transform the data representation between binary and ASCII representations. See ncgen for a description of CDL and netCDF representations.ncdump defines a default format used for each type of netCDF data, but this can be changed if a `C_format' attribute is defined for a netCDF variable. In this case, ncdump will use the `C_format' attribute to format each value. For example, if floating-point data for the netCDF variable Z is known to be accurate to only three significant digits, it would be appropriate touse the variable attributeZ:C_format = "%.3g"ncdump may also be used as a simple browser for netCDF data files, to display the dimension names and sizes; variable names, types, and shapes; attribute names and values; and optionally, the values of data for all variables or selected variables in a netCDF file.ExamplesLook at the structure of the data in the netCDF file foo.nc:ncdump -c foo.ncProduce an annotated CDL version of the structure and data in the netCDF file foo.nc, using C-style indexing for the annotations:ncdump -b c foo.nc > foo.cdlOutput data for only the variables uwind and vwind from the netCDF file foo.nc, and show the floating-point data with only three significant digits of precision:ncdump -v uwind,vwind -d 3 foo.ncProduce a fully-annotated (one data value per line) listing of the data for the variable omega, using Fortran conventions for indices, and changing the netCDF dataset name in the resulting CDL file to omega:ncdump -v omega -f fortran -n omega foo.nc > Z.cdl2、注意①它是在dos底下⽤的,如果在gradsnc中⽤,请在命令前加感叹号。
GrADS命令大全
设置彩虹色颜色序列值(缺省:9,14,4,11,5,13,3,10,7,12,8,2,6)
set rbcols <auto>
打开系统缺省设置的彩虹色设置
set rbrange low high
彩虹色颜色对应等值线开始和结结束的范围
set grid on|off|<style>
清干净图形显示区并重新初始化,但1)不关闭任何文件,2)不取消变量定义,3)不改变set display设置
option=events; graphics; hbuff; norset
reinit
与reset相似,但关闭所有文件并取消所有定义
quit
退出
!shell-command
在GrADS命令交互模式下运行外部系统命令
用三次样条或线性插值的方式计算细网格的值
set cint value
设置固定等直线间隔值
set cmax value
设置最大等直线的值,超过的不再画出
set cmin value
设置最小等直线的值,小于的不再画出
set clevs lev1 lev2…
按lev1 lev2…指定值绘等直线
set ccols col1 col2…
按顺序执行fname文件中的命令组
clear <option>
c <option>
清干净图形显示区,但不关闭当前数据文件可带参数:命令可简写为“c”并可带以下参数:
events
清空事件缓冲区
graphics
清空图形缓冲区,但不清空组件缓冲区
hbuff
在双缓冲区模式下,清空显示缓冲区
grads常用命令
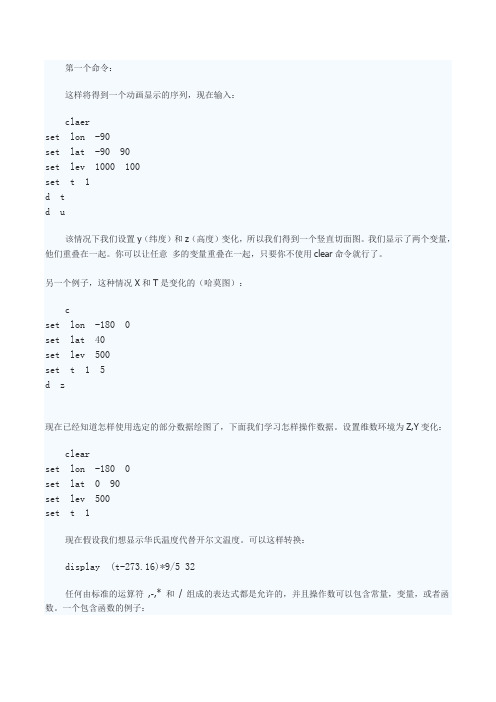
第一个命令:这样将得到一个动画显示的序列,现在输入:claerset lon -90set lat -90 90set lev 1000 100set t 1d td u该情况下我们设置y(纬度)和z(高度)变化,所以我们得到一个竖直切面图。
我们显示了两个变量,他们重叠在一起。
你可以让任意多的变量重叠在一起,只要你不使用clear命令就行了。
另一个例子,这种情况X和T是变化的(哈莫图):cset lon -180 0set lat 40set lev 500set t 1 5d z现在已经知道怎样使用选定的部分数据绘图了,下面我们学习怎样操作数据。
设置维数环境为Z,Y变化:clearset lon -180 0set lat 0 90set lev 500set t 1现在假设我们想显示华氏温度代替开尔文温度。
可以这样转换:display (t-273.16)*9/5 32任何由标准的运算符,-,* 和/ 组成的表达式都是允许的,并且操作数可以包含常量,变量,或者函数。
一个包含函数的例子:d sqrt(u*u v*v)有一个函数用来计算风的级数。
d mag(u,v)另一个内建函数计算平均值:clear d ave(a,t=1,t=5)这种情况我们可以计算5天的平均。
我们也可以从数据中移除平均值(距平值):d z-ave(z,t=1,t=5)也可以在x方向作平均并求距平:cleard z-ave(z,x=1,x=72)也可以做时间差分:cleard z(t=2)-z(t=1)完整规范的变量名是:name.file(dim |-|=va lue,…) 如果我们打开了两个文件,也许一个是模式输出,另一个是分析,我们应该区分用如下方法二者:display z.2-z.1另一个内置的函数通过有线差分计算水平涡度相关cleard hcurl(u,v)还有另外一个计算数值方向的质量积分:cleard vint(ps,q,275)这儿我们计算了可降水量(单位mm)现在来讨论控制图形输出的话题。
GrADS命令大全
set cthick thickness
设置等直线粗细,thickness=1~10
set csmooth on|off|linear
用三次样条或线性插值的方式计算细网格的值
set cint value
设置固定等直线间隔值
set cmax value
设置最大等直线的值,超过的不再画出
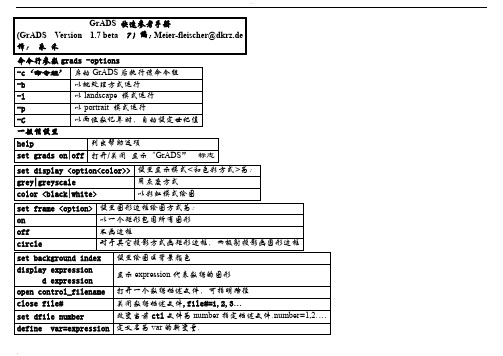
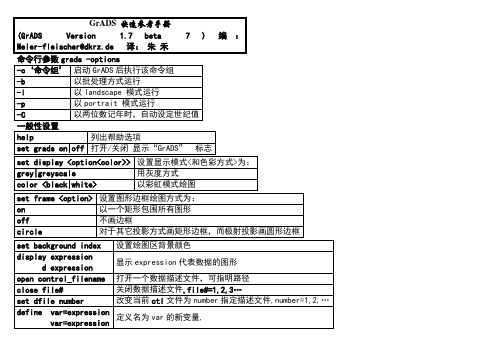
GrADS快速参考手册
(GrADS Version 1.7 beta 7 ) 编:Meier-fleischer@dkrz.de 译: 朱 禾
命令行参数grads -options
-c‘命令组’
启动GrADS后执行该命令组
-b
以批处理方式运行
-l
以landscape 模式运行
-p
以portrait 模式运行
是否标注台站号
set wxcols c1 c2 c3 c4 c5 c6
设置气象符号底颜色
坐标轴及边框设定参数
设置x轴标注的范围和<增量>
设置y轴标注的范围和<增量>
按lab1 lab2…标注x轴
按lab1 lab2…标注y轴
设置x轴标注的间隔
设置y轴标注的间隔
x轴y轴颠倒(缺省:x轴水平;y轴垂直)
modify varname<time type>
定义变量为气候序列平均,时间类型如下:
seasonal
月平均
diurnal
一日内多时刻平均
query <option>
q <option>
查询命令及其参数:
files
列出所有已打开的数据描述文件
file n
Grads使用手册
1
令。详见§6。 (4) .exe 系统命令文件,是 GrADS 系统在 DOS 环境下的各执行文件。如 grads.exe 为 GrADS
图形分析和显示命令;dos4gw.exe 为 DOS 的扩展环境;gxps.exe、gxpsc.exe、gxpscw.exe 都是图元文件转换为 postscript 文件的执行文件;gxtran.exe 是图元文件转换到显示器上 显示的执行文件;gx.exe 是将图元文件转换为各种不带 ps 解释器的打印机输出的执行文 件。详见§1.3。 (5) .gmf(.met) GrADS 系统图元输出文件,格式由 GrADS 内定,文件名随用户自定,
GrADS 的绘图工作区分三个层次,一层是实际页(real page),即硬拷贝的 A4 纸大小, 单位为英寸(注意横放或竖放);一层是虚拟页(virtual page),单位也是英寸,缺省时虚页 等同于实页;第三层是在虚页中指定绘图区域,其单位用的虚页中的虚英寸,即缺省时等同 于实际英寸,当设置虚页后按比例度量。注意第三层所定义的区域只包含图形,不包括坐标 轴、标题等附属信息的位置,即要预留出附属信息的区域。
(1) .dat 二进制无格式记录的原始气象数据文件,其数据既可以是格点数据,也可以是站 点数据。它们是从其它气象数据(如站点气象报、格点气象报、模式格点输出结果)转 换生成的。对格点数据而言,其格式为二进制无格式直接或顺序记录格式。总之对格点 数据,整个数据集是一个大的五维数据场,包括三维物理空间、一维物理变量、一维时 间变量,存放时以二维数组片的形式按水平、垂直、物理变量、时间序列的顺序排放, 详情参见§4。
本手册下载: GrADS 中文讨论区:
/grads/ /grads/gadoc/library.html /atmos/gadoc/library.html (本地) /grads/index.html /cgi-bin/forum/forums.cgi?forum=3
grads基本命令

grads基本命令d ave(olr,t+0,t+359,12) ave表示求平均,olr 为变量, t+0表示起始点为当前时次,即00z01jul1974;t+359表示终止时次为当前时次后推359个时次,即00z01jul2003;12表示每12个时次取一次数据;打开nc文件:ga->sdfopen查询信息:ga->q filega->q dimga->q ctlinfo写标题:ga-> draw title清除图面:ga-> c同时打开两个文件: ga->open model.ctlga->open model.le.ctl删除所有设置重新回到刚进入GrADS状态:ga->reinit删除open命令后的所有设置:ga->reset由风场导出涡度场:ga->d hcurl(u,v)以分色图形方式输出:ga->set gxout shaded以等值线方式输出(缺省方式):ga->set gxout contour画图例:ga->cbarn 1 0 (1:相对长短,>1放大;0:水平;1:垂直。
)以箭头方式表示矢量场: ga->gxout vector风矢量场:ga->d u; v; q (显示矢量时,d x分量;y分量<;标量>。
“<>”内的部分只起标颜色的作用。
)以流线方式表示矢量场:ga->set gxout stream风流线场:ga->d u; v; q以WMO风标方式表示矢量场: ga->set gxout barb风标:ga->d u; v; q直接输出网格点数值:ga->set gxout grid设置保留小数位数:ga->set dignum 0设置数字大小:ga->set digsize 0.1ga->set mpdraw on 如为off,不画地图背景(非经纬度数据需此项)ga->set poli on 如为off不画国界省界等。
grads基本命令
d ave(olr,t+0,t+359,12) ave表示求平均,olr 为变量, t+0表示起始点为当前时次,即00z01jul1974;t+359表示终止时次为当前时次后推359个时次,即00z01jul2003;12表示每12个时次取一次数据;打开nc文件:ga->sdfopen查询信息:ga->q filega->q dimga->q ctlinfo写标题:ga-> draw title清除图面:ga-> c同时打开两个文件: ga->open model.ctlga->open model.le.ctl删除所有设置重新回到刚进入GrADS状态:ga->reinit删除open命令后的所有设置:ga->reset由风场导出涡度场:ga->d hcurl(u,v)以分色图形方式输出:ga->set gxout shaded以等值线方式输出(缺省方式):ga->set gxout contour画图例:ga->cbarn 1 0 (1:相对长短,>1放大;0:水平;1:垂直。
)以箭头方式表示矢量场: ga->gxout vector风矢量场:ga->d u; v; q (显示矢量时,d x分量;y分量<;标量>。
“<>”内的部分只起标颜色的作用。
)以流线方式表示矢量场:ga->set gxout stream风流线场:ga->d u; v; q以WMO风标方式表示矢量场: ga->set gxout barb风标:ga->d u; v; q直接输出网格点数值:ga->set gxout grid设置保留小数位数:ga->set dignum 0设置数字大小:ga->set digsize 0.1ga->set mpdraw on 如为off,不画地图背景(非经纬度数据需此项)ga->set poli on 如为off不画国界省界等。
GRADS中文说明
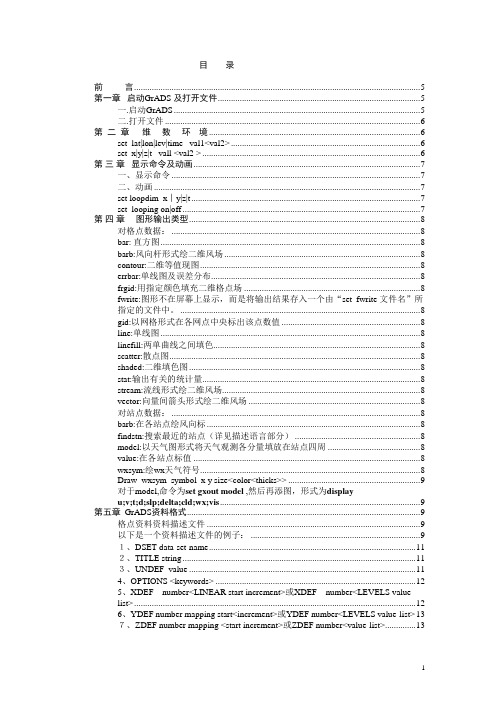
目录前言 (5)第一章启动GrADS 及打开文件 (5)一.启动GrADS (5)二.打开文件 (6)第二章维数环境 (6)set lat|lon|lev|time val1<val2> (6)set x|y|z|t vall <val2 > (6)第三章显示命令及动画 (7)一、显示命令 (7)二、动画 (7)set loopdim x︱y|z|t (7)set looping on|off (7)第四章图形输出类型 (8)对格点数据: (8)bar: 直方图 (8)barb:风向杆形式绘二维风场 (8)contour:二维等值现图 (8)errbar:单线图及误差分布 (8)frgid:用指定颜色填充二维格点场 (8)fwrite:图形不在屏幕上显示,而是将输出结果存入一个由“set fwrite 文件名”所指定的文件中。
(8)gid:以网格形式在各网点中央标出该点数值 (8)line:单线图 (8)linefill:两单曲线之间填色 (8)scatter:散点图 (8)shaded:二维填色图 (8)stat:输出有关的统计量 (8)stream:流线形式绘二维风场 (8)vector:向量间箭头形式绘二维风场 (8)对站点数据: (8)barb:在各站点绘风向标 (8)findstn:搜索最近的站点(详见描述语言部分) (8)model:以天气图形式将天气观测各分量填放在站点四周 (8)value:在各站点标值 (8)wxsym:绘wx天气符号 (8)Draw wxsym symbol x y size<color<thicks>> (9)对于model,命令为set gxout model ,然后再添图,形式为displayu;v;t;d;slp;delta;cld;wx;vis (9)第五章 GrADS资料格式 (9)格点资料资料描述文件 (9)以下是一个资料描述文件的例子: (9)1、DSET data-set-name (11)2、TITLE string (11)3、UNDEF value (11)4、OPTIONS <keywords> (12)5、XDEF number<LINEAR start increment>或XDEF number<LEVELS value-list> (12)6、YDEF number mapping start<increment>或YDEF number<LEVELS value-list> (13)7、ZDEF number mapping <start increment>或ZDEF number<value-list> (13)8、TDEF number LINEAR start-time increment (14)9、VARS number (14)二. 台站资料资料描述文件 (15)第六章变量名和表达式 (15)一、变量名和表达式 (15)二、表达式 (16)第七章函数 (16)一. aave函数 (16)二.abs函数 (16)三.acos函数 (17)四、asin函数 (17)五、atan2函数 (17)六、ave函数 (17)七、cdiff函数 (17)八、const函数 (18)九、cos函数 (18)十、exp函数 (18)十一、gr2stn函数 (19)十二、hcurl函数 (19)十三、hdivg函数 (19)十四、log函数 (19)十五、log10函数 (19)十六、mag函数 (19)十七、maskout函数 (20)十八、oacres函数 (20)十九、pow函数 (20)二十、sin函数 (20)二十一、skip函数 (20)二十二、smth9函数 (21)二十三、sqrt函数 (21)二十四、stnave函数 (21)二十五、stnmin函数 (21)二十六、stnmax函数 (21)二十七、tan函数 (22)二十八、tloop函数 (22)二十九、tvrh2q函数 (22)三十、tvrh2t函数 (22)三十一、vint函数 (23)第八章图形要素设置 (23)对于图形类型为contour起作用的设置 (23)set ccolor color——设置等值线颜色 (23)set ccolor rainbow——设定等值线颜色用彩虹表示 (23)set cstyle style——设定等值线线型 (23)Set cthick thckns——设定等值线线宽hckns(取值范围1~20) (23)Set cterp on|off——设置样条差值光滑开关 (23)Set clab on|off|forced|string|auto——控制等值线的标记方式。
- 1、下载文档前请自行甄别文档内容的完整性,平台不提供额外的编辑、内容补充、找答案等附加服务。
- 2、"仅部分预览"的文档,不可在线预览部分如存在完整性等问题,可反馈申请退款(可完整预览的文档不适用该条件!)。
- 3、如文档侵犯您的权益,请联系客服反馈,我们会尽快为您处理(人工客服工作时间:9:00-18:30)。
seasonal
月平均
diurnal
一日内多时刻平均
query <option>
q <option>
查询命令及其参数:
files
列出所有已打开的数据描述文件
file n
列出第n个数据描述文件的信息,n=1,2,3……
define
列出当前所有定义的变量名称
dims
circle
对于其它投影方式画矩形边框,而极射投影画圆形边框
set background index
设置绘图区背景颜色
display expression
d expression
显示expression代表数据的图形
open control_filename
打开一个数据描述文件,可指明路径
close file#
按分色图形输出每个网格
value
填测站观测值
grid
计算每个网格上的平均值
vector
以箭头表示的矢量图
line
一维曲线图模式
wxsym
在测站填气象符号
linefill
在两条一维曲线间填色
颜色、线型、标注缺省设制
GrADS缺省定义的16种颜色序号和它实际代表颜色的名称
0
黑
1
白
2
红
3
绿
4
蓝
5
青蓝
6
洋红
按顺序执行fname文件中的命令组
clear <option>
c <option>
清干净图形显示区,但不关闭当前数据文件可带参数:命令可简写为“c”并可带以下参数:
events
清空事件缓冲区
graphics
清空图形缓冲区,但不清空组件缓冲区
hbuff
在双缓冲区模式下,清空显示缓冲区
reset <option>
设置坐标轴框的颜色<粗细>
y轴数据变化范围从vlo到vhi
x轴数据变化范围从vlo到vhi
把断点数据连上/不连上
在图上方居中写标题string
地图投影方式
设置地图投影方式,关键字proj取:
等比矩形经纬度投影(缺省)
不等比矩形经纬度投影
北半球极射投影
南半球极射投影
robinson投影
orthogr投影
按指定值绘等直线时,为每一条等直线指定颜色
set line col <style> <thick>
设置等直线的颜色<线型<粗细>>
set lfcols col1 col2
为gxout linefill模式设置颜色
set black off|val1 val2
设置不画在val1 val2之间的等直线/关闭
为第(i,j)网格点重新赋值,i,j可以取小数
udft
显示用户自定义函数列表
lats
显示GrADS-LATS界面信息
xy2w v1 v2
给出xy坐标值(v1,v2),返回经度-纬度坐标值
xy2gr v1 v2
给出xy坐标值(v1,v2),返回网格坐标值
w2xy lon lat
给出经度-纬度坐标值(lon,lat),返回xy坐标值
GrADS快速参考手册
(GrADS Version 1.7 beta7 )编:Meier-fleischer@dkrz.de译:朱禾
命令行参数grads -options
-c‘命令组’
启动GrADS后执行该命令组
-b
以批处理方式运行
-l
以landscape模式运行
-p
以portrait模式运行
-C
以两位数记年时,自动设定世纪值
列出当前打开的描述文件维数信息
gxinfo
列出图形系统的窗口信息
shades
填色图中每种颜色的序号和它所对应的数值范围
pos
等待用户在图形区单击鼠标,反回一对位置坐标值
time
返回时间维信息
fwrite
返回当前fwrite命领输出文件的名称
string s
测试s代表的字符串的长度
defval vl i j
一般性设置
列出帮助选项
set grads on|off
打开/关闭显示“GrADS”标志
设置显示模式<和色彩方式>为:
grey|greyscale
用灰度方式
color <black|white>
以彩虹模式绘图
set frame <option>
设置图形边框绘图方式为:
以一个矩形包围所有图形
off
不画边框
mollweide投影
兰勃托投影
关闭投影
设置投影关闭|或颜色(或-1,由系统决定)、线型、粗细,type=0~255或*-任意类型投影
为极射投影设置标准经度lnmn,lnmx和标准纬度ltmn,ltmx
采用低、中、高分辨率或北美地图数据
自动画地图或设置颜色、线型、粗细
画地图地图
画/不画经纬度线或设置线型和颜色|或只画水平或垂直线
不规则分布数据模式
contour
等值线图模式
shaded
分色图
errbar
误差图模式
stat
按WMO规范显示测站观测数据
fgrid
填格点数值
stream
流线图
findstn
找出与某点最近的测站
tserwx
一维时间序列图
fwrite
把网格数据输出到文件中
tserbarb
风标表示的一维风场的时间序列图
gfill
以后3位数标数值
set mdlopts noblank|blank|dig3|nodig3
以3位数标模式值
set stid on|off
是否标注台站号
set wxcols c1 c2 c3 c4 c5 c6
设置气象符号底颜色
坐标轴及边框设定参数
设置x轴标注的范围和<增量>
设置y轴标注的范围和<增量>
设置矩形剪裁区
基本字符串绘图命令
设置字符串绘图的颜色<对齐><粗细><旋转>,对齐=l、c、r、tl、tc、tr、bl、bc、br,旋转=+度/-度,顺时针/逆时针
按lab1 lab2 …标注x轴
按lab1 lab2 …标注y轴
设置x轴标注的间隔
设置y轴标注的间隔
x轴y轴颠倒(缺省:x轴水平;y轴垂直)
x轴数值由大到小(缺省:由小到大)
y轴数值由大到小(缺省:由小到大)
x轴标注|不标注|自动|指定字符串
y轴标注|不标注|自动|指定字符串
指定x轴按lab1 |lab2 |…标注
清干净图形显示区并重新初始化,但1)不关闭任何文件,2)不取消变量定义,3)不改变set display设置
option=events; graphics; hbuff; norset
reinit
与reset相似,但关闭所有文件并取消所有定义
quit
退出
!shell-command
在GrADS命令交互模式下运行外部系统命令
指定y轴按lab1 |lab2 |…标注
x轴中心下方写字串string
y轴中心左侧写字串string
设置x轴标注的颜色<粗细<大小>>
设置y轴标注的颜色<粗细<大小>>
x轴标注位置,offset:英寸;side=b,下|t,上
y轴标注位置,offset:英寸;side=r,右|l,左
数据中z维用对数坐标
用三次样条或线性插值的方式计算细网格的值
set cint value
设置固定等直线间隔值
set cmax value
设置最大等直线的值,超过的不再画出
set cmin value
设置最小等直线的值,小于的不再画出
set clevs lev1 lev2…
按lev1 lev2…指定值绘等直线
set ccols col1 col2…
关闭数据描述文件,file#=1,2,3…
set dfile number
改变当前ctl文件为number指定描述文件,number=1,2,…
define var=expression
var=expression
定义名为var的新变量,
undefined var
取消var定义的变量
modify varname<time type>
设置虚页范围,单位:英寸
set parea xmin xmax ymin ymax
在虚页内,设置绘图页面大小(英寸)
图形显示模式控制
set gxout graphic-type
graphic-type可取以下参数:
bar
柱状图形模式
model
不规则分布测站模式
barb
WMO风标表示的风矢量图
scatter
维数参数设置
set lon val1 <val2>
设置经度取val1或从val1到val2范围
set lat val1 <val2>
设置纬度取val1或从val1到val2范围
set lev val1 <val2>
设置层取val1或从val1到val2范围
set t val1 <val2>
设置时间取val1或从val1到val2范围