Petrel学习笔记整理20110217
petrel笔记(适合初学者)
Input里面加载所有单井数据well、well tops、;Model是所建模型;Templates是做的模板以上窗口可以随意摆放,双击即可回去这是地震上的解释是构造模型的建立,property modeling是属性建模(包括孔隙度模型,渗透率模型,含油饱和度模型等等)是数值模拟加载数据:先新建insert ->new well folder;对井进行编组:右击wells->insert folder,把所有井拖进去;井位数据(well heads)、井轨迹数据(well path)、测井数据(well logs)、分层数据(well tops:well、surface、MD)测井解释成果(.Prn)用production log格式加载井对比(对比剖面图):新建一个new wellsection window(对比窗口),为相建模打基础,建立层拉平,setting->flatten on well top,在此之前先把others里面的分层拖进stratigraphy 里面,按顶(base)来拉平,(建立层拉平:按分层数据拉平)调整纵向比:setting->absolute(1000即可),手动调整比例尺通过这是将一个图道中的两条曲线反向的操作可去掉网格线调整曲线颜色,然后上色,因为所有gamma值都在0~1中间,调整曲线的取值范围,回到well,进到colors,设置最大值为120(或者自动获取)gamma 值大对应泥岩(孔隙度比较小)(孔隙度和gamma成反相关);RT电阻率(电阻率一般按对数的方式显示),SP自然电位,DT声波曲线;设置一口井为模板(单井模板只能保存一个:->),应用到所有井,(地质上分层就是按照测井曲线来分层的),(如果发现分层有问题,通过来调整这就是手动修改的层位)去掉中间井的分层名字:双击well tops->去掉sub labels,只留下两侧井的分层名字用可以圈定含油面积(根据井的油水对比剖面图)setting调整polygon的粗细颜色聚类分析:classsification对应岩相和地震相的解释设定:井、曲线、聚出几类数据流程窗口,选择,双击,要选有数据的井,setting设置为2,选择create(以后有新的数据要加载时选update),先点,apply,wells->里面多处一项(神经网络),此处将他换为相(facies),勾上facies,(泥岩shale;砂岩sand),,重新应用模板,用调整解释出的泥岩砂岩,建完构造模型后才能做离散化。
petrel学习
把形成的馆二5面导入,Z=A,则可 以把该层的断层线投到该层上去。
投上断层后的层位
在此窗口下
双击,构造建模
则生成建模窗口
此处被激活
把断层分解建立断面,再 对断面进行调整使其与实 际情况相符
断层建模完成后对每一个层位进行网 格化,做地层层面
选择对应的断层来建立断层面
选完后点击成面
可以使所建断层面两 端拉齐
导入井信息
右击添加井信息
添加well heads
文件类型与所选文件对应
每一列与其列数相对应 Name-1,X-2,Y-3, Bottom depth-4
则完成导入井位
添加井斜数据
导入井斜数据
井号需要对应,若不 对应可直接修改
列与列号对应
有可能在进程中出现错误,例如方位角大于360 可以先跳过,再检查
此处该文件夹名称 可以先建一个文件 夹来放数据
左键点击最下一层数据右键点击 上一层生成厚度的散点数据
生成了散点数据
导入断层线
此处选断层
则导入该断层
把散点数据和边界线导入 则可生成厚度图
显示等值线数据
合用 理右 化边 键 对 厚 度 等 值 线 进 行 编 辑
在3D窗口导入分层数据显 示
庄5-15-5的井斜数据有问题,可以去 查井斜原始数据,直接在petrel里改
导入测井曲线
点击,导入需时间长
有可能出现错误
加载过程会提示 有错误的井
加载完毕提示所有有错误的井
导入测井解释
Fluids大小写应一至
会提示错误
加载完显示Fluids
加载分层数据
修改名称
加载分层
建立如下断层
进行网格化
导入各个层位
XtraReport学习笔记要点
XtraReport学习笔记Jephy2011/8/19本文档是学习过程中所做笔记,对于更多深层次的知识还为了解清楚,有待大家共同学习研究。
目录一、基本概念 (4)二、页面构建时用到的事件 (4)三、报表结构 (5)四、报表常用属性 (6)五、报表控件 (7)1.W EB页面控件 (7)2.报表设计时控件: (7)六、报表类型 (8)1.静态报表 (8)2.表格报表 (8)3.主从报表 (8)4.多栏报表 (8)5.交叉表报表 (9)6.并列报表 (9)7.D RILL-T HROUGH 报表 (9)8.邮件合并报表 (9)9.标签报表 (9)七、报表数据源 (9)1.数据源 (9)2.绑定数据的方法 (10)2.1.使用.NET 数据提供程序绑定报表 (10)2.2.把报表绑定到List (10)2.3.把报表绑定到XML 数据 (10)八、数据绑定与报表预览 (10)1.设计时绑定 (10)2.运行时绑定 (11)3.C HART控件绑定 (11)九、数据呈现 (12)1.数据分组与排序 (12)2.数据筛选 (12)2.1.在报表级筛选 (12)2.2.在数据源级筛选 (13)3.数据格式化 (13)十、外观设置 (13)1.外观属性 (13)2.样式 (14)2.1奇偶行样式 (14)2.2.样式表 (14)3.附条件格式设置 (14)十一、交互导航 (14)1.超链接 (14)2.文档地图 (15)十二、其他 (15)十三、应用程序部署 (15)XtraReport一、基本概念:XtraReports 中的每个报表都由XtraRepot 类的一个实例表示,或者由该类的子类来表示(这种情况更常见)。
因此,每个报表都作为带区的容器使用,而每个带区中都包含报表控件。
XtraReports 中的每个报表都可以被绑定到数据,或者不绑定。
要创建绑定报表,则首先要把报表绑定到数据源,然后指定每个报表控件的数据绑定选项。
petrel软件详细教程
h
50
点击生成断层面
鼠标左键点击柱子或点进行调整编辑
h
51
调整后显示断层框架
h
52
网格化
点击pillar gridding
h
53
选择断层
设置为边界
h
54
选择断层
选择趋势线添加
设置J方向趋势
h
55
设置网格大小
双击pillar gridding
点击ok 点击Apply
h
56
点击显示网格
生成3D模型
h
42
右键单击,选择spread sheet
修改其 深度值 (填入 等高线 值)
全部等高线描完,深ห้องสมุดไป่ตู้值给定 每个面的所有等高线 在一个polygon文件中
h
43
描断层线
全部等断层线描完 每个面的所有断层线 在一个polygon文件中
h
44
选择make surface
h
利用数 字化等 高线做 矢量构 造面
断点深度纵向排列,保存为一个文件,文件名为 fault point . prn
h
24
其它数据
小层构造图
等高线稍密,纵向隔4-5个小层一张
h
25
提纲
一、Petrel软件介绍及基本功能 二、前期数据整理介绍
三、建模基本操作流程
h
26
导入井文件夹(new well Folder),点击确定
h
27
导入井头数据
h
19
井数据
well deviation
MD(深度) 1000 1025 1050
INCL 3.6 3.9 5.2
Petrel软件学习
地质研所
题纲
1、Petrel 基本理论介绍 2、Petrel 建模操作流程
(一)Petrel 基本理论介绍
1、主要功能
PETREL 主要功能
地球物理 解释分析
地质建模
多点地质统计算法 高斯随机函数算法 序贯高斯模拟 序贯指示模拟 改进的克里金算法 截断高斯模拟算法 神经网络综合预测 目标模拟 分级目标模拟技术 裂缝建模 断层建模的2 质量控制
油藏工程
2、建模流程
数据准备
数据输入
网格化数据 划分小层
构造建模 属性建模
输出数模所需要的文件
地质储量计算
网格粗化及属性粗化
3、油藏三要素
油藏三要素
构造 储层 流体
构造模型 储层地质模型 流体分布模型
题纲
1、Petrel 基本理论介绍 2、Petrel 建模操作流程
(一)数据准备
1、Wellheads(包括井名、横坐标、纵坐标、顶深、底深、补心海拔)
2、Welltops(包括井名、横坐标、纵坐标、补心海拔、测深、层位)
3、属性数据(包括孔隙度、渗透率、含气饱和度、)
(二)数据加载
1、加载Wellheads井位数据 加载类型选择:well heads(*.*)
2、加载Welltops分层数据 文件类型里选:Petrel Well Tops (ASCII)
Line type选择:Boundary polygo
(三)构造建模
Structural modeling (1) Define model (定义模型的名字) (2) 激活边界数据
(3) pillar gridding (设置网格步长,建立网格模型)
(4) Make horizons(给构造层位赋值,建立构造模型)
petrel操作指南精讲
选择了输入类型后,根 据文件类型,对各列数 据定义
设定MD深度计算的方法依据
MD、DEV、AZIM是最常 用的井斜文件类型
Petrel 地质建模系统
常规数据导入>测井曲线的导入: 右键单击wells,在 菜单中选择import (on selection)
在弹出窗口选择文件类型为 well logs (ASCII) (*.*), 选择准备好的井轨迹文件
井斜文件包含内容分四种: 1、MD、INCL、AZIM 2、TVD、X、Y 右键单击wells,选择输入,弹出对话框,在文件类 型一栏选择well path/deviation(ASCII)(*.*),选 择井斜文件,打开
3、X、Y、Z
4、DX、DY、TVD
Petrel 地质建模系统
井斜数据的导入
C、调整pillar时选中这个按钮,让 pillar的移动沿着走势的切线被调节
Petrel 地质建模系统
数据加载 地层对比 断层建模 Pillar 网格化 分层
Petrel介绍
相建模
编辑数据 岩石物性建模
体积计算
绘图
井位设计
Petrel 地质建模系统
点击process栏里的pillar gridding,会自动弹出一 个2D的窗口
利用右侧的make 点击右侧的 new I boundary trend和 , 沿着所有井的边缘圈定一个 new J trend按钮设定I、J趋 边界 势方向,趋势线尽量沿着主 要的断层,以避免后期操作 导致网格重叠
双击pillar gridding,弹出 对话框,设定网格大小, apply。检查生成网格是否 存在问题,一切无误点OK, 产生3D网格
petrel教程
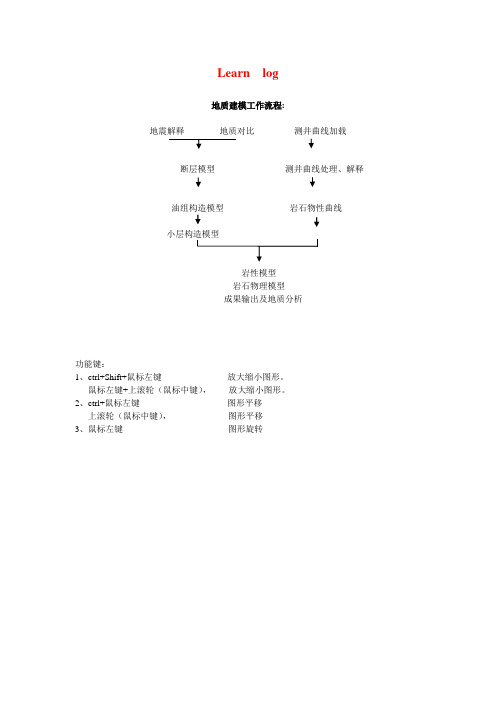
Learn log地质建模工作流程:地震解释地质对比测井曲线加载断层模型测井曲线处理、解释油组构造模型岩石物性曲线岩性模型岩石物理模型成果输出及地质分析功能键:1、ctrl+Shift+鼠标左键放大缩小图形。
鼠标左键+上滚轮(鼠标中键),放大缩小图形。
2、ctrl+鼠标左键图形平移上滚轮(鼠标中键),图形平移3、鼠标左键图形旋转建新工区lxj1 .pet一、建井文件夹new well folder在Insert的new folders→点New Well Floders1、加头文件在lxj1.pet Input窗下,右健点Wells→选Import (on select)…出现Import File输入窗中,点Petrel projects –-> cha19 → Well-data目录, 选文件名:文件类型:well heads(*.*)文件格式例子:WellName X-Coord Y-Coord KB TopDepth BottomDepth Symbol0 2534 Oil34/10-A-15 61757.5 30147.1 23.6 0 3133 Gas34/10-A-21 62165.3 32653.8 12.6 0 2431 Dry34/10-A-27 66552.1 31629.3 23.6 0 2986 MinorOil ......按打开,出现Import Well Heads窗,图如下:在窗口中参考Header info提供的列位置,填好列号,例如井名Name 1列X-坐标X-coordina 2列Y-坐标Y-coordina 3列补心Kelly bushing 4列井符号Well symbol 7列顶界深Top depth 5列底界深Bottom depth 6列在Extend well处选顶扩展或底扩展多少米,例如20米。
按OK,确定。
如果有不合适的井数据,会有提示指出,表示那些井不被加入。
petrel中文手册
一、启动Petrel每个公司启动Petrel软件内容是不同的。
在这个过程中使用一个bitlock来运行Petrel,通过使用下面的程序描述来打开软件。
1. 双击桌面上的Petrel 图标启动Petrel。
2. 如果正在使用bitlock,并且是第一次运行Petrel,在执行Petrel运行前会出现一个Petrel的介绍窗口。
3. 打开Gullfaks_Demo项目。
点击文件>打开项目,从项目目录中选择Gullfaks_Demo.pet。
4. 复制项目:选择文件>另存为,可以保存数据到你的学员目录,给项目命一个新名,如Ex-1,按保存。
二、界面介绍(一)、菜单条/ 工具条与大多数PC软件一样,Petrel软件菜单条有标准的“文件”、“编辑”、“视图”、View等下拉菜单,以及一些用于打开、保存project的标准工具,在菜单条下面的工具条里还有更多工具。
在Petrel里,工具条还包含显示工具。
此外在第二个工具条里还有位于Petrel 项目窗口的右端的按钮,它具有附加的Petrel 相关的功能。
后面的工具条称为功能条,这些工具是否有效取决于选择进程表中的哪个进程。
练习步骤1. 点击上面工具条中的每一项看会出现什么。
你可以实践一些更感兴趣的选项。
2.将鼠标在第二个工具条中的按钮上慢慢移动。
将会出现描述每一个按钮功能的文本出现。
3.点击“What's This”按钮,然后再点击其它的某个按钮。
将会现该按钮的功能的更详细的描述。
(二)、Petrel资源管理器Petrel资源管理器(左上角)跟任何PC机上的windows资源管理器一样工作。
通过点击加号、减号可以打开和关闭文件夹。
你可能注意到Petrel资源管理器下面的卡片,这些卡片可以从一个文件组移到另一个。
你将花费大部分时间在输入和建模卡片上。
练习步骤1. 点击输入卡片。
2. 展开文件夹显示其内容。
3. 右键点击文件夹有效的选项,从选项列表中选择设置,弹出一个窗口,支持文件夹的几个有效功能选项。
- 1、下载文档前请自行甄别文档内容的完整性,平台不提供额外的编辑、内容补充、找答案等附加服务。
- 2、"仅部分预览"的文档,不可在线预览部分如存在完整性等问题,可反馈申请退款(可完整预览的文档不适用该条件!)。
- 3、如文档侵犯您的权益,请联系客服反馈,我们会尽快为您处理(人工客服工作时间:9:00-18:30)。
目录1.How to Load a TVD Referenced Well Log into Petrel (1)2.Procedure for displaying production log data in pie chart form on a map in Petrel (1)3.Deleting Unwanted Well Tops That Have no Wells to Associate With in Petrel Software (3)4.Tips for Using Directions and Trends in the Pillar Gridding Process in Petrel2005 (3)5.How To Use Petrel2005to perform Seismic-based3D Property Modeling (4)6.Loading CheckShots with Non-zero Seismic Datum in Petrel (6)7.Digitizing Contours in Petrel (8)8.Defining Output Distributions when Modeling Sparse Petrophysical Data in Petrel (11)9.Running Uncertainty Volume Calculations Using Petrel Workflow Tools Using pre-defined workflows in Petrel (15)10.Modeling Net to Gross in Petrel Various methods for modeling the net to gross property in Petrel workflow tools (17)11.Real-time Modeling with Petrel (20)12.Creating Consistent and Accurate3D Grid Horizons with Horizon-Fault Intersections (22)13.Exporting Well Data from Geographix and Importing it into Petrel Software (25)14.Petrel Reservoir Engineering Core (28)15.Quick Depth Conversion Using Approximations to Analytical Functions in Petrel2005 (31)16.Petrel2005OpenSpirit Synchronization Tool Workflow (34)17.Importing,Editing and Displaying Borehole Unique Well IDs(UWI)in Petrel (35)18.Converting imported well coordinates for making designed points in Petrel well design process (38)19.Petrel RE2004replaces(and enhances)Schedule's functionality (41)20.Bricked Seismic Rendering and using Seismic Probes in Petrel (44)21.Upscaling from a fine grid to a coarse grid in Petrel (45)22.Upscaling from a fine grid to a coarse grid in Petrel (48)23.Displaying Time-Lapse Microseismic Data in Petrel (54)24.Improving Volumetric Estimates by Eliminating Pay Zones Too Thin to Exploit (56)25.Procedure for displaying production log data in pie chart form on a map in Petrel (57)26.Upscaling Water Saturation Logs Into a3D Grid (60)27.Deleting Unwanted Well Tops That Have no Wells to Associate With in Petrel Software (61)1.How to Load a TVD Referenced Well Log into PetrelLog files cannot be loaded into Petrel seismic-to-simulation software unless they are referenced to measured depth(MD).For loading into Petrel,a log file must have either MD or XYZ coordinates for each log s format standard requires MD as the depth channel. However,there are many instances when a well log has only a true vertical depth(TVD)channel. In these cases,the following work around must be used to load the log.(Note:A deviation survey must exist for the well.)1.Import the log file into Excel and remove all columns except the TVD column.2.Insert the number1in the second column.This increments by one each row,as follows:TVD Reference1222112232122433.Save the file as a text file.4.Insert a new checkshot in Petrel.5.Right-click on the checkshot folder and select Import.6.In the Import checkshots dialog,set the import settings to match the file.7.Toggle on Connect to Welltrace and select the correct well.8.Upon import,MD will be calculated from the well trace and this will be visible in the checkshots spreadsheet.9.In the checkshots spreadsheet,select the MD column and copy.10.In Excel,open the original log file,insert a new column,and paste the copied MD column into the new column.11.Save the file.12.Import the new well log file into Petrel using the Well Logs ASCII file type2.Procedure for displaying production log data in pie chart form on a map in PetrelProduction logs in the Petrel application can be displayed on a map window as pie charts,with multiple items displayed as pieces of the pie-for example Oil Production,Gas Production,and Water Production.The following procedure outlines the steps necessary to display production logs as a production pie chart in a map window.First,make sure the data appears in the global well log folder.This procedure will not work If aglobal well log does not exist for the production log.Right-click on the Attributes folder(under the Well Tops folder),and click Insert new attribute.●Set the attribute type to Continuous.●Name the attribute.●Select the correct template(for this example,Oil Production).●Select the Operations tab.The only thing you need to change here is the log to be used.Select the log that is to be used to make the new attribute,and then click Execute.This creates a new attribute.To display the attribute,open a map window,turn on the wells,and turn on the attribute and the associated well tops.To change the style of the display(from numbers to pie chart):Right-click on the well tops> settings>style tab.Here you can change it to symbol,pie chart,or azimuth.You can also determine the size, attribute,or cumulative sums.The result will be similar to the following:3.Deleting Unwanted Well Tops That Have no Wells to Associate With in Petrel SoftwareOn occasion,the Petrel software user would like to delete well tops that are no longer associated with a well in the project.The following procedure enables the user to identify and delete those tops.1.Create a depth log by using the well log calculator.Enter DEPT_new=DEPT with the Elevation General template and Sample MD from log DEPT.The new depth log DEPT_new is stored under Global Well logs.2.Right-click on the Well Tops attribute folder and select Insert new attribute.Select Continuous for attribute type.Go to the Attribute operations tab and use the newly created log DEPT_new.Click Execute.unch the Well Top spreadsheet and verify that the new attribute DEPT_new is listed here (note that some well tops do not have values populated in attribute DEPT_new).4.To sort the spreadsheet on the DEPT_new column,double-click on the DEPT_new column heading.Highlight the well tops with no value for DEPT_new.Click Delete to eliminate the well tops without associated wells.4.Tips for Using Directions and Trends in the Pillar Gridding Process in Petrel2005Pillar gridding in Petrel software is the process of making the skeleton framework of the3D model on which all other modeling and calculations are based.It is essential,therefore,to create a grid that accurately honors the faults.The Petrel application allows users to guide and control the skeleton grid by assigning directions to faults,inserting trend lines,and changing the number of cells in parts of the e the following tips to create a good framework:1.Start simple:Run the Pillar Gridding Process(press Apply to see the Mid skeleton)without using directions or trends.2.If directions and trends are necessary,start with just a few and then run the Pillar Gridding Process to see the results.3.All fault and trend directions of the same color should be roughly parallel to each other.4.All the red trends/directions should be roughly perpendicular to the green trends/directions.5.Trends cannot cross faults.6.Do not assign a direction to every fault.7.If necessary,use the"Set number of cells on connection"icon to force Petrel to use a certain number of cells in between two faultsor trends(when working with truncations or faults that have a high angle relative to each other). Press Apply and then OK in the Pillar Gridding Process to generate the Top and Base skeletons by extrapolating the pillars.Be sure to view the Top,Mid,and Base skeletons in3D view to determine whether your pillar geometry is acceptable.If it is not acceptable,additional refinement is needed.5.How To Use Petrel2005to perform Seismic-based3D Property ModelingSome notes on using Petrel2004to perform Seismic-based3D Property ModelingIt has been a recurrent theme since3D seismic became widely used;3D seismic traces are packed very densely(110'by110'bins,for example)-but well coverage is much more sparse. On the other hand,the vertical resolution of wells is much better than that of theseismic.We want to populate a model with petrophysical log properties-which aren't directly measured by seismic(seismic responds to Bulk&Shear Moduli and Density).How then do we approach this problem with the data at hand?What can we do?What should we do?The answer is accessed through Petrel's Process Tab:Process Tab>Utilities>Train Estimation Model>Input TabLet's examine the options:We can choose Classification or EstimationData Type:Seismic(or3D Properties)Method:Neural Net(currently,the only method)Training Data:All(not recommended for seismic;Petrel will be overwhelmed by the large number of samples in a typical seismic survey,and may lock or crash),Training Points(Well Tops or Point Set embedded in seismic),Log Data(for Estimation,Global Well Logspecified in Settings),Random traces(specify how many),or seismic Intersection.Choice of input data(right-hand window):choose multiple seismic attributes as inputs to the Estimation Modeling process.These may begenerated in Geophysics>Attribute Generation under the Process tab.The Corr(Correlation)Analysis tool allows you to study which of the attributes will contribute to the Classification or Estimation Task.This is a very large,complex topic in and of itself,and arguably the most important step.Suffice it say,however,that you want high correlationsof seismic attributes to whatever log you are trying to estimate in Estimation.For Classification, you need to select several attributes whichmeasure different physical characteristics and which have moderate to high correlations with each other.If they have perfect correlations,imeans that you're just looking at the same data stated in a different way;if the correlation is very low,they don't add additional informationto the analysis,only noise.Process Tab>Utilities>Train Estimation Model>Settings TabClassification can be done in an Unsupervised or Supervised manner.For Unsupervised,you need to choose the number of outputclasses.For Supervised,the number of output classes will be picked up from the Training Data, which must be selected from the pick-list.Estimation is always Supervised(by definition).The values for Training(error limit&convergence)Controls may have to be experimented with, but for the first run it's OK to accept thedefaults.Process Tab>Utilities>Train Estimation Model>Output TabThe only live options in the Process Tab are to Create New output,or to Update existing output.Although building an estimation model is certainly never a trivial matter,you can see that it is relatively easy from a workflow point of viewin Petrel.6.Loading CheckShots with Non-zero Seismic Datum in PetrelBy Dave PhillipsWhen building a project in Petrel software with a non-zero seismic reference datum (SRD),take care to ensure that checkshots properly reference travel times to the KellyBushing(KB)and SRD.This example shows how to calculate the parameters and loada checkshot for a well.The information needed for this loading process is KB,SRD,and Correction velocity (VCORR)for the seismic data.For this example,we will use:KB=5820ftSRD=6000ftVCORR=8000ft/secThe two-way times in the file(shown in Header info in Figure1)were corrected to the KB elevation.What we need to calculate is the time shift between the KB elevation and the SRD elevation.We use the formula:Reference offset time(ms)=2*(KB-SRD)/VCORR=2*(5820-6000)/8000=2*(-180)ft/(8000)ft/sec=-0.045sec=-45msecNote that if the KB elevation is above the SRD,the Reference Offset time will be positive instead of negative.This Reference Offset time is entered into the Import CheckShots Dialog box shown in Figure1.Other parameters that may need to be accounted for include:l TVD time/depth pairs are referenced to Ground level or some other elevation-this is accounted for inboth the Reference offset(ft)box and the Reference offset(ms)box.Note:MD can only be loaded if it isreferenced to KB.l Time and Depth values corrected to SRD-in this instance,the Reference offset(ft)would be thedifference between the KB and SRD,and the Reference offset(ms)would be zero.Reference offset=KB-SRD(positive if KB is above SRD,negative if KB is below SRD)The actual value of the SRD is never stored in Petrel software,but it is used in Depth conversion. To keeptrack of the SRD,it can be added as a comment in the Project Settings dialog,after your datum/spheroidinformation in the Datum column.7.Digitizing Contours in PetrelBy Cassandra LehmannCassandra is a Petrel training instructor in Houston.It is possible to digitize contour lines in Petrel workflow tools from bitmap images whendigital grids are unavailable.Surfaces can then be created from the contours and usedas input for a3D model.1.Import the image to be digitized into Petrel.Right click on a folder in the input tab of the Petrel Explorer and select Import on selection.2.An import dialog will appear.Select the file to be loaded and specify that it is a Bitmap Image.BMP,JPG,PCX,TIFF,and TGA are the supported formats.3.After the image is loaded to Petrel,you will see the object listed in the Input window,but it will not have a toggle box beside it to be displayed in a3D window.This is because the location needs to be defined.To define the XY location of the bitmap,right click on the object and select Settings.Here you will see a copy of the image.Click on Located in World,specify which corner is the origin and then enter in the coordinates for three of the corners.When that is done click OK.4.To begin digitizing the contours,display the image in a3D window and go to the Make/Edit Polygons process in the Process Diagram under Utilities.All the contours in the image need to be digitized in a single polygon e the functions available on the tool bar(on the right)to digitize the polygons.Petrophysical Data in Petrel9.Running Uncertainty Volume Calculations Using Petrel Workflow Tools Using pre-defined workflows in Petrel10.Modeling Net to Gross in Petrel Various methods for modeling the net to gross property in Petrel workflow tools11.Real-time Modeling with PetrelThe well trajectories and structural tops can be compared before and after drilling in a well section window.Also the synthetic facies log can be compared to the actual facies log to determine the degree of certainty in the model.There is an obvious shift in elevation of the top of the reservoir structurethat is apparent after updating the model with real data.These real-time techniques often prove valuable for staying within thinly bedded sand/shale reservoirs with horizontal wells.Updating the model can be done periodically during the drilling process to make new predictions with the latest data.One of the most critical factors governing these techniques is timing.It is imperative to get the data from the field into the model quickly to make decisions how to direct or'steer'the well while it is being drilled.12.Creating Consistent and Accurate3D Grid Horizons with Horizon-Fault Intersections13.Exporting Well Data from Geographix and Importing it into Petrel Software14.Petrel Reservoir Engineering Core15.Quick Depth Conversion Using Approximations to Analytical Functions in Petrel2005Petrel can be used for depth conversion using a blocky approximation to an analytical lookup function.This may be useful in frontier areas with little or no velocity control.The resulting velocity model may be used to depth convert Petrel3D grids or seismic.16.Petrel2005OpenSpirit Synchronization Tool WorkflowThe Petrel OpenSpirit(OSP)synchronization tool has been significantly improved for Petrel 2005.Most recently updated data(whether in Petrel or another application)is now color-coded. Green indicates that data was last modified in the Petrel application(and may need to be exported to the application from which the data was originally transferred).Red indicates that the item was last modified in an external application(such as the GeoFrame integrated reservoir characterization system),and that the data will need to be re-imported into the Petrel application.The following workflow explains how to update the Petrel application by using the synchronization tool after a GeoFrame item(in this example,a well top)has been changed.The workflow assumes that the data has already been transferred via OSP into the Petrel project.(If no data has been transferred,the synchronization tool tab will be blank.)If the data item is edited in the GeoFrame application,the change will be seen immediately in the data selector.1.Go to Project>OpenSpirit Settings.2.Under the Synchronization Tool tab,click Update Last Modify Dates.This shows you the data altered in the Petrel project without having to trace the hierarchy.)If you choose View Diff Only,only the changed data item(s)will be displayed.For export or re-import to be active,you must click Update Last Modify Dates.The items that have changed should be highlighted in red and have a>symbol.3.Select the red highlighted item(s)to update in the Petrel project.Hold down the Shift or Control button to select multiple items.4.Click Re-import to synchronize the data between the Petrel and GeoFrame applications.A message box displays what has(or has not)been updated.Once the data item has been updated in the Petrel project,the red highlight will disappear and the>symbol will become an=.5.Quality-check the data.The workflow for updating data items in the GeoFrame application(from the Petrel application) is similar,but he highlight will be green instead of red.17.Importing,Editing and Displaying Borehole Unique Well IDs (UWI)in PetrelHow to import UWIs into PetrelRules:1.UWIs must be imported in the Well Head file using the Well Head file type.2.UWIs must be imported at the same time with the Well Name,X,Y,Top depth,and Bottom depth.3.The file must contain a column for the Well Name to be imported(you cannot otherwise import the UWI for a well).The Well Name can be blank(use closed quotation marks).If a blank well name is provided,the Petrel application will automatically name the wells in consecutive order:Well Path1,Well Path2,etc.Naming Convention:1.UWIs can be any combination of letters,numbers,special characters,and spaces.2.If the UWI contains spaces in the name,it must be enclosed by quotation marks.3.If a UWI does not exist for a well in the file,the file must contain closed quotation marks(see the example below).Importing:1.Right click-on the Wells folder>Import on Selection.2.Choose file type:Well heads(*.*),select file,then click Open.3.The import Well Heads window is displayed.Assign the correct attribute to each column,then press18.Converting imported well coordinates for making designed points in Petrel well design process19.Petrel RE2004replaces(and enhances)Schedule's functionality20.Bricked Seismic Rendering and using Seismic Probes in Petrel21.Upscaling from a fine grid to a coarse grid in Petrel22.Upscaling from a fine grid to a coarse grid in Petrel。