JMP 常用工具整理
JMP操作2019 JMP11

11
3.19E-07 0.999999960 数据即可,与第一种计算方法相同。
12
3.60E-08 0.999999996
13
3.72E-09 1.000000000
14
3.52E-10 1.000000000
15
3.07E-11 1.000000000
16
2.48E-12 1.000000000
17
6
0.003279809 0.999189152
7
0.000670708 0.999859860
8
0.000118736 0.999978596
9
1.84834E-05 0.999997079 ✓若使用良品率计算,0.985,则使用Binomial
10
2.56E-06 0.999999641 Distribution计算,直接选取样本为#95所对应的
✓ 如果容量为n的随机样本取自一个均值为u标准差为s的 分布,则样本的均值将形成一个新的分布,新分布的均 值与原分布相同,但标准差缩小为s /sqrt(n)
✓ 因此,新分布s为3.01/sqrt(9)≈1
中心极限定理—两部分定义
✓ 如果容量为n的随机样本取自一个均值为u标准差为s的分布,则样本的均值将形成一个新的分布,新 分布的均值与原分布相同,但标准差缩小为s /sqrt(n)
0落于95% C.I.内,说明 该量测系统是可接受的。
线性操作
线性:在量具全作业范围内选取各适当刻度的零件加以量测分析
准备项 目
样本
1.
2. 3.
4.
条件
数
操作方式
量
选择代表性的规格区段(前/中/后段),并在该区 5 段选择任一产品规格 在该区段选择规格公差较大者 再选取该区段产品规格范围(ex. 0~10 um范围) 内取不同尺寸的5个样本 建立可追溯标准之真值或参考值,真值取得之方 式
常用JMP分析方法培训(一)

——技术工程师基本技能培训系列
培训目的
► 了解技术工作常用的数据分析 ► 掌握使用JMP软件进行分析的具体方法
2007-3-12
2
培训内容
日常工作内容 ► 生产线日常维护
工程能力确认 异常调查及改善
► 变更管理
2007-3-12
常用的分析手法 ► 工程能力Cpk的计算 ► 差异性的分析 ► 相关性的分析 ► 管理图的制作
7
工程能力Cpk的计算⑤
► Cpk相关估计
数据分布图形
不良率的估计
这是百 分数
2007-3-12 8
差异性的分析①
► 什么是差异性分析?
差异性(或同等性)分析,是在工程发生变更时, 为了分析变更前后Output数据的分布状态是否存 在统计意义上的有意差而进行的分析。差异性分 析在变更管理过程中,属于最常用的分析方法之 一。
► Step
1 制作数据表 ► Step 2 绘制直方图(Distribution of Y) ► Step 3 数据分析
离散值(Outlier) 正态性(Normality) Cpk
2007-3-12
6
工程能力Cpk的计算④
► 离散值的形态
Boxplots Normal Prob. Plot
2007-3-12 17
管理图的制作④
► 管理图的推移管理
中心值管理与上下限管理 周期性 工程项目的监控与预管理图
2007-3-12
18
各种分析曲线的形态
510
Hole_Diameter
LSL
USL
505
500 495
《JMP基础操作》课件

方差分析
通过方差分析,您可以检验不同组之间是否存在显著差异。
3
相关分析
相关分析可以帮助您探索变量之间的关系。
JMP基础操作:绘图功能
直方图
直方图可展示数据的分布情况。
散点图
散点图可用于展示变量之间的相关性。
箱线图
箱线图可显示数据的分布和异常值。
气泡图
气泡图可比较三个变量之间的关系。
JMP基础操作:模型建立
报告输出
JMP提供丰富的报告输出选项, 使您可以将分析结果以各种方 式呈现。
JMP基础操作:实例演示
1 实例选取
通过选择相关实例,您可以更好地了解如何应用JMP进行数据分析。
2 数据分析和建模
根据选定的实例,您可以学习如何在JMP中进行数据分析和建模。
3 结果展示
通过展示实例分析结果,您可以体验JMP在数据分析中的应用效果。
JMP基础操作:总结与展望
1 学习建议
学习JMP基础操作的建议和技巧,帮助您更快掌握JMP的使用。
2 应用前景
展望JMP在未来数据分析和可视化领域的应用前景。
导入数据
JMP支持从不同的数据源导 入数据,如Excel和CSV文件。
数据格式化
通过JMP提供的数据格式化 工具,您可以将数据进行清 洗和处理。
数据透视表
数据透视表可用于快速汇总 和分析大量数据。
JMP基础操作:统计分析
1
ቤተ መጻሕፍቲ ባይዱ
描述性统计
使用JMP进行描述性统计,可以获得关于数据的均值、标准差等指标。
2
1
回归分析
通过回归分析,您可以建立预测模型和
共线性诊断
2
评估变量对响应变量的影响。
JMP操作参考表
数据表操作
命令
Windows 左移或右移高亮区。如果单元格 内容已高亮度显示,请左移或右 移某个字符,逐个经过每个字符 高亮度显示多个邻近单元格。如 果单元格内容得以高亮度显示, 则将高亮度显示光标左侧或右侧 的多个字符 将某个单元格上移或下移。 将移至列顶部的列名 当单元格内容得以高亮度显示时, 您将看到闪烁的 I 形光标,请将高 亮区移至其它单元格的内容
特殊功能
命令
Windows 在某些报表中,将命令应 用于该报表中的所有相似 图形 选择或撤消选择分布直方 图中的条形柱 选择或撤消选择 Pareto 图中不相邻的条形柱 选择 Pareto 图中一定范围 内的相邻条形柱 选择不相邻的列 选择多个报表选项 按住 Ctrl 并单击红 色三角形图标菜单 中的命令 按住 Shift 并单击条 形柱 按住 Ctrl 并单击条 形柱 按住 Shift 并单击范 围外部的条形柱 按住 Ctrl 并单击每列 按住 Alt 并使用鼠 标右键单击蓝色菱 形图标 按住 Shift 键并单击 该范围内的第一列和 最后一列
快捷方式
Macintosh 按住 并单击红色 三角形图标菜单中 的命令 按住 Shift 并单击条 形柱 按住 并单击条形柱 Linux 访问核心平滑器 按住 Ctrl 并单击红色 三角形图标菜单中的 命令 按住 Shift 并单击条 形柱 按住 Ctrl 并单击条 形柱 按住 Shift 并单击范 围外部的条形柱 按住 Ctrl 并单击每列 同时按住 Shift 和 Alt 并使用鼠标右键单击 蓝色菱形图标 按住 Shift 键并单击 该范围内的第一列和 最后一列 在二因子交互最小二 乘均值图中转置因子 在保存均值或单个置 信区间时指定 alpha 水平 为 WeiBayes 分析指 定 beta (适用于 Weibull)或 sigma (适用于对数正态) 参数 创建 SAS 任务
JMP 简单操作
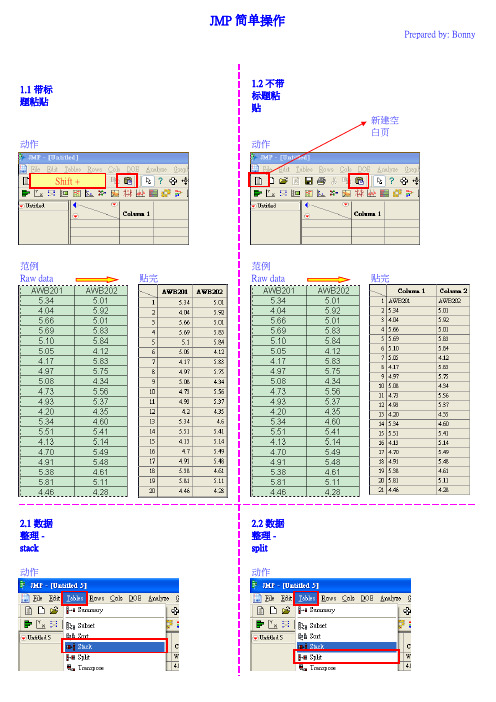
1.1 带标题粘贴1.2 不带标题粘贴新建空白页动作动作范例范例Raw data贴完Raw data贴完2.1 数据整理 -stack 2.2 数据整理 -split 动作动作JMP 简单操作Prepared by: BonnyShift +选中点击点击改名字范例Stack 前Stack 后Split回来3. 数据格式 -Continuous(连续型),Ordinal(序数型),Nominal(名词型)举例4.Distribution (正态分布图,分析最大值,最小值,平均值,Cpk)动作**原始数据要竖排可以一次选多列数据,结果是按列分析,选两列就产生两张分布图。
即使选多列也不会产生数据交叉分析。
动作: 竖排变横排(只为好看)结果动作:Cpk计算动作: 填入规格结果下限目标值上限5. 选中图片动作选中需要的横条,选完就6. Fit Yby X (盒型图,用于数据对比)动作**1. 原始数据要stack整理过**2. 用于两组及以上数据对比(不同机台,不同人员,改善前后等等)通常需要的动作选项结果:两圆有重叠,Prob > 0.05,无显著差异结果:两圆分离,Prob< 0.05,有显著差异不同的数据组合会产生不同的图形7. 柏拉图 (用于数据排序统计)动作范例:统计每种fail出现的次数051015202530354045C o u n tB 24K 06V 05V 06A 01A 19B 03B 11K 09K 17M 09Q F A 02A 06A 17A 18A 23A 26A 45B 07B 14B 15F 02F 20M 01M 05M 10M 36FA I L20406080100C u m P e r c e n t范例:统计fail 数量常用动作(显示百分比,数值等)50100150200250300350400CountA19K6QFB24K17A18V5M5K9V6A1M1B7M9M36A6B3B11F2B14A2A17A23A26A45B15F2M1FA I L20406080100CumPercent。
JMP的小技巧
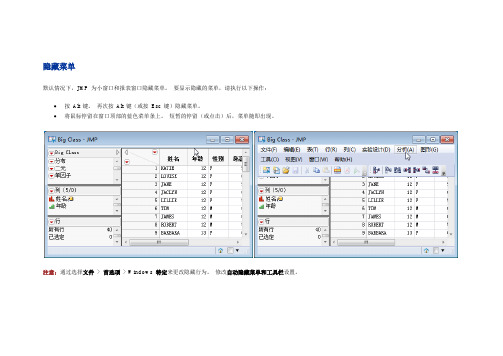
隐藏菜单默认情况下,JMP 为小窗口和报表窗口隐藏菜单。
要显示隐藏的菜单,请执行以下操作:•按Alt 键。
再次按Alt 键(或按Esc 键)隐藏菜单。
•将鼠标停留在窗口顶部的蓝色菜单条上。
短暂的停留(或点击)后,菜单随即出现。
注意:通过选择文件> 首选项> Windows 特定来更改隐藏行为。
修改自动隐藏菜单和工具栏设置。
窗口转换程序按Ctrl+Tab 键将显示窗口转换程序。
•按住Ctrl 键的同时重复按Tab 键将循环选择其他JMP 窗口。
•释放Ctrl+Tab 键将激活选定的窗口。
•您还可以通过点击列表中窗口的标题来激活窗口。
转至主窗口或相关数据表在报表中,要转至主窗口,请点击“JMP 主窗口”图标。
要转至相关的数据表,请点击“查看相关的数据”图标。
排列窗口要并排排列多个窗口,请执行以下操作:1.选中每个窗口状态栏中的选择框。
2.从菜单中选择其中的一个选项以排列选定的窗口。
您还可以使用主窗口或窗口列表来选择和排列窗口。
•要查看主窗口,请选择视图 > 主窗口。
•要查看窗口列表,请选择视图 > 窗口列表。
排列报表窗口要并排排列从同一数据表创建的多个报表窗口,请执行以下操作:1.按住Ctrl 键的同时选择您想在数据表缩略图面板中排列的报表。
2.右击缩略图面板中的任意位置,然后选择全部排列。
JMP 主窗口使用JMP 主窗口进行以下操作:•访问最近使用的文件•打开、关闭、重新排列或隐藏活动JMP 窗口•管理项目•访问最近使用的帮助退出JMP要关闭所有打开的窗口并退出JMP,请在任意JMP 窗口中按Ctrl+Q。
红色小三角菜单红色小三角表示有上下文的菜单,显示相关的命令。
展开按钮灰色小三角是展开按钮。
当您点击时,其报表部分交替打开或关闭。
在该示例中,二元拟合、线性拟合和拟合汇总报表是打开的。
失拟、方差分析和参数估计值报表是关闭的。
调整图形的大小要想同时调整若干个相似图形的大小,可按住Ctrl 键并调整一个图形的大小。
常用JMP分析方法培训
1 制作数据表 ► Step 2 绘制直方图(Distribution of Y) ► Step 3 数据分析
离散值(Outlier) 正态性(Normality) Cpk
2007-3-12
6
工程能力Cpk的计算④
► 离散值的形态
Boxplots Normal Prob. Plot
2007-3-12
9
差异性的分析②
► 差异性分析的目的
分析Input发生变更时,Output数据是否也发生 变更
► 差异性分析对象类型
Input数据:非连续型(Nominal)变量 Output数据:连续型、计量型变量
► 分析工具:矩形图(Fit
Y by X,Box Plot)
10
2007-3-12
USL x x LSL Cpk min( CpU , CpL) min , 3s 3s
USL:规格上限 upper spec limit xbar:全体数据的平均值
2007-3-12
LSL:规格下限 lower spec limit s: 全体数据的标准偏差
12
相关性的分析②
► 相关性分析的目的
分析Input发生变化时,Output数据是否也发生 同样的变化 分析是否可以通过控制Input项目来控制Output 项目
► 相关性分析对象类型
Input数据:连续型、计量型变量 Output数据:连续型、计量型变量
► 分析工具:散点图(Fit
2007-3-12 17
管理图的制作④
► 管理图的推移管理
中心值管理与上下限管理 周期性 工程项目的监控与预管理图
jmp介绍
JMP介紹CONTENTS 目錄OVERVIEW OF JMP 4 JMP 概觀GETTING HELP 8 獲取協助JMP DEMONSTRATION 9 JMP 功能表說明SETTING PREFERENCES 14 參數設定ENTERING DATA 輸入資料15 ∙Opening an Existing File 開啟舊檔16 ∙Starting a New File 開啟新檔17 ∙Exercise 1: Entering Data into a JMP Spreadsheet 練習1 : 資料輸入23 ∙Importing Data from Other Applications 載入資料24 ∙Exercise 2: Cut and Paste, Import 練習2 : 剪, 貼, 及載入資料28MANIPULATING DATA 29 ∙Adding Rows and Columns 加入行和列30 ∙Search and Replace 搜尋和替代33 ∙Selecting and De-Selecting Rows, Columns, and Table Portions選擇和取消行,列,和表格選取部分34 ∙Including, Excluding, Hiding, and Unhiding Rows and Columns包含及不包含, 隱藏和解除隱藏行和列37 ∙Row Markers, Colors, and Labels 行標記,顏色,和標籤39 ∙Moving and Deleting Rows and Columns 移動和刪除行和列43 ∙Copying, Moving and Deleting Table Portions 拷貝,移動和刪除表格部分44 ∙Tools Palette 工具箱45 ∙Exercise 3: Manipulating Data (Rows, Columns)練習3: 操作數據(行,列)48 ∙Table Subset 表格子集50 ∙Table Group/Summary 表格整理/資料摘要52 ∙Sorting Rows 資料排序55 ∙Exercise 4: Manipulating Data (Sort, Subset, Group/Summary)練習4: 操作數據(排序,子集,分組/歸納)56 ∙Stacking and Splitting Columns 堆疊和分隔列資料57 ∙Concatenating and Joining Files 垂直、水平接合檔案60∙Transposing the Table 調換表格位置64 ∙Exercise 5: Concatenate and Stack 練習5: 接合和堆疊65 ∙Exercise 6: Join 練習6:連接檔案66 ∙Using the Calculator Function 使用計算功能67 ∙Getting into the Calculator 進入計算功能表68 ∙Elements of the Calculators Window 計算功能視窗元件70 ∙Exercise 7: Using the Calculator 練習7:使用計算功能74ANALYZING AND GRAPHING DATA: 數據的分析和繪圖77∙Output Windows 輸出視窗78 ∙Border Menus 功能選單79 ∙Reveal Buttons 顯示按鈕80 ∙Pop-up Menus 下拉式功能選單81 ∙Re-sizing Graphs 縮放圖83MANAGING OUTPUT 管理輸出結果85 ∙Printing 列印86 ∙Cutting and Pasting Analysis Output 剪, 貼分析結果87 ∙Journaling 日誌88 ∙Saving 存檔91 ∙Exercise 8: Saving Output 練習8:儲存結果93Overview of JMPOVERVIEW OF JMPJMP 概觀Purpose of This Course: This course is designed to provide a hands-on introduction and overview of the JMP statistical analysis software system. This course focuses on learning how to use JMP for entering, manipulating, analyzing, and presenting data.課程的目的:這課程的設計是為了提供一個JMP統計分析軟體系統的實務操作簡介和概觀.這課程著重在如何使用JMP作資料輸入,操作,分析,和呈現.Course Pre-Requisites/Contents: Knowledge of statistics is not required for this course. However, some familiarity with basic statistics may be useful. A few statistical methods and tools are discussed in this course, but only in the context of learning about JMP, not statistics. Purchase and installation of JMP are not covered in this course, nor is any discussion of future JMP releases, features, or plans. (Such topics may be taken off-line with the instructor.)課前要求/內容:這課程不要求有統計知識的背景.然而,熟悉一些基本統計是有幫助的.僅少數有助於JMP軟體學習的統計方法和工具會在這課程中討論. JMP的購買和安裝,發行,特徵等相關內容不包含在這課程中.Target Population: People who use (or soon will use) JMP for statistical data analysis. It is assumed that course participants already have access to JMP (as well as its user documentation), or soon will have access to it.目標人口: 使用(或者將要使用) JMP來做作統計數據分析的人.Skills/Knowledge: Upon completion of this course, participants will know how to:技術/知識: 結束這課程時,參加此課程者將知道如何:∙Enter data into JMP,輸入數據∙Manipulate/massage data in JMP,操作數據∙Analyze data in JMP,分析數據∙Print out data analysis results,列印數據分解結果∙Access help.使用輔助說明Software Release: The contents of this course reflect JMP release 3.2. 使用軟體: JMP 3.2版.Overview of JMPWhat is JMP?JMP (pronounced “Jump”) is a powerful, flexible,Windows-based statistical analysis software system. It has a totallypoint-and-click graphical user interface, which eliminates the need for a programming or command language.JMP has very good graphics capabilities, and all of the data manipulation and analysis capabilities of SAS and RS/1, but is far easier to learn and use. As a Windows-based application, JMP works well with other Windows applications such as Word, PowerPoint, Excel, and cc:Mail.什麼是 JMP? JMP (與英文"跳躍"發音相同)是一個強的,彈性的, 視窗操作的統計分析軟體系統.這一個統計分析軟體系統完全使用點選圖形的用戶界面,不需要用編輯程式或者指令語言方式. JMP有非常好製圖能力,以及其他數據處理和分析能力,比SAS和 RS/1更容易學習和使用. JMP視窗操作統計分析軟體系統可與別的Windows應用程式如Word, PowerPoint, Excel,和 cc:Mail一起使用.History: JMP was developed by the SAS Institute, the largest supplier of statistics software in the world, and a long-time Intel supplier of VAX-based and PC-based statistics software. JMP was first released for the Apple Macintosh in October, 1989. It was made available for Windows-based PCin February, 1995. Though JMP is its first PC-based product, the SAS Institute has been supplying statistical software since the late 1960.歷史: JMP是由SAS學會(世界上最大的統計軟體供給者,也是長期英代爾的V AX-based和PC-based統計軟體的供應來源)所發展. JMP在1989年10月首先發行(for Apple Macintosh),. 1995年二月發行可在Windows-based PC下使用的版本.Minimum System Requirements系統要求: Windows 3.1 (plus Win32s), Windows 95, or Windows NT. Intel 80386 processor, 8Mb RAM, 10MB free hard disk space.User Documentation:使用者文獻∙Introductory Guide --- A basic overview of JMP written from a tutorial approach. This is a good first book for anyone not familiar with JMP.介紹導引---這是一個從教學的角度去撰寫的JMP基本介紹, 對於任何人不熟悉的與JMP這是相當好的入門.∙User’s Guide --- A detailed look at JMP data handling features. This isa good reference book for JMP data entry, data manipulation, and outputmanagement.使用手冊--- JMP數據處理特徵的一個詳細的手冊.這是對於JMP數據登錄,數據處理,和輸出管理相當好參考書Statistics and Graphics Guide --- A detailed look at JMP’s statistical analysis tools. This is a good reference book for JMP data analysis.統計和製圖法導引 ---一個詳細的JMP統計的分解工具. 對於 JMP數據分析是相當好的參考書.Getting HelpGETTING HELP使用輔助說明Help Menu: general-purpose help access, search list of keywords,statistics help.輔助選單: 一般輔助說明,關鍵字搜尋,統計輔助.Toolbar: Used for obtaining statistical help in output graphs andtables. Click on this icon, then on the desired area ofgraph/table.工具欄: 使用者可直接從點選圖和表格方式獲得統計的輔助解說.Support Model:支援模型Before contacting technical support directly, you will want to check to see if your question has been answered in SAS Institute JMP Frequently Asked Questions (FAQ) section. This is accessible on the WWW at/service/techsup/faq/jmp.html. Or call JMP Technical Support at 919-677-8008 M-F 9-5 EST.在你尋求技術支援前, 上網查尋(on the WWW at/service/techsup/faq/jmp.html)SAS學會是否已有回答類似問題(FAQ 部分).或者打JMP技術支援電話919-677-8008 M-F 9-5 EST.If you are in ATD or ATMO and have any statistically related questions on JMP, please contact an ATD or ATMO statistician. If you contact TAC4-1234 they will refer you back to your local statistician. If we determine the problem to be network or computer related, we will take the steps to involve the correct people.如果你是ATD或者ATMO的成員且有任何的在統計上有關JMP的問題,請聯絡ATD或者ATMO統計員.JMP DemonstrationJMP DEMONSTRATIONFile Menu檔案選單---Creating, opening, saving files. Importing data from other applications.Printing. Exiting JMP.開起新檔,打開舊檔, 儲存檔案.從別的應用程式作數據轉載. 列印.退出JMP.Edit Menu編輯選單---Undo, cut, copy, paste. Clear cells in spreadsheet. “ Journal” feature for exporting graph and table output to other applications.取消,剪,複製,貼.清除電子試算表單元. “日誌"功能(圖和表格轉載到別的應用軟體).Tables Menu表格選單---Manipulating data in the spreadsheet: grouping, summarizing,subsetting, sorting, stacking, splitting, transposing, concatenating, and joining. Design of Experiments feature.電子試算表數據的整理及計算:包含組合, 歸納,子集,排序,疊合,分隔, 轉置, 連鎖,和接合.設計實驗.Rows Menu行選單---Row-related data manipulation features: excluding, including, hiding, unhiding, labeling, unlabeling, coloring, marking, selecting, moving, adding, and deleting.行的數據處理:不包含,包含,隱匿, 顯示,標籤, 除去標籤,著色,標記,選擇,移動,加入,和刪除.Columns Menu列選單---Column-related data manipulation features: naming, hiding, unhiding, moving, adding, and deleting. Calculator for creating/modifying columns based on functions of other columns.列的數據處理: 命名,隱匿, 顯示,移動,加入,和刪除.JMP DemonstrationAnalyze Menu分析選單---(Use crime.jmp to demonstrate Correlation of Y scatter plot matrix)(使用crime.jmp)Distribution of Y: histogram, C pk, Normal probability plot, meantest, Normality test.Distribution of Y:直方圖, Cpk, 常態圖, 平均直檢定,常態檢定.Fit Y by X: scatterplot, line and curve fitting, boxplots, 1-wayANOVA and t-test for equal means, tests for equal standarddeviations, contingency tables.Fit Y by X: 散佈圖, line and curve fitting, 箱型圖, 平均直One-way ANOV A和t-test檢定, 標準差檢定,偶然表格.Fit Model: multiple regression, multi-factor ANOVA with nestedand crossed factors, variance components, response surfaceanalysis.Nonlinear Fit: non-linear model fitting.非線性: non-linear模型Correlation of Y: scatterplot matrix, correlation matrix.Y: scatterplot矩陣,相互關係矩陣.Cluster: cluster analysis.群組分析Survival: reliability data analysis.殘存分析:可信數據分析.Graphs Menu圖選單---(Use cowboy.jmp to demonstrate Spinning Plot) (使用cowboy.jmp)Bar/Pie Charts: bar, pie, and line charts.柱狀/圓餅圖: 柱狀圖,餅圖,和折線圖Overlay Plot: multiple lines on the same graph.覆蓋繪製:多條線可繪在相同的圖上.Spinning Plot: 3-D plot which can be rotated in any direction.紡織繪製: 3-D繪製能在任何的方向作旋轉.Pareto Charts: Pareto diagrams. 柏拉圖Control Charts: control charts, out-of-control tests, gage R&Ranalysis, variance component analysis.控製圖:控製圖, 失控測試,抵押品R&R分解,變異成分分析Contour Plot: contour plot of Z over X-Y plane.輪廓繪製: Z 在X-Y平面的輪廓繪製Ternary Plot: contour plot of response from mixture of threevariables.三個的繪製: 混合的三變量之反應值輪廓繪製.Tools Menu ---(Tools will be discussed and demonstrated later in the Tools Palette section.)Pointer: selects windows, graph points and bars, table rowsand columns. 箭頭標示: 選擇視窗, 圖點, 柱形圖, 表格欄列Hand Tool: direct manipulation of histograms and spinning 3-Dplots. 手形標示: 直接共製直方圖或是轉動圖Help: statistical help used in output graphs and tables.求助功能:直接使用在輸出圖表上Brush: highlight rectangular areas of points on graphs.著色功能Crosshairs: set of axes to find point coordinates and distanceson graphs. 座標十字: 指示點的座標Scissors: select sections of output graphs and tables forcut-and-paste. 剪刀: 用來剪下圖和表Lasso: highlight irregular areas of points on graphs. 套索: 用來選不規則的區域Magnifier: zoom in on graph areas. 放大鏡: 放大某圖形區域Annotate: insert text comments in output graphs.JMP DemonstrationWindows Menu視窗選單---Show markers, colors and/or tools palettes. Arrange, redraw, hide, name or close windows. Toggle between windows.顯示標記顏色和工具調色盤.Setting PreferencesSETTING PREFERENCES設定輸出視窗格式Preferences may be set for output windows using the File, Preferences selection from the menu. There are preferences that apply globally and preferences that apply to specific output windows. Preferences may be set to affect all future output. Most Preferences determine the initial look, content and layout of the output.在File/Preferences 下可以從功能選單中選擇輸出視窗格式, 且此格式將會被應用在未來所有輸出視窗上.Recommended preferences: 建議設定Extra Larger Markers: All graphs will have extra large markers.Under the Analyze Menuselect Fit: Oneway Layoutunder Display Options:click on Show Pointsclick on Quantile Boxesclick off X-axis proportionalIncrease font sizes using FONTS …You may access the recommended Intel Preferences on the ATD Stats Web page.Entering DataENTERING DATA輸入資料In most cases, the first thing you will want to do with JMP is to enter data. This section of the course introduces the various ways you can get data into JMP:在多數情況下, 操作JMP必須做的第一件事是輸入數據.這部分的課程告訴讀者不同輸入數據的途徑1. Opening an existing JMP file.開啟一存在的JMP檔案2. Starting a new file.開啟一個新的檔案3. Importing data from other applications.從別的應用程式轉載數據Entering DataOpening an Existing File開啟舊檔1. Select Open under the File menu.選擇File/Open2. Use the dialogue window to select which file you want to open.使用對話窗口選擇欲打開的檔案3. Use JMP to manipulate or analyze the data or to enter more data.使用JMP操縱或分析數據或者輸入更多數據Starting a New File開始一個新的檔案1. Select New under the File menu, or click the icon.選擇File/New 或點開2. Double-click here在這裡按兩下加行to add rows 3. Double-click here to add columns在這裡按兩下加列4. Set up each column (Cols menu, Column Info item):name, data validation checking, data type (numeric, character), modeling type (continuous, nominal, ordinal), field width, etc.列的設定(選Cols/Column Info): 列的命名, 數據確認檢驗, 定義數據類型(數值,字符), 建立模式類型(連續的,名目的,序數), 域寬度(field width), 及其他5. Enter the data (cut/paste, keyboard, etc.).輸入數據(剪/貼,鍵盤輸入, 及其他.)Column Info Options列信息選項Col Name:Choose any name desired to identify contents.列名稱:選擇適合的名稱以識別Lock:Use to keep the contents of a column from being accidentally changed.鎖:預防列資料被意外的改變Validation:Values to be entered are restricted to a range or list.確認:歸範輸入值使其受一範圍的限制∙List Check ------ values may be entered into a list, all values put in the column must match values in the list. Ctrl-Click brings up theacceptable list of values that can be entered.目錄檢查------輸入值必須是合乎指定要求∙Range Check ------values entered into the column must be within the specified range of values in the range check.範圍檢查------輸入值必須是合乎指定的範圍.Data Types: What kind of data goes in the column?數據類型∙Numeric ------ column contains numbers. Values are right justified.數值的------列包含數字.值是靠右排∙Character ---- column contains any characters, including numbers.Values are left justified.字符----列包含任何的字符, 及數字. 靠左排.Row State --- characteristics associated with a row (e.g.,hidden/not-hidden, excluded/included, color, marker, etc.).Not used in data analysis, except to customize theappearance of graphs.行狀態---隱藏/解除隱藏, 不包含的/包含的,顏色,標記,及其他.Entering DataModeling Types: How is this data going to be used?建立模型: 資料形態及使用∙ Continuous --- numeric values that are treated as continuousmeasurements. Data values are used in calculations.連續的 ---連續的數值是可以計算.∙ Ordinal -------- either numeric or character data type. Values aretreated as categories with an order or sequence.序數 --------數值的或者字符類型. 有順序關係∙ Nominal ------- either numeric or character data type. Values aretreated as categories with no order or sequence.名目上的 -------數值的或者字符類型. 有類別關係無順序關係The data and modeling types are related as follows:數據和建立模式類型關係Data Type 數據類型NumericCharacter Row StateModeling Continuous Type Ordinal模式類型 NominalThe Modeling Type and Column Roles are displayed and can be changed on the data table as well as in the column info box:模式類型和列角色可以被顯示出來亦可以被改變, 和 “column info” 對話方格相似Modeling Type 建模類型 Column Roles 列角色Column Roles:列角色∙X ---------- independent or predictor variable. (inputs) X---獨立或預測變量.(輸入)∙Y ---------- dependent or response variable. (outputs) Y---反應變量. (輸出)∙Weight --- values are weights for the response variable.權重---反應變量的加權.∙Freq ------ values assign a frequency for each row.頻率---各行的頻率∙Label ----- values specify labels for plotted points.標籤-----用來標示點Entering DataColumn role assignments are optional. If no roles are assigned, you will receive a dialog window each time you want to perform an analysis. The dialog window will prompt you for the X variable(s), the Y variable(s), weights, etc.Column role是可選擇的.如果不指定role, 每次你要利用 JMP作分析時會收到一個對話窗口.對話窗口將要求你對於 X變量(s), Y變量(s),權重,及其他等作指派.Data Source: Specify if a formula is to be used. If a formula is used then the JMP calculator dialog will be provided.數據來源: 可由此看出列資料是否使用公式產生. 此公式會在此對話方格中顯示出. Field Width: Specifies the number of characters that the column will accept. To view the full field width you may need to place the cursor on the column border and click and drag the column width to size.域寬: 可由此看出指定域寬. 可拖動那列寬大小去檢查.Important Note:You may access the “Column info” box anytime by double-clicking on the top of the column between the modeling type and column roles boxes.重要的筆記: 當你重複兩次點列首, 可以得到一個列資料的對話方格Exercise 1: Entering Data into a JMP Spreadsheet練習1: 輸入數據至JMP電子製表軟件Enter the following data into a new JMP spreadsheet by following the steps below:利用下列步驟輸入數據至JMP電子製表軟件1) Create a spreadsheet with four columns and four rows.創造一個四列四行的電子製表軟件2) Label the columns.標示列3) Click and drag the column dividers to the desired field widths.點及拖曳列到希望列寬4) Change the data type of the “Name” column to character.改變“Name”列數據型態使其為字符5) Change the field width of the “Name” column to 15.改變“Name”列fieldwidth到156) Change the Columns Roles box for the “Name” column to “Label”.改變列角色框選項並選label7) Enter a list check on the “Name” column so that only these four namescan be entered.選“List Check” 以防誤寫8) Enter the four names into the spreadsheet using the Ctrl-click feature.用那Ctrl-click輸入那四個名字9) Enter a range check for the “Score” column so that only numbersbetween 0 and 90 are accepted.輸入一個“Score” 檢查範圍為0 – 9010) Change the format of the “Attendance” column to fixed decimal with 2digits after the decimal point.改變“Attendance” 格式. 設定小數點後2位11) Enter the data into the “Count”, “Score” and “Attendance” columns.輸入數據至“Count”, “Score” and “Attendance” 列12) Lock the “Count” column so that data cannot be accidentally changedor deleted.鎖定“Count” 列以防偶然地改變了或者刪除資料Importing Data From Other Applications從別的應用軟體轉載數據There are three ways you can input data into JMP from other applications: 從別的應用軟體轉載數據有三途徑1. SAS Transport Files. These are files in a special format used fortransporting data to and from the SAS statistical analysis system. We will not discuss this method in this course. SAS傳送檔案. 在這課程我們將要不討論這方法.2. Cut-and-Paste. If your data are in a spreadsheet (e.g., Excel):如果你的數據是在一個電子製表軟件(如Excel), 使用剪貼方式.a) In the spreadsheet, use the mouse to highlight the portion of thetable that you want to input to JMP, and copy it to the clipboard.使用滑鼠選取所要表格複製這到剪貼板, 再貼到JMP電子製表軟件b) Close the spreadsheet application, and get into JMP.關閉原始電子製表軟件, 進入JMPc) Create a new file that contains the same number of columns asthe data being copied.開一個新的檔案, 增加與欲拷貝的數據相同的列數d) Highlight the column headers, and paste the contents of theclipboard. The copied data will appear in the JMP table. If a newtable is being created and column labels are to be copied intoJMP, use alt-paste-at-end to put the column labels in the labelposition.利用滑鼠選取列首, 並用貼(Paste)工具貼上欲拷貝的數據. 數據將出現在JMP表上.如果欲將列標簽一同拷貝到新的JMP表格內, 使用alt + Edit/paste at end方式拷貝在JMP表格e) Use the Column Info item on the Cols menu to properly set up eachcolumn’s data and modeling types. (It isn’t necessary to add rows tothe new file.)使用Column Info 去建立列數據狀態和建模類型. (用這方式不需要增加行)Importing Data From Other Applications (continued)從別的應用軟體轉載數據(繼續)3. Import a Text File:匯入一個文件a) If your data are not already in text format, export the data fromthe other application into a text file (*.txt).如果你的數據不是文件格式檔(txt 檔), 先轉為文件檔∙The text file data values can have any delimiter (separator).那文件格式檔數據值能夠有含有任何的定界符號(分隔符號)∙Tabs, spaces, or commas are the most common delimiters.Tabs, 空格, 或者逗號是最常見的定界符號∙The text file can contain column labels as the first line of the file.那文本文件能夠包含列標簽使其為檔案首行.b) Get into JMP. It isn’t necessary to create or format a new file.進入JMP. 不必要開啟或者格式化一個新的檔案c) Use the Import item (Text selection) on the File menu to importthe text file:使用File/Import/Text匯入文件Importing Data From Other Applications (continued)從別的應用軟體匯入數據(繼續)d) Click on “Options” to specify import options:選File/Import/Text/Option項“Data Only” ------- Select this if the text file contains only data (nocolumn labels).文件僅含數據(沒有列標簽), 則選Data Only “Labels” ----------- Select this if the first line of the text filecontains column labels.如果列首含列標簽則選Labels, 則選Labels “JMP Header” --- Select this if the text file being imported wasoriginally exported by JMP如果是JMP文件的匯入, 則選Jmp Header “End of Field” --- Specify the character(s) used to separate datavalues in the text file.詳細說明文件中用來分隔數據值的符號“End of Line” ---- Specify the character(s) used to separate linesin the text file.詳細說明文件中用來分隔行線的符號“Strip Enclosing Quotes” --- Select this if each data value in thetext file is enclosed in quotes.如果文件以是被引用(Quotes), 則選擇“StripEnclosing Quotes”e) If necessary, use the Column Info item on the Cols menu to setup each column’s name, d ata, modeling type, etc.如果必要,使用Cols/Column Info 去設定各列名稱, 數據, 建模類型, 及其他Entering DataExercise 2: Cut and Paste, Import練習2:剪貼,匯入There are two ways to get existing (non-JMP) files of data into JMP.有二途徑得到轉換非JMP檔案的數據到JMP表格Cut and Paste剪貼1. The instructor will demonstrate the cut and paste functions to import datafrom Excel. (You may also use the notepad by double clicking on the file holediam.txt.) You will need to have a new spreadsheet in JMP.To do this Select File, New.用Edit/Cut 和Edit/Paste從Excel轉載數據(holediam.txt檔) 至JMP的示範, 首先要開一個新檔File/New.Import匯入2. Import the file holediam.txt. 匯入holediam.txt 檔案Use the File, Import, Text functions.使用File/Import/TextLot Part EtchTime Mach Bottom Left Right Top 9622_001 1 112 454A 498.17 498.55 499.23 496.13 9622_001 2 112 454A 497.38 499.01 498.82 495.34 9622_001 3 112 454A 498.10 498.48 498.48 495.67 9622_002 1 115 36XL 500.89 502.24 501.51 498.8 9622_002 2 115 36XL 500.80 502.28 501.87 499.31 9622_002 3 115 36XL 500.14 501.78 502.13 498.46 9622_003 1 115 J102 500.60 502.04 501.45 498.89MANIPULATING DATA操作數據(use bigclass.jmp)Once your data are in JMP, it is likely that you will want to manipulate it before you analyze it. This section of the course introduces the various data manipulation features in JMP:有可能你會希望在分析數據對數據前先做一番整理. 這部分的課程介紹JMP不同的數據處理特徵∙Adding Rows and Columns加入行和列∙Search and Replace搜尋和替換∙Selecting and De-Selecting Rows, Columns, and Table Portions選擇和解除選擇行,列,和表格部分∙Including, Excluding, Hiding, and Unhiding Rows and Columns包含, 不包含,隱藏,和解除隱藏行和列∙Row Markers, Colors, and Labels行標記,顏色,和標簽∙Locking and Unlocking Columns, and Data Validation鎖定和解除鎖定列,與數據設定∙Moving and Deleting Rows and Columns移動和刪除行和列∙Table Subset表格子集∙Table Group/Summary表格分組/歸納∙Sorting Rows排序行∙Stacking and Splitting Columns堆疊和分割列∙Concatenating and Joining Files接合檔案∙Transposing the Table轉置表格∙Using the Calculator Function使用計算器功能Adding Rows and Columns加入行和列Rows:行∙Double-click inside the triangular Rows area in the upper-left corner of the data table. Fill in the number of rows to add, and where to add them.按兩下左上角三角形的區域以增加行Double-Click Here在這裡按兩下∙Select Add Rows from the Rows menu. Fill in the number of rows to add, and where to add them.從Rows/Add Rows填寫行數,和在哪裡加入行Entering DataColumns:列∙Double-click inside the triangular Columns area in the upper-left corner of the data table. Fill in the column name, data type, modeling type, etc.Use this to add one new column.按兩下左上角三角形的列區域.填寫那列名稱,數據類型,建模類型,及其他新的列特徵Double-Click Here在這裡按兩下∙Select New Column from the Cols menu. Fill in the column name, data type, modeling type, etc. Use this to add one new column.從Cols/New Column 填寫列名稱,數據類型,建模類型,及其他以加入此一新列Select Add Columns from the Cols menu. Fill in the column name prefix, the number of columns to add, the type of data the columns will contain, where to add the columns, etc. Use this to add several new columns.從列選單選擇Cols/Add Columns 填寫列名稱字首,加列數, 數據類型, 加列到哪裡,及其他. 使用這個對話方格可以加數個新的列Search and Replace搜尋和替換Select Search from the Edit menu, and choose Find. Fill in the value you want to find, what you want to replace it with (optional), whether you want to replace all values, whether to search by row or by column, etc.那從編輯選單選“Search/Find”, 輸入目標值, 替代值, 是否要替代所有值, 行搜尋或列搜尋, 及其他.Note: Search will not look for values in locked or hidden columns, which will be explained later.筆記: 搜索將不尋找鎖定值或者隱藏列,後面再解釋.Rows and Columns行和列(Use bigclass.jmp. Place data set and Y vs X plot of Weight Vs. Height side by side)(使用bigclass.jmp.)Selecting and De-Selecting Rows, Columns, and Table Portions選擇和解除選擇行,列,和表格部分Rows:行∙In the data table, drag the mouse cursor across the range of rows.在數據表格,拖動滑鼠游標選則一個範圍的行∙Shift-click the first and last rows you want to select (contiguous selection).使用Shift+click來選擇第一個行及最後一個行(毗鄰的選擇)∙Control-click individual rows (discontiguous selection).使用Control+click選擇不連續的行(不接觸的選擇)∙While viewing a graph, click or select points or bars in the graph.當觀察一個圖時, 在圖上點選圖點或barsNote: To find the selected rows in a large data set,use Rows Locate Next or Locate Previous.筆記: 如要在一個大量數據集內找到所選的行資料, 可使用Rows/Locate Next或者Rows/Locate Previous∙To select rows based on the value(s) of a certain column, use the Select item (Where) on the Rows menu:若要對特定的列值作行的選擇, 使用功能選單Rows/Select item(where)◊Choose the column whose values will be used to select the rows,選擇那一個列的值要做選擇的指標◊Choose the selection criterion (e.g., equals, less than, greater than, etc.),定出選擇標準(e.g.,相等的,小於, 大於, 及其他.)◊Fill in the selection value (may be character or number, depending on the type of data in the chosen column).填寫選擇標準(可以是字符或者數字, 依選擇標準類型而定)Columns:列:∙In the data table, drag the mouse cursor across the range of columns you want to select.在數據表格,拖動滑鼠游標到選擇的範圍∙Shift-click the first and last columns you want to select (contiguous selection).同時按下Shift並選第一及最後的列(毗鄰的選擇)∙Control-click individual columns (discontiguous selection).同時按下Control 並任意選(不連續的選擇)Table Portions:表格部分∙ A rectangular portion of a table can be selected simply by dragging the mouse cursor over the cells that you want to select. This will highlight the corresponding row and column headings. 表格單元部分的選擇可簡單地靠拖動滑鼠游標選取. 被選部分的行和列頭標會有反白.Deselecting Rows and Columns:解除選擇行和列∙Click inside the triangular Rows area in the upper-left corner of the data table to deselect all rows. Do the same in the Columns area to deselect all columns.點左上角三角形的部分去取消行或列的選擇Click HereInverting Row Selection:轉置行∙You can reverse a row selection by choosing Invert Selection on the Rows menu.你能夠使用功能選單的Rows/Invert selection去轉置行Including, Excluding, Hiding, and Unhiding Rows and Columns包含,不包含, 隱藏和解除隱藏行和列Definitions:定義∙Excluded Row: The data will not be included in the analysis, but will appear on all graphs. Rows/Excluded行: 數據將不會納入分析, 但是會出現在圖表上∙Hidden Row: The data will be included in the analysis, but will not appear on any graph.Rows/Hidden行: 數據將不會出現在圖表上, 但是會納入分析∙Hidden Column: Will not appear in the data table, but it is not removed from the file, so it can still be used in analysis or graphs.Cols/Hide Columns列:將不會出現在那數據表格中, 但是仍存在檔案中, 仍然可用來分析或者繪圖Rows:行∙To exclude rows, first select the rows you want to exclude, then choose Exclude/Include from the Rows menu. (Excluded rows are marked witha symbol in the data table.)欲Exclude行, 首先選擇那幾行你不想用來分析數據. 選擇Rows/Exclude (Excluded之行在那數據表頭有記號.)∙To hide rows, first select the rows you want to hide, then choosefrom the Rows menu. (Hidden rows are marked with a首先選你想隱藏的行, 再從功能選單選擇Rows/Hide. (∙by selecting the rows and choosing the appropriate item from the Rows menu.若要對Excluded (or hidden) rows恢復Including (or unhiding) 的動作時, 可從功能選單Rows 中再選一次Columns:列∙To hide columns, first select the columns you want to hide, then choose Hide Columns from the Cols menu.隱藏列的方法, 首先選你所要隱藏的列, 再從功能選單中選擇Cols/hide∙To unhide columns, choose Unhide from the Cols menu, and specify which columns you would like to unhide.取消隱藏列的方法, 選擇Cols/Unhide, 並詳細說明哪一個列你想取消隱藏Manipulating DataRow Markers, Colors, and Labels行標記,顏色,和標籤Colors and Markers:顏色和標記If you want one or more rows to have a different point color on graphs (default color is black), select the rows and choose Colors from the Rows menu. A color palette will appear, allowing you to choose the color for the selected rows. (Colored rows are marked with a colored dot in the data table.)如果你想在圖上用不同的顏色代表不同的行資料 (預設值的顏色是黑色),選擇欲標示的行, 然後選 Rows/Colors. 會出現一個色板, 供你選擇顏色. (選後 Rows’ head會產生點記號.)If you want one or more rows to have a different point style on graphs (default style is a dot), select the rows and choose Markers from the Rows menu. A marker palette will appear, allowing you to choose the point stylefor the selected rows. (Row markers are displayed on the data table.)如果你想要一個或者更多行有不同的標記點樣式(預設值樣式是一點狀), 先選擇欲標記的行, 然後選Rows/Markers. 會有一個標記板出現, 允許你到選擇標記點樣式. (選後Rows’ head會有一標記點記號.。
jmp应用实例
jmp应用实例全文共四篇示例,供读者参考第一篇示例:jmp是一种流行的应用程序,它可以帮助用户在手机上管理和优化他们的电子设备。
它提供了许多功能,包括清理垃圾文件,加速手机,管理应用程序和更多。
在这篇文章中,我们将介绍jmp的一些实际应用实例,帮助读者更好地了解这个应用程序的功能和用途。
jmp可以帮助用户清理手机内存中的垃圾文件。
随着时间的推移,手机会积累大量的临时文件、缓存文件和其他不必要的数据,这些文件会占用宝贵的存储空间并降低手机的性能。
通过使用jmp,用户可以轻松地扫描并清理这些垃圾文件,从而释放存储空间并提高手机的运行速度。
jmp还提供了一个强大的应用程序管理功能。
用户可以使用jmp查看所有安装在他们手机上的应用程序,并对这些应用程序进行分类、排序和卸载。
这对于那些喜欢尝试新应用程序的用户来说特别有用,他们可以通过jmp快速找到和管理他们的应用程序,而不用在手机上浪费时间搜索。
jmp还具有一个强大的手机加速功能。
通过定期扫描手机,并优化系统设置和运行程序,jmp可以帮助用户加速手机的运行速度,减少卡顿和延迟。
这对于那些使用老旧手机或者运行速度较慢的设备的用户来说尤为重要,他们可以通过使用jmp来提升手机的性能和响应速度。
除了上述功能之外,jmp还提供了许多其他有用的工具和功能,例如文件管理、电池管理、网络加速等。
jmp是一个功能强大、易于使用的手机优化工具,可以帮助用户更好地管理和优化他们的设备。
在日常生活中,jmp的应用实例也是非常广泛的。
一位手机爱好者每天安装大量的新应用程序,但是发现手机性能越来越慢,这时他可以使用jmp来清理垃圾文件、优化手机,提升设备的性能。
又一个经常旅行的商务人士需要保持手机在任何时间都能够高效地运行,他可以使用jmp来定期清理垃圾文件、管理应用程序,确保手机的流畅性和稳定性。
第二篇示例:JMP是一种广泛使用的数据分析和数据可视化工具,它可以帮助用户更好地理解和分析数据。
JMP操作参考表
特殊功能
命令
Windows 在某些报表中,将命令应 用于该报表中的所有相似 图形 选择或撤消选择分布直方 图中的条形柱 选择或撤消选择 Pareto 图中不相邻的条形柱 选择 Pareto 图中一定范围 内的相邻条形柱 选择不相邻的列 选择多个报表选项 按住 Ctrl 并单击红 色三角形图标菜单 中的命令 按住 Shift 并单击条 形柱 按住 Ctrl 并单击条 形柱 按住 Shift 并单击范 围外部的条形柱 按住 Ctrl 并单击每列 按住 Alt 并使用鼠 标右键单击蓝色菱 形图标 按住 Shift 键并单击 该范围内的第一列和 最后一列
↑和↓
使用 Tab 键可以将 高亮区移至右侧单 元格的内容。按住 Shift + Tab 将移至 左侧。 键盘上的 Return 和 Enter,键区上的 Enter F2 F3 Ctrl + 加号 (+) 号 Ctrl + 减号 (-)
↑和↓
使用 Tab 键可以 将高亮区移至右 侧单元格的内容。 按住 Shift + Tab 将移至左侧。 键盘上的 Return 和 Enter,键区上 的 Enter 不适用 不适用 + 加号 (+) + 减号 (-)
快捷方式
Macintosh 按住 并单击红色 三角形图标菜单中 的命令 按住 Shift 并单击条 形柱 按住 并单击条形柱 Linux 访问核心平滑器 按住 Ctrl 并单击红色 三角形图标菜单中的 命令 按住 Shift 并单击条 形柱 按住 Ctrl 并单击条 形柱 按住 Shift 并单击范 围外部的条形柱 按住 Ctrl 并单击每列 同时按住 Shift 和 Alt 并使用鼠标右键单击 蓝色菱形图标 按住 Shift 键并单击 该范围内的第一列和 最后一列 在二因子交互最小二 乘均值图中转置因子 在保存均值或单个置 信区间时指定 alpha 水平 为 WeiBayes 分析指 定 beta (适用于 Weibull)或 sigma (适用于对数正态) 参数 创建 SAS 任务
- 1、下载文档前请自行甄别文档内容的完整性,平台不提供额外的编辑、内容补充、找答案等附加服务。
- 2、"仅部分预览"的文档,不可在线预览部分如存在完整性等问题,可反馈申请退款(可完整预览的文档不适用该条件!)。
- 3、如文档侵犯您的权益,请联系客服反馈,我们会尽快为您处理(人工客服工作时间:9:00-18:30)。
分析
• 流程能力diag1.jmp 数据包含以下特征:
– 数据正态 – 5个一组的SPC基本正常 – Max=85.752,Min=56.749
若将LSL=57、USL=80以及LSL=57、USL=86分别输入看流程能力 • JMP缺省显示长 期能力,尽管显 示出的是Cpk
•
分组若非连续采集(比如每周4算一组 等),可在上方“分组依据”里选类 似Subgroup(此时Subgroup算属性)。
属性R&R—利用JMP
打开:“属性MSA.jmp”
分析质量和过程变异性/计数量具(多元控制图) 图表类型选“计 数”,而非“变异 性”。
必须每个测量员1列
21
Copyright © 2008 QualiSys Consultancy Services
属性R&R—利用JMP
上方图示反映每个样本的 测量一致性。此处每个操 作员自身的一致性算法与 MINITAB不同。 重点解释下方的Kappa值 (算法同MINITAB)
成对t检验
利用软件检验两个相关的样本是否相等
两个相关的样本必须是随机抽取的 每个抽样总体都应该大致呈正态分布
统计 > 基本统计量 > 配对 t
31
Copyright © 2008 QualiSys Consultancy Services
练习
一轮胎公司认为他们新生产的轮胎的里程数 较竞争者的有提高。选择了12部车,用新轮
练习
开启档案 相位差.jmp
分别利用前三栏位的资料制作 Normal Plot
哪一组趋近于正态?
再分别制作直方图 (Histogram)
这其中透露了什么?
1
Copyright © 2008 QualiSys Consultancy Services
认识数据的分布
2
Copyright © 2008 QualiSys Consultancy Services
e) 比较P值和重要水平: P-value = 0.798,> = 0.05 所以我们不能否定零假设。 数据不能提供足够的证据否定平均强度等于2.85磅。
25
Copyright © 2008 QualiSys Consultancy Services
正态检验
我们首先使用Shapiro-Wilk W检验评估正态分布。 统计 > 基本统计量> 正态性检验
流程能力分析
数据Camshaft.mtw (Minitab 工作表)
凸轮轴由机床削切 数据在第3列(Supp2) 规格是 600 ± 5 凸轮轴生产的子群大小为1 流程能力如何?
14
Copyright © 2008 QualiSys Consultancy Services
流程能力分析步骤
22
Copyright © 2008 QualiSys Consultancy Services
属性R&R—利用JMP
2228=78.5714%
23
Copyright © 2008 QualiSys Consultancy Services
JMP里不管Z检验还是t检验,只看“均值检验”
目标值
练习
请打开QUALITY CONTROL.jmp, 里面的Flows是瑕疵的类型,右侧记 录了瑕疵“发生的时刻”。 这组数据没有直接提供瑕疵计数。 所以要用“X分组”来区隔。
5
Copyright © 2008 QualiSys Consultancy Services
JMP里的柏拉图
练习
JMP会以第一个“发生时刻”值 的瑕疵多少排列顺序作为不同时 刻分隔的基准,并可自行调整。 于是,可以观察各种瑕疵在不同 “作业时刻”的具体数量分布。
P值=0.6806>0.05,服从正态。
26 Copyright © 2008 QualiSys Consultancy Services
P值
d) 计算P值:分析 > 分布 > 均值检验
单样本 T: Thickness mu = 3 与 ≠ 3 的检验
平均值 变量 N 平均值 标准差 标准误 95% 置信区间 T P Thickness 18 3.00294 0.00310 0.00073 (3.00140, 3.00448) 4.04 0.001
99 95 90 80 70 60 50 40 30 20 10 5 1 0.1
Mean StDev N AD P-Value
10.06 0.9933 500 0.242 0.771
Percent
Percent
0.06
0.07
0.08
0.09
0.10 D3
0.11
0.12
0.13
0.14
6
7
8
9
10 D3-T
若数据非正态,点选“非参数检验”
24
Copyright © 2008 QualiSys Consultancy Services
分析输出
单样本 Z: force mu = 2.85 与 ≠ 2.85 的检验 假定标准差 = 0.100492
平均值 变量 N 平均值 标准差 标准误 95% 置信区间 Z P force 49 2.8463 0.1005 0.0144 (2.8182, 2.8745) -0.26 0.798
11
12
13
14
17
Copyright © 2008 QualiSys Consultancy Services
非正态数据的流程能力计算
非正态数据,直接在
“连续拟合”里观察全 部分布的“对数似然”,
JMP会自动给出最合适
的“分布形态”。
将该分布形态代入
D3“能力分析”即可。
18 Copyright © 2008 QualiSys Consultancy Services
因I-MR数据基于正态分 布,所以“移动极差”
只有超限点
8
Copyright © 2008 QualiSys Consultancy Services
X-Bar 分组均值范围图
打开文件 SPC-X.jmp, 看X-Bar 分组均值范围图 若无GROUP列,则在此 输入组内个数
9
Copyright © 2008 QualiSys Consultancy Services
SPC稳定性检查, 对异常点作出处理。 正态检定。如果数 据非正态,需做拟 合转换。 执行流程能力分析。
所以,建议JMP先
从“分析>分布” 开始逐步推进分析。
15
Copyright © 2008 QualiSys Consultancy Services
JMP里的“Z基准”反映出流程的西格玛水平
Probability Plot of D3
Normal - 95% CI
99.9 99 95 90 80 70 60 50 40 30 20 10 5 1 0.1
Probability Plot of D3-T
Normal - 95% CI
99.9
Mean StDev N AD P-Value 0.1004 0.01021 500 2.628 <0.005
胎跑1000哩,再用竞争者的轮胎跑1000哩 。
假定里程的差异服从正态分布。
File: Car Mileage.jmp
32
Copyright © 2008 QualiSys Consultancy Services
练习
验会如何?
试试单样本 t 检验其中的差异。
选项 / 信息屏 –用JMP
打开 连续性MSA.jmp
19
Copyright © 2008 QualiSys Consultancy Services
JMP输出
方差32.66%, 希望小于8%
独立分类数=4, 希望大 于5
20
Copyright © 2008 QualiSys Consultancy Services
X-Bar 分组均值范围图
10
Copyright © 2008 QualiSys Consultancy Services
练习
• 打开P-CHART.jmp,反映了一段时间内被 检验产品的不良数,其中分母不尽一致。 • 当然,若分母一致,可自行输入样本常数。
11 Copyright © 2008 QualiSys Consultancy Services
y
JMP分析前必须先做 数据表的堆叠转换
28 Copyright © 2008 QualiSys Consultancy Services
双样本t
d.) JMP计算P值 针对已“堆叠”好的新数据表:分析 > 以X拟合Y > 勾选 “假定等方差”
29
Copyright © 2008 QualiSys Consultancy Services
长期Sigma水平
短期Sigma水平
注意,这里的长短期有1.5的水平位移。看来,是按照
MOTOROLA的观点去表现的。
16 Copyright © 2008 QualiSys Consultancy Services
非正态数据的流程能力计算
特性不清楚的分布
利用BOX-COX转换,转换成正态分布 案例分析: 打开文件BOX-COX.JMP,其中的D3数据,规格为 LSL=0.06,USL=0.15,请计算流程能力。