雅思图表写作线图
雅思小作文各种图题、表格题技巧总结
雅思小作文各种图题、表格题技巧总结雅思作文Task 1受图表内容的限制,遣词造句的要求非常有限,只需针对考试,把核心表达用准用熟即可,所谓博大不如精深。
下面是威学教育雅思教研组总结的雅思小作文线图题、柱形图题、饼图题、表格题以及流程图等的写作总结!线图、柱状图、饼图,表格题介绍段introduction介绍段内容几乎完全不用创新,就是对题目文字部分的第二段做改写,paraphrase the rubric.所谓改写,要么换词,要么换句式。
例如:(I4-100)The charts below give information about travel to and from the UK and most popular countries for UK residents to visit.换词(1) 图 The charts图:chart, graph(雅思写作中完全等价,无差别)线:line / curve chart柱图:bar / column graph饼:pie chart表:table / statistics / figures(2) 动词“表明”give information about介绍段是客观描述,用一般现在时态,give information about 虽然在这篇作文中最好不再用,但是informal learning,随手学到的东东,留作其它文章再用。
替换的词语和结构很多,比如我常用的show /illustrate / demonstrate/compare,大家也可以选几个自己喜欢并且拼写准确的形成风格。
第二段其余部分的替换因题而异,比如travel换成visitthe UK换成Britain(注意不是England,英格兰只是Britain的一部分)popular换成fashionablecountry换成nationUK residents to visit换成UK tourists不过随着练习作文数量的增加,你会惊喜的发现,雅思图表作文,连描述的对象都是类似的。
IELTS Line graph 雅思小作文 曲线图解析

at 数据 at 时间点.
第2页/共39页
重点句型
• 有波动但总体上升,之后下降 • From then on, it generally maintained
第17页/共39页
方法2
• 第一步: 时态----过去时 现在时 将来时 • 第二步: 观察规律 • 1. 都大幅上升 • 2. 美国和瑞典前50年基本完全相同 • 3. 90年后,美国和瑞典分道扬镳,应该分别来写 • 4. 日本的变化完全不同,应该单独占一段 • 第三步:首尾各一段,美国和瑞典一段,日本一段,共四段
an upward trend until the peak( about 数据) was reached at 时间点, in spite of some small fluctuations. • However, after that there was a slump in the percentage, and it continued until 时间点 when the number reached
重点句型
• 先下降再上升,之后下降并持平 • However, 对象 first experiences a gradual decline from 数据 at 时
间点 to 数据 at 时间点, which is the lowest in the day, and then a steady climb, back to its peak of 数据 at 时间点. In contrast to 比较 的对象, 对象 decrease slightly and almost level out for most of the evening, with a peak (nearly 数据) at 时间点.
雅思图表作文-线图

Dubai Gold SalesThe line graph shows estimated sales of gold in Dubai for 12 months in 2002 in millions of dirhams. There were two main seasons for gold sales.The main season for sales is in the December to May period. Saleswere consistently above 200 million dirhams per month, rising sharply to a peak of 350 million dirhams in March. However, for the next four months, sales declined steadily,reaching an annual low of 120 million dirhams in July.In August, there was a sudden increase. Sales almost doubled, rising from 120 million dirhams in July to 210 million dirhams in August. This was followed by a drop in September, the July figure.From September to October, sales recovered, from 120 to 180 million. In October and November, sales r emained steady, and there was a small increase in December to 190 million dirhams.In conclusion, the main sales period is in the early part of the year, slumping in the summer, except for a sudden increase in August.Dubai Tourism, 1990-1994The graph shows the numbers of tourists in hundreds of thousands visiting Dubai between 1990 and 1994. There are several features in the graph.First of all, the total number of tourists increased rapidly between 1990 and 1994. In 1990 there was a total of 450,000 tourists in Dubai. This rose sharply to 625,000 in 1991, an increase of more than 30%, and rose slightly again to just under 700,000 in 1992. In the following two years, the number of visitors started to pick up again and reached 1 million in 1994. This was more thandouble the figure for 1990.The second trend is that there was a huge increase in the number of tourists from Russia. In 1990, Russian tourists comprised only 20,000 or less than 5% of visitors. This number shot up to 50,000 in 1991 and doubled again to more than 100,000 in 1992. Between 1992 and 1994, the number trebled, from 110,000 to 330,000. This meant that Russian tourists made up one-third,or 33%, of Dubai’s 1 million visitors in 1994. In comparison, the number of tourists from other countries increased only slightly, from 550,000 in 1991 to 580,000 in 1994.In conclusion, although the number of tourists from all countries is increasing, Russian tourists are becoming more and more important for the tourism industry in Dubai.North American Fish CatchesThe graph shows changes in fish catches for the US and Canada over the last 30 years.The most significant feature is that fish catches have declined drastically in both the US and Canada since the mid-1980s. Although Canadian production is much lower, its echoes US figures, declining or increasing at the same rate.Between 1972 and 1977, US fish catches averaged between 2.5 and 2.75 million tonnes per year, while Canadian landings fluctuated between 800,000 and 1.1 million tonnes. In 1997, however, there was a big increase in fish caught in the US, and this rise continued up to a peak of 5.5 million tonnes in 1987. During the same period, Canada’s catch increased from 1 million tonnes to 1.5 million tonnes, an increase of 50%.From 1987 onwards, there was a sudden decline in both countries. US figures tumbled to 4 million tonnes in 1995, a drop of 28%, and Canadian catches plunged to 0.5 million tonnes, a drop of 66%. In the following four years, US catches fluctuated around the 4 million tonne mark, while Canadian catches rose very slightly.In general, both Canadian and the much larger US catch have declined dramatically since their peak in the mid-1980s.。
雅思剑桥官方范文之线图
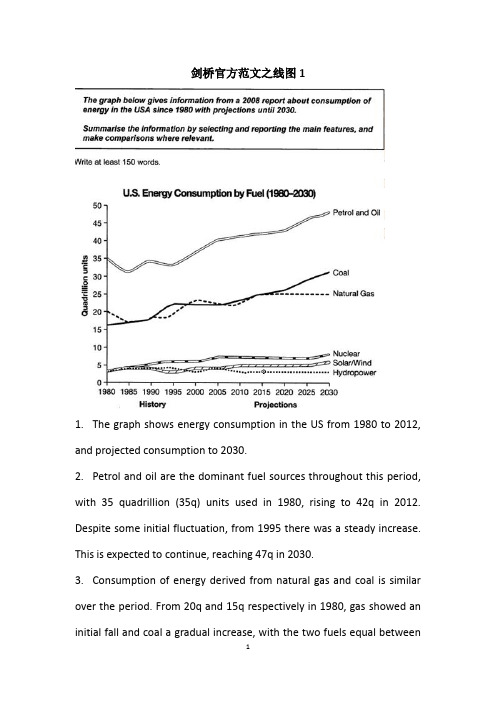
剑桥官方范文之线图11.The graph shows energy consumption in the US from 1980 to 2012, and projected consumption to 2030.2.Petrol and oil are the dominant fuel sources throughout this period, with 35 quadrillion (35q) units used in 1980, rising to 42q in 2012. Despite some initial fluctuation, from 1995 there was a steady increase. This is expected to continue, reaching 47q in 2030.3.Consumption of energy derived from natural gas and coal is similar over the period. From 20q and 15q respectively in 1980, gas showed an initial fall and coal a gradual increase, with the two fuels equal between1985 and 1990. Consumption has fluctuated since 1990 but both now provide 24q. Coal is predicted to increase steadily to 31q in 2030, whereas after 2014, gas will remain stable at 25q.4.In 1980, energy from nuclear, hydro-and solar/wind power was equal at only 4q. nuclear has risen by 3q, and solar/wind by 2. After slight increases, hydropower has fallen back to the 1980 figure. It is expected to maintain this level until 2030, while the others should rise slightly after 2025.5.Overall, the US will continue to rely on fossil fuels, with sustainable and nuclear energy sources remaining relatively insignificant.剑桥官方范文之线图21.The graph illustrates changes in the amounts of beef, lamb, chicken and fish consumed in a particular European country between 1979 and 2004.2.In 1979 beef was by far the most popular of these foods, with about 225 grams consumed per person per week. Lamb and chicken were eaten in similar quantities ( around 150 grams), while much less fish was consumed (just over 50 grams).3.However, during this 25-year period the consumption of beef andlamb fell dramatically to approximately 100 grams and 55 grams respectively. The consumption of fish also declined,but much less significantly to just below 50 grams, so although it remained the least popular food, consumption levels were the most stable.4.The consumption of chicken, on the other hand, showed an upward trend, overtaking that of lamb in 1980 and that of beef in 1989. By 2004 it had soared to almost 250 grams per person per week.5.Overall, the graph shows how the consumption of chicken increased dramatically while the popularity of these other foods decreased over the period.。
雅思作文——线状图

A. Chart 1. Pie chart 2. Line Chart 3. Bar Chart B. Table C. Process
总分结构 总:替换标题 分:整体特征 细节 - 抓住特征项 -合并同类项
2. Line Chart:
Line Chart 1. Environment
改变句式结构
用代词(线图是一个数据不停变化,可以用代词)
用 before / after 连接 Prices rose for two years, before dropping again in 1992 After a slight drop, there was a steady price rise.
线图核心:趋势
Model 1
The graph shows the bird population in Europe, measured in million, from years 1977 to 2001, in threeyearly intervals. Overall, the graph shows the population decreased over time. In 1977, the population was 120 million birds. This increased to a peak of about 126 million in 1980, and then dropped sharply over the next six years to approximately 98 million in 1986. It then rose significantly to about 112 million in 1989. It fell sharply over the next three years to about 95 million in 1992 and remained relatively stable after that at between 96 and 90 million birds. The graph shows a trend of a gradual decrease in the number of birds since 1995.
雅思写作-小作文范文-线图
线图C5T1原题The graph below shows the proportion of the population aged 65 and over between 1940 and 2040 in three different countries.Summarize the information by selecting and reporting the main features, and make comparisons where relevant.The graph shows the increase in the ageing population in Japan, Sweden and the USA. It indicates that the percentage of elderly people in all three countries is expected to increase to almost 25% of the respective populations by the year 2040. In 1940 the proportion of people aged 65 or more stood at only 5% in Japan, approximately 7% in Sweden and 9% in the US. However, while the figures for the Western countries grew to about 15% in around 1990, the figure for Japan dipped to only 2.5% for much of this period, before rising to almost 5% again at the present time.In spite of some fluctuation in the expected percentages, the proportion of older people will probably continue to increase in the next two decades in the three countries. A more dramatic rise is predicted between 2030 and 2040 in Japan, by which time it is thought that the proportion of elderly people will be similar in the three countries.分析:题目The graph below shows the proportion of the population aged 65 and over between 1940 and 2040 in three different countries.第一段The graph shows the increase in the ageing population in Japan, Sweden and the USA.•作者没有一上来提示图表内容,而是直接奔向中心思想,也就是文章的主旨句。
雅思线形图
这张桌子是那张桌子的三倍大。 ❖ This table is 3 times as big as that one. ❖ This table is 3 times bigger than that one. ❖ This table is 3 times the size of that one. ❖ The size of this table is 3 times of that one. 今年的产量是2006年的3倍。 The output of this year is 3 times what it
3.大约,估计:
about,around, roughly, in the rough, in the neighborhood of, approximately, or thereabout, just over…, just under…, …or so, 例:around / roughly / approximately 20
was in 2006.
倍数高级表达法:
(1)…是原来的…倍:数字 + -fold (2)…增长或者下降了…倍: 数字-1 + -fold
…shows / experiences / witnesses/ undergo a three-fold increase / rise / decrease / reduction
1. 字数 2. 单词拼写,不要缩写 3. 单位 4. 时态 (开头段永远是一般现在时) 5. 语法错误:主谓一致,缺少或者多余谓
语,没有连词等
雅思小作文---TASK1图表题
雅思小作文 T A S K 1 图表题规律注意事项:1 . Task1 是客观写作,要求客观真实。
2 . 客观性:不应该有任何图里没有而靠自己主观想象加入的成分。
结尾段针对图形做出的总结性结论也应该是根据图表的实际内容做出的符合逻辑的总结。
准确性:图表里面的数据介绍要力求精确,不能抄错数字。
但当一个特征点没有落在一个准确的坐标值上时,允许进行合理的目测或估计一个大概数值。
详尽性:要有层次感,并不需要把所有的数字都推到文章里。
3 . 类型Table 表格题Line Graph 线图Bar Chart 柱状图Pie Chart 饼状图Process Chart 流程图4 . 看图要注意单位,标题和图例。
5 . 对于多数小作文题,题中给出了几个图就对应的写出几个主体段。
题目里只给出一个图,根据图中包含几类图形元素写几个主体段。
图中只给了一个图,但图中所含图形元素很多,则分类。
题目中出现多线多柱多饼,用“对应提取法“,把每组里的对应元素提出来组织主体段。
6 . 时态和发生时间意义对应。
陈述永恒事实的句型,其主句的谓语动词必定用一般现在时。
若题目里没有出现时间,则全文都使用一般现在时。
7 . 结构开头段(1~2句)改写原题主体段1 总体概括具体介绍数字主体段N 总体概括具体介绍数字结尾段(1~2句)介绍总数(若图里并没有明确的给出总数,则省略)结论(根据图里的数据得出有一定合理性的结论)8 . 开头段的改写题目中ShowProportion InformationThe number/amount of FamilyMalesFemaleInfluence改写成illustrate /compare percentagedatathe figure for householdmenwomenaffect/effectCategories kinds/typesSubway system Storeunderground railway/train system shop9 . 介绍数据或描述变化趋势的常用词。
雅思小作文范文-线图
1. The proportion of male and female smokers in Someland from 1960 to 2000.1. 两条线,建议每条线一段;2. 每条线的描述请参考经典折线写法(在数据库里有,详见《单线指导写法》);3. 关键性数据不可少,如最大值,最小值等;4. 本文用到了线段之间的对比关系,如文中的: 6 times of 和smallest difference with,这些都是加分项The chart compares the rate of smoking in men and women in Someland between 1960 and 2000. Overall, the proportion of smoking for both is currently declining and fewer women smoked throughout the period.Initially, the peak of male rate was reached in 1960, when it was 600 in every 1000, over 6 times of that of females. This number then decreased gradually to 500 by 1975 and continued to decrease but more steeply to 250 by 2000, which had the smallest difference with the level of women.Oppositely, the rate of smoking in women in 1960 was the lowest at only 90 in every 1,000. By 1965 this increased to 180, followed by a sharper rise to 320 by 1975. The rate of female smokers then remained stable at 320 until 1980 at which point the figure began to decline and ended up at 200 by 2000.In conclusion, the rate of smoking in men dropped straightly throughout the whole period while the figure of women smokers went through a fluctuation.(172)2. Radio and television audiences throughout the day in 1992.以下是6分, 7分和9分范文,可以看出,上6分的文章都有一个共性,就是没有大的语法错误,分段合适,表达清晰,且进行适当的词汇替换。
雅思小作文各类图表写法汇总
雅思小作文各类图表写法汇总1、line graph线图要注意分段。
尤其是多条线,如果放在一起描述,很容易混乱。
所以建议还是分开来描述,主要原则是仅看描述就能画出图线。
一般而言,是按时间,除了结合时间还要看走势上的分段,大段的描述不可缺;另外就是最高点和最低点,以及拐点的数字以及时点描述。
只有具备了这两点,才能画出图线的走势。
对于不同线之间的比较,可以在最后一段进行,利用交点进行分段。
2、Bar chart柱状图,同样的,要注意分组。
尤其是多国家、多年分之间的比较,建议考生根据最大的特点分成两组(最多三组),然后分组(一组一段)进行叙述。
此类图中,可以少用数据,可以动态的方式进行描述,同时可以利用排名来叙述特点。
描述完特点后,如果图表较为简单,最后一段可以把每项的最高、最低点写一下。
如果类别少(2个),还是分别进行描述比较清晰。
无论了line graph 还是bar chart 尽量以单项从头至尾的描述为首选(这样清晰明了),中间穿插一两次对比,或者最后对比。
(但这种描述方式只适合于比较的项目少的情况,即只是两者之间的比较。
类别一旦多,如果是可以归为两类的情况,则也可以采用这种描述方式,否则不适用)3、Table表格也可以分为动态描述和静态描述。
动态:即为紧跟一个国家,从头到尾描述完所有特点,然后再描述另外的国家。
静态是:每个特点就每个国家分别描述。
无论以上两种采用哪一个,都应当注意分组,尤其是在国家和特点过多的情况下,分组描述,可以减少字数。
对于明显的两类,建议采用动态描述法,因为它们在每一项特点下都具有相似的规律,这样比较明晰。
两个图表的写作:一般分为两段,分别进行描述。
如果其中一个图特别简单,可以用最后一段简单描述,如果两个图表差不多复杂就采用1:1的比例,分别对各自特点进行描述,然后在最后一段将两者进行联系和比较。
雅思写作4、Pie饼图建议不要按一个一个饼来描述,而是根据饼中的信息进行分组描述,同样的注意动态描述和最值,这里不多加赘述了。
- 1、下载文档前请自行甄别文档内容的完整性,平台不提供额外的编辑、内容补充、找答案等附加服务。
- 2、"仅部分预览"的文档,不可在线预览部分如存在完整性等问题,可反馈申请退款(可完整预览的文档不适用该条件!)。
- 3、如文档侵犯您的权益,请联系客服反馈,我们会尽快为您处理(人工客服工作时间:9:00-18:30)。
复习
Writing Skills
问题:
2、主体段表示趋势的动 词有哪些?
上升-下降-不变-波动 (见 P215, P218 趋势图)
8
② 表示趋势的短语-动词(熟记):
数字趋势动词
趋势动词替换
1.上升趋势: rise, go up,
2.下降趋势: fall, sink, drop, dip, reduce, go down
② Numbers in the following two hours level off at just under 300 people.
⑴ 站上哪点。。。 ⑵ 在哪个时间段保持不变。。。
17
回顾使用过的句型
描述波动
① As we can see from the line graph, the number of people using this station fluctuates over these 16 hours.
② The next two hours experiences/ witnesses/ saw a sharp rise again, with 6 pm arriving at 380 people.
( 在哪段时间。。。)
15
回顾使用过的句型
描述下降
① From this point onwards, the number plunges to only 100 from 2 pm to 4 pm.
② After 6 pm, the number falls again, reaching the lowest point of 130 at 8 pm.
( 从哪儿/何时起。。。)
16
回顾使用过的句型
描述不变
① At first at 6 am the number of people at the station stands at only 100.
5
复习
Writing Skills
问题:
1、主体段表示时间推移 的短语有哪些?
6
① 表示时间推移的短语(熟记):
At first, (=initially) Then, After that, From this point onwards, Finally (=eventually) …
(不要老是使用 at 6 o’clock, at 8 o’clock 来开始一个句子。)
② 表示分别的副词是 respectively。
11
复习
问题:
Writing Skills
4、主体段表示趋势的其 他动词有哪些?
最高点最低点达到多少占多少预测多少 -
12
② 表示趋势的短语-其它(熟记):
1.最高点: peak at, reach the highest point at,
2.最低点: bottom out at, reach the bottom at, the lowest point at
PPT 编写:胡宇斌
雅思英语
●写作篇
CMA Training Centre
1
温故知新
WRITING Skills
图表题 写作
2
图表5种类型
表格 Table
线图(直线/曲线) Line graph
柱状图(条形图) Bar chart
饼图 Pie chart
流程图while reviewing the old
3
第三讲
WRITING Skills
线图 写作
4
线图主体段写作要点
理解主题,比较差异; 看清趋势,找出极点; 若有交叉,点出说明。 →P226 例题12
注: (可写的地方。)
图表中最高点和最低点都要单独说明。 曲线的连续变化需要说明。 对图表中多条曲线的交叉点进行对比。 考题多为双曲线和三曲线( The graph compares…) 对单曲线的准确描写是基础(The graph shows…)
3.达到多少(量): reach, arrive at, amount to, hit, stand at
4.预测(会有)多少: predict, expect, forecast 句型为: A is predicted/ expected/forecasted to reach…
13
线图主体段写作
3.保持不变: remain steady, show no/little change
4.波动: fluctuate
1.上升趋势: increase, grow, climb, ascend ( jump, surge, soar, shoot up )
2.下降趋势: decline, decrease, descend ( plunge, slump)
② The period from 8 pm to 10 pm sees a slight rise, but finally the number of people declines again from 180 at 9 pm to 135 at 10 pm.
3.保持不变: level off/out at, hover at, stabilize at, reach a plateau at
9
复习
Writing Skills
问题:
3、主体段表示趋势的形 容词/副词有哪些?
速度快-速度慢-幅度大-幅度小
10
② 表示趋势的短语-形容词(熟记):
1.速度快: sharp, rapid, dramatic, drastic 2.速度慢: gradual, slow, steady, gentle 3.幅度大: significant, substantial, marked 4.幅度小: slight, modest, moderate 注意: ① 以上加 ly 均为副词。
认真阅读P226主体段范文。 总结表示升降、平稳、波动以及最高点和 最低点的句型。 注意数据的表达,放置的位置。
14
回顾使用过的句型
描述上升
① The period between 10 o’clock and 12 o’clock saw a slight growth in the number of people in the station, with the number reaching 280 at midday.