IPMITOOL自动化测试参考手册
ipmitool工具常用命令汇总

ipmitool工具常用命令汇总目录1.工具的安装 (3)2.命令的help (3)3.查看管理口的IP地址 (5)4.管理底盘chassis配置 (6)4.1查看底盘配置汇总 (6)4.2管理电源 (6)4.3管理时间间隔 (7)4.4管理电源恢复策略 (7)4.5查看上次重启原因 (7)4.6查询上电时间 (8)4.7管理启动项 (8)4.8设置启动项的参数 (8)5.使用delloem进行管理 (9)5.1配置lcd (9)5.2查看MAC地址 (10)5.3设置lan的模式 (11)5.4设置背板led的状态 (11)5.5管理电源监控 (12)6.查看传感器数据sensor (12)6.1查看当前系统所有的传感器数据 (12)6.2设置传感器的告警阈值 (13)6.3查看某一传感器的状态信息 (13)6.4查看某一个传感器的当前值 (14)7.管理传感器仓库sdr (14)7.1查看传感器仓库中的信息列表 (15)7.2查看传感器的类型和指定类型的数据 (16)7.3查看指定传感器的配置信息 (17)7.4查看传感器仓库sdr的配置信息 (18)8.查看系统事件sel日志 (18)8.1查看sel的状态信息 (18)8.2查看sel的中的日志信息 (19)1.工具的安装yum install -y OpenIPMI ipmitool开启服务/etc/init.d/ipmi status/etc/init.d/ipmi start[root@cell83 ~]# ipmitool -Vipmitool version 1.8.182.命令的help明细的命令参考man ipmitool或者附件ipmitool.help[root@cell83 ~]# ipmitool -hipmitool version 1.8.18usage: ipmitool [options...] <command>-h This help-V Show version information-v Verbose (can use multiple times)-c Display output in comma separated format-d N Specify a /dev/ipmiN device to use (default=0)-I intf Interface to use-H hostname Remote host name for LAN interface-p port Remote RMCP port [default=623]-U username Remote session username-f file Read remote session password from file-z size Change Size of Communication Channel (OEM)-S sdr Use local file for remote SDR cache-D tty:b[:s] Specify the serial device, baud rate to useand, optionally, specify that interface is the system one -4 Use only IPv4-6 Use only IPv6-a Prompt for remote password-Y Prompt for the Kg key for IPMIv2 authentication-e char Set SOL escape character-C ciphersuite Cipher suite to be used by lanplus interface-k key Use Kg key for IPMIv2 authentication-y hex_key Use hexadecimal-encoded Kg key for IPMIv2 authentication-L level Remote session privilege level [default=ADMINISTRATOR]Append a '+' to use name/privilege lookup in RAKP1 -A authtype Force use of auth type NONE, PASSWORD, MD2, MD5 or OEM -P password Remote session password-E Read password from IPMI_PASSWORD environment variable-K Read kgkey from IPMI_KGKEY environment variable-m address Set local IPMB address-b channel Set destination channel for bridged request-t address Bridge request to remote target address-B channel Set transit channel for bridged request (dual bridge)-T address Set transit address for bridge request (dual bridge)-l lun Set destination lun for raw commands-o oemtype Setup for OEM (use 'list' to see available OEM types)-O seloem Use file for OEM SEL event descriptions-N seconds Specify timeout for lan [default=2] / lanplus [default=1] interface-R retry Set the number of retries for lan/lanplus interface [default=4]Interfaces:open Linux OpenIPMI Interface [default]imb Intel IMB Interfacelan IPMI v1.5 LAN Interfacelanplus IPMI v2.0 RMCP+ LAN Interfaceserial-terminal Serial Interface, Terminal Modeserial-basic Serial Interface, Basic Modeusb IPMI USB Interface(OEM Interface for AMI Devices)Commands:raw Send a RAW IPMI request and print responsei2c Send an I2C Master Write-Read command and print responsespd Print SPD info from remote I2C devicelan Configure LAN Channelschassis Get chassis status and set power statepower Shortcut to chassis power commandsevent Send pre-defined events to MCmc Management Controller status and global enablessdr Print Sensor Data Repository entries and readingssensor Print detailed sensor informationfru Print built-in FRU and scan SDR for FRU locatorsgendev Read/Write Device associated with Generic Device locators sdr sel Print System Event Log (SEL)pef Configure Platform Event Filtering (PEF)sol Configure and connect IPMIv2.0 Serial-over-LANtsol Configure and connect with Tyan IPMIv1.5 Serial-over-LANisol Configure IPMIv1.5 Serial-over-LANuser Configure Management Controller userschannel Configure Management Controller channelssession Print session informationdcmi Data Center Management Interfacenm Node Manager Interfacesunoem OEM Commands for Sun serverskontronoem OEM Commands for Kontron devicespicmg Run a PICMG/ATCA extended cmdfwum Update IPMC using Kontron OEM Firmware Update Manager firewall Configure Firmware Firewalldelloem OEM Commands for Dell systemsshell Launch interactive IPMI shellexec Run list of commands from fileset Set runtime variable for shell and exechpm Update HPM components using PICMG HPM.1 fileekanalyzer run FRU-Ekeying analyzer using FRU filesime Update Intel Manageability Engine Firmwarevita Run a VITA 46.11 extended cmdlan6 Configure IPv6 LAN Channels3.查看管理口的IP地址[root@cell83 ~]# ipmitool -I open lan print[root@cell83 ~]# ipmitool -I open lan print | grep IPIP Address Source : Static AddressIP Address : 192.168.0.133IP Header : TTL=0x40 Flags=0x40 Precedence=0x00 TOS=0x10 Default Gateway IP : 192.168.0.1Backup Gateway IP : 0.0.0.04.管理底盘chassis配置[root@cell83 ~]# ipmitool -I open chassis helpChassis Commands: status, power, identify, policy, restart_cause, poh, bootdev, bootparam, selftest4.1查看底盘配置汇总[root@cell83 ~]# ipmitool -I open chassis statusSystem Power : onPower Overload : falsePower Interlock : inactiveMain Power Fault : falsePower Control Fault : falsePower Restore Policy : previousLast Power Event :Chassis Intrusion : inactiveFront-Panel Lockout : inactiveDrive Fault : falseCooling/Fan Fault : falseSleep Button Disable : not allowedDiag Button Disable : allowedReset Button Disable : not allowedPower Button Disable : allowedSleep Button Disabled: falseDiag Button Disabled : trueReset Button Disabled: falsePower Button Disabled: false4.2管理电源查看当前电源状态[root@cell83 ~]# ipmitool -I open chassis power statusChassis Power is on打开电源ipmitool -I open chassis power on关闭电源ipmitool -I open chassis power off重启电源ipmitool -I open chassis power cycle重置电源ipmitool -I open chassis power reset其他配置ipmitool -I open chassis power diagipmitool -I open chassis power soft4.3管理时间间隔查询时间间隔:[root@cell83 ~]# ipmitool -I open chassis identifyChassis identify interval: default (15 seconds)设置时间间隔:[root@cell83 ~]# ipmitool -I open chassis identify helpchassis identify <interval>default is 15 seconds0 to turn offforce to turn on indefinitely4.4管理电源恢复策略[root@cell83 ~]# ipmitool -I open chassis policy helpchassis policy <state>list : return supported policiesalways-on : turn on when power is restoredprevious : return to previous state when power is restored always-off : stay off after power is restored4.5查看上次重启原因[root@cell83 ~]# ipmitool -I open chassis restart_cause System restart cause: unknown4.6查询上电时间[root@cell83 ~]# ipmitool -I open chassis pohGet Chassis Power-On-Hours failed: Invalid command4.7管理启动项[root@cell83 ~]# ipmitool -I open chassis bootdev helpbootdev <device> [clear-cmos=yes|no]bootdev <device> [options=help,...]none : Do not change boot device orderpxe : Force PXE bootdisk : Force boot from default Hard-drivesafe : Force boot from default Hard-drive, request Safe Modediag : Force boot from Diagnostic Partitioncdrom : Force boot from CD/DVDbios : Force boot into BIOS Setupfloppy: Force boot from Floppy/primary removable media4.8设置启动项的参数[root@cell83 ~]# ipmitool -I open chassis bootparam helpbootparam get <param #>bootparam set bootflag <device> [options=...]Legal devices are:none : No overrideforce_pxe : Force PXE bootforce_disk : Force boot from default Hard-driveforce_safe : Force boot from default Hard-drive, request Safe Modeforce_diag : Force boot from Diagnostic Partitionforce_cdrom : Force boot from CD/DVDforce_bios : Force boot into BIOS SetupLegal options are:help : print this messagePEF : Clear valid bit on reset/power cycle cause by PEFtimeout : Automatically clear boot flag valid bit on timeoutwatchdog: Clear valid bit on reset/power cycle cause by watchdogreset : Clear valid bit on push button reset/soft resetpower : Clear valid bit on power up via power push button or wake event Any Option may be prepended with no- to invert sense of operation5.使用delloem进行管理查看帮助[root@cell83 ~]# ipmitool -I open delloem helpusage: delloem <command> [option...]commands:lcdmaclansetledpowermonitorvFlashFor help on individual commands type:delloem <command> help5.1配置lcd[root@cell83 ~]# ipmitool -I open delloem lcd helpGeneric DELL HW:lcd set {none}|{default}|{custom <text>}Set LCD text displayed during non-fault conditionsiDRAC 11g or iDRAC 12g or iDRAC 13g :lcd set {mode}|{lcdqualifier}|{errordisplay}Allows you to set the LCD mode and user-defined string.lcd set mode {none}|{modelname}|{ipv4address}|{macaddress}|{systemname}|{servicetag}|{ipv6address}|{ambienttemp}{systemwatt }|{assettag}|{userdefined}<text>Allows you to set the LCD display mode to any of the precedingparameterslcd set lcdqualifier {watt}|{btuphr}|{celsius}|{fahrenheit}Allows you to set the unit for the system ambient temperature mode.lcd set errordisplay {sel}|{simple}Allows you to set the error display.lcd infoShow LCD text that is displayed during non-fault conditionslcd set vkvm{active}|{inactive}Set vKVM active and inactive, message will be displayed on lcdwhen vKVM is active and vKVM session is in progresslcd set frontpanelaccess {viewandmodify}|{viewonly}|{disabled}Set LCD mode to view and modify, view only or disabledlcd statusShow LCD Status for vKVM display<active|inactive>and Front Panel access mode {viewandmodify}|{viewonly}|{disabled}5.2查看MAC地址[root@cell83 ~]# ipmitool -I open delloem mac helpmac listLists the MAC address of LOMsmac get <NIC number>Shows the MAC address of specified LOM. 0-7 System LOM, 8- DRAC/iDRAC. [root@cell83 ~]# ipmitool -I open delloem mac listSystem LOMsNIC Number MAC Address Status0 b8:2a:72:db:56:2a Enabled1 b8:2a:72:db:56:2b E nabled2 b8:2a:72:db:56:28 E nabled3 b8:2a:72:db:56:29 E nablediDRAC7 MAC Address b0:83:fe:c9:6d:315.3设置lan的模式[root@cell83 ~]# ipmitool -I open delloem lan helplan set <Mode>sets the NIC Selection Mode :on iDRAC12g OR iDRAC13g :dedicated, shared with lom1, shared with lom2,shared with lom3,sharedwith lom4,shared with failover lom1,shared with failover lom2,sharedwith failover lom3,shared with failover lom4,shared with Failover allloms, shared with Failover None).on other systems :dedicated, shared, shared with failover lom2,shared with Failover all loms.lan geton iDRAC12g or iDRAC13g :returns the current NIC Selection Mode (dedicated, shared with lom1, sharedwith lom2, shared with lom3, shared with lom4,shared with failover lom1,shared with failover lom2,shared with failover lom3,shared with failoverlom4,shared with Failover all loms,shared with Failover None).on other systems :dedicated, shared, shared with failover,lom2, shared with Failover all loms.lan get activereturns the current active NIC (dedicated, LOM1, LOM2, LOM3, LOM4).5.4设置背板led的状态[root@cell83 ~]# ipmitool -I open delloem setled helpsetled <b:d.f> <state..>Set backplane LED stateb:d.f = PCI Bus:Device.Function of drive (lspci format)state = present|online|hotspare|identify|rebuilding|fault|predict|critical|failed5.5管理电源监控[root@cell83 ~]# ipmitool -I open delloem powermonitor helppowermonitorShows power tracking statisticspowermonitor clear cumulativepowerReset cumulative power readingpowermonitor clear peakpowerReset peak power readingpowermonitor powerconsumptionDisplays power consumption in <watt|btuphr>powermonitor powerconsumptionhistory <watt|btuphr>Displays power consumption historypowermonitor getpowerbudgetDisplays power cap in <watt|btuphr>powermonitor setpowerbudget <val><watt|btuphr|percent> Allows user to set the power cap in <watt|BTU/hr|percentage>powermonitor enablepowercapTo enable set power cappowermonitor disablepowercapTo disable set power cap6.查看传感器数据sensor[root@cell83 ~]# ipmitool -I open sensor helpSensor Commands: list thresh get reading6.1查看当前系统所有的传感器数据[root@cell83 ~]# ipmitool -I open sensor list6.2设置传感器的告警阈值[root@cell83 ~]# ipmitool -I open sensor thresh helpsensor thresh <id> <threshold> <setting>id : name of the sensor for which threshold is to be set threshold : which threshold to setunr = upper non-recoverableucr = upper criticalunc = upper non-criticallnc = lower non-criticallcr = lower criticallnr = lower non-recoverablesetting : the value to set the threshold tosensor thresh <id> lower <lnr> <lcr> <lnc>Set all lower thresholds at the same timesensor thresh <id> upper <unc> <ucr> <unr>Set all upper thresholds at the same time6.3查看某一传感器的状态信息[root@cell83 ~]# ipmitool -I open sensor get helpsensor get <id> ... [id]id : name of desired sensor查看温度传感器[root@cell83 ~]# ipmitool -I open sensor get TempLocating sensor record...Sensor ID : Temp (0xe)Entity ID : 3.1Sensor Type (Threshold) : TemperatureSensor Reading : 48 (+/- 1) degrees CStatus : okLower Non-Recoverable : naLower Critical : 3.000Lower Non-Critical : 8.000Upper Non-Critical : 79.000Upper Critical : 84.000Upper Non-Recoverable : naPositive Hysteresis : 1.000Negative Hysteresis : 1.000Assertion Events :Assertions Enabled :6.4查看某一个传感器的当前值[root@cell83 ~]# ipmitool -I open sensor reading helpsensor reading <id> ... [id]id : name of desired sensor查看温度传感器[root@cell83 ~]# ipmitool -I open sensor reading TempTemp | 477.管理传感器仓库sdr[root@cell83 ~]# ipmitool -I open sdr helpusage: sdr <command> [options]list | elist [option]all All SDR Recordsfull Full Sensor Recordcompact Compact Sensor Recordevent Event-Only Sensor Recordmcloc Management Controller Locator Recordfru FRU Locator Recordgeneric Generic Device Locator Recordtype [option]<Sensor_Type> Retrieve the state of specified sensor.Sensor_Type can be specified either asa string or a hex value.list Get a list of available sensor typesget <Sensor_ID>Retrieve state of the first sensor matched by Sensor_IDinfoDisplay information about the repository itselfentity <Entity_ID>[.<Instance_ID>]Display all sensors associated with an entitydump <file>Dump raw SDR data to a filefill <option>sensors Creates the SDR repository for the currentconfigurationnosat Creates the SDR repository for the currentconfiguration, without satellite scanfile <file> Load SDR repository from a filerange <range> Load SDR repository from a provided listor range. Use ',' for list or '-' forrange, eg. 0x28,0x32,0x40-0x447.1查看传感器仓库中的信息列表[root@cell83 ~]# ipmitool -I open sdr elist helpusage: sdr elist [all|full|compact|event|mcloc|fru|generic]=>查看仓库中所有的信息:elist和list的格式内容上略有不同[root@cell83 ~]# ipmitool -I open sdr elist all[root@cell83 ~]# ipmitool -I open sdr list all=>查看传感器的数据[root@cell83 ~]# ipmitool -I open sdr elist fullFan1 RPM | 30h | ok | 7.1 | 6240 RPMFan2 RPM | 31h | ok | 7.1 | 6240 RPMFan3 RPM | 32h | ok | 7.1 | 6240 RPMFan4 RPM | 33h | ok | 7.1 | 6120 RPMFan5 RPM | 34h | ok | 7.1 | 6240 RPMFan6 RPM | 35h | ok | 7.1 | 6240 RPMInlet Temp | 04h | ok | 7.1 | 35 degrees CExhaust Temp | 01h | ok | 7.1 | 40 degrees CTemp | 0Eh | ok | 3.1 | 47 degrees CTemp | 0Fh | ok | 3.2 | 46 degrees CCurrent 1 | 6Ah | ok | 10.1 | 0.80 AmpsCurrent 2 | 6Bh | ns | 10.2 | No ReadingVoltage 1 | 6Ch | ok | 10.1 | 236 VoltsVoltage 2 | 6Dh | ns | 10.2 | No ReadingPwr Consumption | 77h | ok | 7.1 | 168 Watts说明:Fan ----表示风扇Inlet Temp ----进口温度Exhaust Temp ----出口温度Temp ----CPU的温度Current --电流Voltage ---电压Pwr Consumption ----功率7.2查看传感器的类型和指定类型的数据查看传感器有哪些类型[root@cell83 ~]# ipmitool -I open sdr type listSensor Types:Temperature (0x01) Voltage (0x02) Current (0x03) Fan (0x04) Physical Security (0x05) Platform Security (0x06)Processor (0x07) Power Supply (0x08) Power Unit (0x09) Cooling Device (0x0a) Other (0x0b) Memory (0x0c) Drive Slot / Bay (0x0d) POST Memory Resize (0x0e)System Firmwares (0x0f) Event Logging Disabled (0x10)Watchdog1 (0x11) System Event (0x12) Critical Interrupt (0x13) Button (0x14)Module / Board (0x15) Microcontroller (0x16)Add-in Card (0x17) Chassis (0x18) Chip Set (0x19) Other FRU (0x1a) Cable / Interconnect (0x1b) Terminator (0x1c)System Boot Initiated (0x1d) Boot Error (0x1e)OS Boot (0x1f) OS Critical Stop (0x20)Slot / Connector (0x21) System ACPI Power State (0x22)Watchdog2 (0x23) Platform Alert (0x24) Entity Presence (0x25) Monitor ASIC (0x26)LAN (0x27) Management Subsys Health (0x28) Battery (0x29) Session Audit (0x2a)Version Change (0x2b) FRU State (0x2c)查看指定传感器的数据如查看温度:[root@cell83 ~]# ipmitool -I open sdr type TemperatureInlet Temp | 04h | ok | 7.1 | 35 degrees CExhaust Temp | 01h | ok | 7.1 | 40 degrees CTemp | 0Eh | ok | 3.1 | 46 degrees CTemp | 0Fh | ok | 3.2 | 47 degrees C如查看电源的个数1:有一个电源[root@cell83 dvd]# ipmitool -I open sdr type "Power Supply"PS Redundancy | 74h | ns | 7.1 | No ReadingStatus | 62h | ok | 10.1 | Presence detectedStatus | 63h | ns | 10.2 | Disabled如查看电源的个数2:有四个电源[root@db04 ~]# ipmitool -I open sdr type "Power Supply"PS Redundancy | 74h | ok | 7.1 | Redundancy LostStatus | 62h | ok | 10.1 | Presence detectedStatus | 63h | ok | 10.2 | Presence detected, Power Supply AC lostStatus | 52h | ok | 10.3 | Presence detected, Config Error, Power Supply InactiveStatus | 53h | ok | 10.4 | Presence detected, Config Error, Power Supply Inactive7.3查看指定传感器的配置信息[root@cell83 ~]# ipmitool -I open sdr get TempSensor ID : Temp (0xe)Entity ID : 3.1 (Processor)Sensor Type (Threshold) : Temperature (0x01)Sensor Reading : 47 (+/- 1) degrees CStatus : okNominal Reading : 23.000Normal Minimum : 11.000Normal Maximum : 69.000Upper critical : 83.000Upper non-critical : 77.000Lower critical : 3.000Lower non-critical : 8.000Positive Hysteresis : 1.000Negative Hysteresis : 1.000Minimum sensor range : UnspecifiedMaximum sensor range : UnspecifiedEvent Message Control : Per-thresholdReadable Thresholds : No ThresholdsSettable Thresholds : No ThresholdsAssertion Events :Assertions Enabled :7.4查看传感器仓库sdr的配置信息[root@cell83 ~]# ipmitool -I open sdr infoSDR Version : 0x51Record Count : 170Free Space : 1836 bytesMost recent Addition : 02/07/2106 06:28:15Most recent Erase : 02/07/2106 06:28:15SDR overflow : noSDR Repository Update Support : modalDelete SDR supported : noPartial Add SDR supported : noReserve SDR repository supported : yesSDR Repository Alloc info supported : no8.查看系统事件sel日志[root@cell83 ~]# ipmitool -I open sel helpSEL Commands: info clear delete list elist get add time save readraw writeraw interpret 8.1查看sel的状态信息[root@cell83 ~]# ipmitool -I open sel info helpSEL InformationVersion : 1.5 (v1.5, v2 compliant)Entries : 740Free Space : 4544 bytesPercent Used : 72%Last Add Time : 08/27/2018 08:48:29Last Del Time : 09/13/2014 11:16:12Overflow : falseSupported Cmds : 'Reserve'8.2查看sel的中的日志信息ipmitool -I open sel list | elistWhen this command is invoked without arguments, the entire contents of the System Event Log are displayed. If invoked as elist (extended list) it will also use the Sensor Data Record entries to display the sensor ID for the sensor that caused each event. Note this can take a long time over the system interface.<count> | first <count>Displays the first count (least-recent) entries in the SEL. If count is zero, all entries are displayed.last <count>Displays the last count (most-recent) entries in the SEL. If count is zero, all entries are displayed.查看前5条[root@cell83 ~]# ipmitool -I open sel elist first 51 | 09/13/2014 | 11:16:12 | Event Logging Disabled SEL | Log area reset/cleared | Asserted2 | 10/15/2014 | 13:42:04 | Physical Security Intrusion | General Chassis intrusion () | Asserted3 | 10/15/2014 | 13:42:09 | Physical Security Intrusion | General Chassis intrusion () | Deasserted4 | 10/16/2014 | 12:08:20 | Physical Security Intrusion | General Chassis intrusion () | Asserted5 | 10/16/2014 | 12:08:49 | Physical Security Intrusion | General Chassis intrusion () | Deasserted查看后5条[root@cell83 ~]# ipmitool -I open sel elist last 52e0 | 08/02/2018 | 01:45:10 | Physical Security Intrusion | General Chassis intrusion () | Deasserted2e1 | 08/04/2018 | 04:11:34 | OS Boot | Installation started | Asserted2e2 | 08/04/2018 | 04:21:03 | OS Boot | Installation completed | Asserted2e3 | 08/27/2018 | 08:48:24 | Physical Security Intrusion | General Chassis intrusion () | Asserted2e4 | 08/27/2018 | 08:48:29 | Physical Security Intrusion | General Chassis intrusion () | Deasserted。
itest平台EMC自动化测试指导书

itest 平台自动化测试指导书文档摘要:无使用说明:该自动化配置主要是在OLT 上配置简单的单播业务,测试仪表上业务流的创建还需要手动完成。
上海市共进通信技术有限公司一.自动化工具测试环境1、硬件拓扑注释:搭建测试环境时,需将DUT的LAN1口连接测试仪表。
图12、通过认证点击下图的红色边框图标图2图3图4如果server没有起来可以先stop再start保证connection1能够link up图5connection1的IP和License Settings的IP保持一致即可图6二.自动化测试执行步骤1、打开测试工具1)打开iTest,弹出对话框,选择workspace路径,已设置好路径C:\Users\Administrator\iTest_4.2_workspace图72)点击OK后,如果check license失败会重新进去进入图8所示对话框。
按照通过认证所述方法修改即可。
图83)点击OK后,点击右下角apply,再点击OK,如图9。
图94)点击OK可成功开启iTest,进入图10并确保ASB7360_Parameter.ffpt为全局参数。
(右键单击ASB7360_Parameter.ffpt文件,选择set as global parameter file,设为全局参数文件后,此文件左上角会有一个小太阳)此文件用于在iTest用例中进行参数绑定和调用;图10如图所示ASB7360_Parameter.ffpt和ZTEC300_Parameter.ffpt分别是贝尔OLT和中兴OLT 的全局参数文件,当需要配置相应OLT业务时,也要选择对应OLT的全局参数文件。
2、配置参数1)上述参数文件具体内容如下,如图11和图12图11 ASB7360_Parameter.ffpt图12 ZTEC300_Parameter.ffpt3、执行测试双击需要执行的用例,再点击绿色按钮就可以执行该用例。
ipmitool 中文 帮助 文档

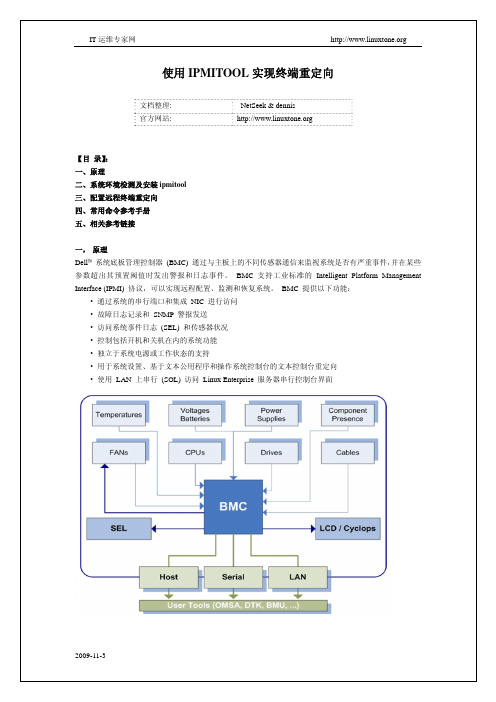
ipmitool 中文帮助文档Name(名字)Ipmitool ——对于控制支持IPMI的设备有效.Synopsis(概要)ipmitool [-c|-h|-v|-V] -I open <command>ipmitool [-c|-h|-v|-V] -I lan -H <hostname>[-p <port>][-U <username>][-A <authtype>][-L <privlvl>][-a|-E|-P|-f <password>][-o <oemtype>]<command>ipmitool [-c|-h|-v|-V] -I lanplus -H <hostname>[-p <port>][-U <username>][-L <privlvl>][-a|-E|-P|-f <password>][-o <oemtype>][-C <ciphersuite>]<command>Description(描述)这个程序能够使你通过一个kernel设备驱动或者一个远程系统,利用IPMI v1.5或IPMIv2.0 来管理本地系统的任何一个智能平台管理接口(IPMI)功能。
这些功能包括打印FRU(现场可替换装置)信息、LAN 配置、传感器读数、以及远程机架电源控制。
一个本地系统接口的IPMI管理功能需要一个兼容IPMI的kernel驱动程序被安装以及配置。
在linux中,这个驱动叫做OpenIPMI,他被包括在了标准化分配中。
在Solaris系统中,这个驱动叫做BMC,他被包括在了Solaris 10中。
远程控制的管理需要授权以及配置IPMI-over-LAN接口。
根据每个系统独特的需要,它可以通过系统接口来使LAN接口使用ipmitool。
Linux系统下的ipmitool工具应该怎样使用
Linux系统下的ipmitool工具应该怎样使用本文介绍ipmitool工具的使用,这个命令主要是用来操作服务器硬件的,所以一般的业务运维很少会用它,但它的功能很强大,比如:能够硬重启服务器,重设BMC口,配置BMC口IP,进入grub环境,设置boot顺序,等等。
在CentOS和RedHat Linux的大部分版本中都会默认安装它,所以它的实用性比较广。
还有一个好处是用它可以制作远程管理服务器的运维自动化系统。
- 进入grub环境:代码如下:ipmitool -H $BMC_IP -I lanplus -U $USERNAME -P $PASSWORD sol activate- 查看电源状态:代码如下:ipmitool -H $BMC_IP -I lan -U $USERNAME -P $PASSWORD power status- 强制修改启动项,让机器重启后自动进入BIOS设置界面:代码如下:ipmitool -H $BMC_IP -I lanplus -U $USERNAME -P $PASSWORD chassis bootparam set bootflag force_bios- 关掉服务器电源,再打开:代码如下:ipmitool -H $BMC_IP -I lan -U $USERNAME -P $PASSWORD power cycle- 查看BMC信息:代码如下:ipmitool -H $BMC_IP -I lan -U $USERNAME -P $PASSWORD mc info- 显示lan的信息:代码如下:ipmitool -H $BMC_IP -I lan -U $USERNAME -P $PASSWORD lan printIpmitool �CI open sensor list命令可以获取传感器中的各种监测值和该值的监测阈值,包括(CPU温度,电压,风扇转速,电源调制模块温度,电源电压等信息)Ipmitool �CI open sensor get “CPU0Temp”可以获取ID为CPU0Temp 监测值,CPU0Temp是sensor的ID,服务器不同,ID表示也不同。
自动化测试平台操作手册

1.接口自动化接口自动化包含接口管理、报文管理、测试集管理、测试执行、测试报告几个模块,用户通过创建接口->创建接口下报文->创建报文场景->配置场景数据->建立测试集->执行测试来完成接口自动化整个测试管理流程,并通过测试报告模块来查看测试结果详情。
1.1.接口管理接口管理主要用于接口的创建、修改、删除,并且可以管理接口下的所有入参节点。
1.1.1.接口添加通过点击”添加接口”按钮来打开接口添加窗口:输入完整接口信息,点击提交即可保存。
1.1.2.入参管理点击接口列表页面的入参管理按钮打开对应接口的入参管理页面:接口入参可单条添加,同时也能通过导入入参报文的json串来批量添加:1.2.报文管理报文管理主要对接口下属各种不同格式类型的报文进行管理,同时也能管理对应报文的各种测试场景、配置测试场景的测试数据、返回报文的参数验证规则编辑以及执行单次测试等。
1.2.1.添加报文通过点击添加报文按钮来打开添加窗口:选择报文对应的接口,输入报文名称(类似如”根据userid查询用户基本信息”或者”根据custid查询用户基本信息”),填入该报文对应的请求入参json,点击验证按钮,系统将会判断该json报文中包含的入参节点是否都存在与对应接口的参数库中,验证成功即可提交保存。
1.2.2.测试场景测试场景是根据报文下入参的不同状态或者不同类型的数据来细分出来的,例如”正常用户根据id查询用户信息”和”欠费用户根据id查询用户信息”。
添加场景只需要输入场景名称和备注即可。
对应每个测试场景可进行上图中的操作,从左到右分别表示:验证规则编辑、场景测试、测试数据编辑、删除等操作。
具体详见下方说明:1.2.2.1测试数据添加场景的测试数据需要输入数据的标示,该标示应该可以简明直接的表示各数据间的差异,例如场景对应的报文名为”根据userid查询用户信息”,那么该场景的数据标示应该填入对应的userid。
python自动化接口测试自学手册

Python自动化接口测试自学手册一、概述1. Python自动化接口测试是指利用Python语言编写测试脚本,用于对接口进行自动化测试的一种测试方法。
随着互联网行业的迅速发展,接口测试在软件开发中扮演着越来越重要的角色,而Python作为一种简洁、高效、易学易用的编程语言,被广泛应用于接口测试领域。
2. 本手册将介绍Python自动化接口测试的基本概念、常用工具、实际操作和案例分析,旨在帮助初学者快速入门并掌握Python自动化接口测试的相关知识和技能。
二、Python自动化接口测试基础2.1 接口测试概念及重要性接口测试是指在软件开发中,对软件系统的接口进行测试的过程。
接口测试主要包括功能测试、性能测试、安全测试等方面,通过对接口的各项功能进行验证,保证系统的稳定性和可靠性。
在软件开发中,接口是各个模块之间的通信桥梁,接口测试对于软件的质量和稳定性至关重要。
2.2 Python语言基础Python是一种高级编程语言,具有简洁、易读、易学的特点,适合初学者入门。
在Python的基础语法学习过程中,需要对Python的数据类型、变量、运算符、流程控制语句、函数等基本知识有所了解。
对于初学者来说,可以通过阅读相关书籍或者参加相关课程进行学习。
2.3 接口测试工具在Python自动化接口测试中,常用的工具包括requests库、unittest框架、pytest框架、Allure报告等。
requests库可以用于发送HTTP请求和获取HTTP响应,是Python中进行接口测试的重要工具。
unittest和pytest是Python中常用的测试框架,可以用于编写和执行接口测试用例。
Allure是一种灵活的测试结果报告工具,可以美化测试报告并提供详细的测试结果。
三、Python自动化接口测试实战3.1 安装Python环境我们需要在本地环境中安装Python。
可以到Python全球信息站下载最新的Python安装包,根据安装向导进行安装。
ipmitool
三,配置远程终端重定向 1. 系统启动,安 F2 进入 BIOS 设置, 设置重定向到 com2
2009-11-3
IT 运维专家网
4) LAN User Configuration—选项配置设置连接管理账号 root 用户的密码
确认没有问题,按一下 ESC 键,出来一个小对话框,让选择,此时选择 Save Changes and Exit 选项进行存盘退
出,此时机器开始继续引导系统
-----------------------------------------------------------------------------------------------------------------
如果你重启 10.10.217.72,你将可以在 10.10.217.32 这台机器上看到相关启动的全部画面:
…….. 2009-11-3
IT 终端重定向配置完成,你也可以为你的老板每台服务器省掉上千元,不用去够买 DELL 的远程控制卡了。利用 ipmitool 这个工具命令行下即可以搞定一切,用他来处理你工作中遇到的一些故障 而不用直接跑到机房。
//掩码
ipmitool lan set 1 access on
ipmitool lan set 1 defgw ipaddr 10.10.217.1 //配置网关
ipmitool user list 1 ipmitool user set password 2 “52linuxtone”
//列出当前用户列表 //其中 2 为要设置密原的用户 ID 号,设置密码为 52linuxtone
自动化测试技术手册

自动化测试技术手册自动化测试技术是软件测试领域中的一项重要技术,它能够提高测试效率和质量,并且能够减少测试过程中的人力成本。
本手册将详细介绍自动化测试技术的原理、方法和工具,帮助读者全面了解和应用该技术。
一、自动化测试技术概述自动化测试技术是利用计算机程序对软件进行测试的过程。
相较于传统的手工测试方法,自动化测试技术能够通过编写测试脚本和使用自动化测试工具来自动执行测试用例,提高测试效率和准确性。
它适用于各类软件项目,无论是Web应用、移动应用还是桌面应用,都可以采用自动化测试技术进行测试。
二、自动化测试技术的原理自动化测试技术的基本原理是模拟用户的操作行为,通过自动化测试工具执行一系列预定的测试用例,检查软件的功能和性能是否符合预期要求。
它可以模拟用户在软件界面上的各种操作,例如点击按钮、输入文本、选择选项等。
通过模拟这些操作,自动化测试工具能够自动进行测试,提高测试效率并减少人为错误。
三、自动化测试技术的方法1. UI自动化测试UI自动化测试是最常用的自动化测试方法之一。
它通过模拟用户的操作,自动执行预定的测试用例,检查软件界面的正确性和响应性能。
UI自动化测试工具可以录制和回放用户的操作,自动生成测试脚本并执行测试,如Selenium、Appium等。
2. API自动化测试API自动化测试是针对软件的接口进行测试的一种方法。
它通过编写测试脚本,直接调用软件接口并验证返回结果是否符合预期。
API自动化测试能够快速检查接口的正确性和功能性能,并减少人为测试的工作量,如Postman、JUnit等。
3. 性能自动化测试性能自动化测试是测试软件在负载情况下的性能指标的方法。
它通过模拟多个用户同时访问软件,测试其响应时间、并发处理能力和资源利用率等。
性能自动化测试可以使用压力测试工具对软件进行测试,如Apache JMeter、LoadRunner等。
四、自动化测试工具1. SeleniumSelenium是一种广泛使用的UI自动化测试工具,支持多种编程语言和浏览器。
- 1、下载文档前请自行甄别文档内容的完整性,平台不提供额外的编辑、内容补充、找答案等附加服务。
- 2、"仅部分预览"的文档,不可在线预览部分如存在完整性等问题,可反馈申请退款(可完整预览的文档不适用该条件!)。
- 3、如文档侵犯您的权益,请联系客服反馈,我们会尽快为您处理(人工客服工作时间:9:00-18:30)。
IPMITOOL自动化测试
一。
系统环境:ubuntu 15.04 (2)
二。
准备工作 (2)
1. 在ubuntu上安装python 2.7 (2)
2. yaml文件夹,IPMI_automation.py,IPMI_data.yaml,ipmitools
需要放置在同一目录下 (3)
三. 测试ipmitool (3)
四。
单元测试补充内容 (1)
一.系统环境:ubuntu 15。
04
二.准备工作:
1.在ubuntu上安装python
2.7
在ubuntu linux的发布版本中有预先安装好的python,可按照如下步骤安装python 2.7。
1)在边条上选择“unbuntu软件中心”,它看上去像一个橘色的袋子,如果你没有看到它,可以点击“Dash主页”图标,然后在对话框中输入Software;
2)在软件中心右上角的搜索框中输入Python;
3)在出现的软件列表中选择Python 2.7,并点击安装。
2.yaml文件夹,IPMI_automation。
py,IPMI_data。
yaml,ipmitools需要放置
在同一目录下:
1)ipmitools可以通过shell命令来进行安装:apt-get install ipmitool;
2)ipmitools可以通过shell命令来获取安装路径:whereis ipmitool;
3)按照ipmitools的所在路径找到ipmitools相关文件,拷贝相关文件,放置与yaml 文件夹,IPMI_automation.py,IPMI_data。
yaml同一目录下即可。
三.测试ipmitool:
测试步骤如下:
1)将需要测试的ipmitool command 作为Parmeters写进IPMI_data。
yaml,每条
命令对应的Returncode一律写成0(0代表该条命令执行成功);
2)修改好IPMI_data。
yaml后保存并关闭,打开python 2.7,打开
IPMI_automation.py:
3)运行该自动化测试脚本:
窗口中打印的结果中,如果Expected returncode=Excecute returncode=0,则代表该条命令执行成功,否则代表执行失败;同时程序运行完毕后会在同一目录下生成两个日志,一个详细日志,一个样例日志:
4)打开详细日志日志如下,可以检查shell具体的返回结果:
5)打开样例日志,可以检查每条命令是否pass,总体pass多少命令,fail多少命
令:
四.单元测试补充内容:
单元测试的重要性就不多说了,可恶的是python中有太多的单元测试框架和工具,什么unittest, testtools, subunit, coverage, testrepository,nose, mox, mock, fixtures, discover,再加上setuptools, distutils 等等这些,先不说如何写单元测试,光是怎么运行单元测试就有N多种方法,再因为它是测试而非功能,是很多人没兴趣触及的东西.但是作为一个优秀
的程序员,不仅要写好功能代码,写好测试代码一样的彰显你的实力。
如此多的框架和工具,很容易让人困惑,困惑的原因是因为并没有理解它的基本原理,如果一些基本的概念都不清楚,怎么能够写出思路清晰的测试代码?
今天的主题就是unittest,作为标准python中的一个模块,是其它框架和工具的基础,参考资料是它的官方文档:/2。
7/library/unittest.html和源代码,文档已经写的非常好了,我在这里记录的主要是它的一些重要概念、关键点以及可能会碰到的一些坑,目的在于对unittest加深理解,而不是停留在泛泛的表面层上。
unittest是一个python版本的junit,junit是java中的单元测试框架,对java的单元测试,有一句话很贴切:Keep the bar green,相信使用eclipse 写过java单元测试的都心领神会.unittest实现了很多junit中的概念,比如我们非常熟悉的test case, test suite等,总之,原理都是相通的,只是用不同的语言表达出来。
在开始就介绍了unittest中的4个重要的概念:test fixture, test case,test suite, test runner,我觉得只有理解了这几个概念,才能真正的理解单元测试的基本原理,下面就主要围绕这几个概念来展开这篇文章。
首先通过查看unittest的源码,来看一下这几个概念,以及他们之间的关系,他们是如何在一起工作的,其静态类图如下:
•一个TestCase的实例就是一个测试用例。
什么是测试用例呢?就是一个完整的测试流程,包括测试前准备环境的搭建(setUp),执行测试代码
(run),以及测试后环境的还原(tearDown)。
元测试(unit test)的本质也就在这里,一个测试用例是一个完整的测试单元,通过运行这个测试
单元,可以对某一个问题进行验证。
•而多个测试用例集合在一起,就是TestSuite,而且TestSuite也可以嵌套TestSuite.
•TestLoader是用来加载TestCase到TestSuite中的,其中有几个loadTestsFrom__()方法,就是从各个地方寻找TestCase,创建它们的实
例,然后add到TestSuite中,再返回一个TestSuite实例.
•TextTestRunner是来执行测试用例的,其中的run(test)会执行TestSuite/TestCase中的run(result)方法。
•测试的结果会保存到TextTestResult实例中,包括运行了多少测试用例,成功了多少,失败了多少等信息。
这样整个流程就清楚了,首先是要写好TestCase,然后由TestLoader加载TestCase到TestSuite,然后由 TextTestRunner来运行TestSuite,运行的结果保存在TextTestResult中,整个过程集成在unittest。
main模块中。
现在已经涉及到了test case, test suite, test runner这三个概念了,还有test fixture没有提到,那什么是test fixture呢??在TestCase的docstring中有这样一段话:
可见,对一个测试用例环境的搭建和销毁,是一个fixture,通过覆盖TestCase 的setUp()和tearDown()方法来实现。
这个有什么用呢?比如说在这个测试用例中需要访问数据库,那么可以在setUp()中建立数据库连接以及进行一些初始化,在tearDown() 中清除在数据库中产生的数据,然后关闭连接。
注意tearDown的过程很重要,要为以后的TestCase留下一个干净的环境。
关于fixture,还有一个专门的库函数叫做fixtures,功能更加强大。
至此,概念和流程基本清楚了,下面通过简单的例子再来实践一下,就拿unittest文档上的例子吧:
TestSequenceFunctions继承自unittest.TestCase,重写了setUp()方法,并且定义了三个以'test' 开头的方法,那这个TestSequenceFunctions类到底是个什么呢?它是一个测试用例,还是三个测试用例?说是三个测试用例的话,它本身继承自TestCase,说是一个测试用例的话,里面又有三个test_*()方法,明显是三个测试用例。
其实,我们只要看一些TestLoader是如何加载测试用例的,就一清二楚了,在loader。
TestLoader类中有一个loadTestsFromTestCase()方法:
getTestCaseNames()是从TestCase这个类中找所有以“test”开头的方法,然后注意第9行,在构造TestSuite对象时,其参数使用了一个map方法,即对testCaseNames中的每一个元素,使用testCaseClass为其构造对象,其结果是一个 TestCase的对象集合,可以用下面的代码来分步说明:
可见,对每一个以test开头的方法,都为其构建了一个TestCase对象,值得注意的是,如果没有定义test开头的方法,而是将测试代码写到了一个名为runTest 的方法中,那么会为该runTest方法构建TestCase对象,如果定义了test开头的方法,就会忽略 runTest方法。
至此,基本就清楚了,每一个以test开头的方法,都会为其构建TestCase对象,也就是说TestSequenceFunctions类中其实定义了三个TestCase,之所以写成这样,是为了方便,因为这几个测试用例的fixture是相同的,如果每一个测试用例单独写成一个 TestCase的话,会有很多的冗余代码。
明白了这些,文档就可以很轻松的看懂了,至于怎么运行测试用例,以及其他的内容,直接看文档吧。
11/ 11。