[MCM]2014年美赛MCM题目原文及翻译
2014年美赛C题翻译
This will take some skilled data extraction and modeling efforts to obtain the correct set of nodes (the Erdös coauthors) and their links (connections with one another as coauthors). 这需要熟练数据提取 并 在建模上下功夫, 以便得到正确的节点和边
Once built, analyze the properties of this network. 建完后分析网络性能(Again, do not include Erdös --- he is the most infnodes in the network. In this case, it’s co-authorship with him that builds the network, but he is not part of the network or the analysis.)
One of the techniques to determine influence of academic research is to build and measure properties of citation or co-author networks.
学术研究的技术来确定影响之一是构建和引文或合著网络的度量属性。
Google Scholar is also a good data tool to use for network influence or impact data collection and analysis.
谷歌学术搜索也是一个好的数据工具用于网络数据收集和分析影响或影响。
2014 数学建模美赛B题
PROBLEM B: College Coaching LegendsSports Illustrated, a magazine for sports enthusiasts, is looking for the “best all time college coach”male or female for the previous century. Build a mathematical model to choosethe best college coach or coaches (past or present) from among either male or female coaches in such sports as college hockey or field hockey, football, baseball or softball, basketball, or soccer. Does it make a difference which time line horizon that you use in your analysis, i.e., does coaching in 1913 differ from coaching in 2013? Clearly articulate your metrics for assessment. Discuss how your model can be applied in general across both genders and all possible sports. Present your model’s top 5 coaches in each of 3 different sports.In addition to the MCM format and requirements, prepare a 1-2 page article for Sports Illustrated that explains your results and includes a non-technical explanation of your mathematical model that sports fans will understand.问题B:大学教练的故事体育画报,为运动爱好者杂志,正在寻找上个世纪堪称“史上最优秀大学教练”的男性或女性。
美赛历年赛题
美赛历年赛题
美国数学建模竞赛(MCM/ICM)自1985年创办以来已有35年的历史,每年都会发布三个模型问题供参赛选手在限定时间内进行研究和解答。
经过不断发展和完善,MCM/ICM成为了世界范围内最具影响力的数学建模竞赛之一。
以下是MCM/ICM历年来的一些典型赛题:
1985年 MCM A题:研究在给定经济情况下,如何规划BMW公司未来的生产计划及车型。
1987年 MCM A题:在地球上一个非常均匀的平面,建立一个小型城市,考虑各种环境因素如何影响城市的设施和功能。
1991年 MCM D题:分析社会上性别和种族歧视。
1997年 MCM C题:分析为什么珊瑚礁的污染问题比林区污染问题显得更为严重。
2002年 MCM A题:研究货轮舱位的装载问题,最大化收益同时保证船上货物负荷均衡。
2006年 MCM A题:建立模型研究地球大气环境中的水循环,探究人类活动对水循环的影响。
2010年 MCM A题:分析美国电力网络的可靠性,研究如何在自然灾害和人为故障的情况下使电力网络正常运作。
2014年 MCM A题:分析对于Fermi问题和经济增长的数学建模,探究经济增长的限制因素和未来发展趋势。
2018年 MCM A题:研究美国国家公园的野生动植物种类和数量变化,确定如何平衡保护野生动植物和国家公园的多个目的。
从这些题目中可以看出,MCM/ICM的竞赛内容涵盖了众多领域,如管理学、环保、气象、物流、生物学等等。
这不仅考验了参赛选手的数学建模水平,更需要他们具备良好的跨学科素养。
正是这种多学科交叉融合的特性,使得MCM/ICM成为了培养未来数学、理工科人才的重要平台之一。
历年美国大学生数学建模竞赛试题MCM.翻译版doc

1985 年美国大学生数学建模竞赛MCM 试题1985年MCM:动物种群选择适宜的鱼类和哺乳动物数据准确模型。
模型动物的自然表达人口水平与环境相互作用的不同群体的环境的重要参数,然后调整账户获取表单模型符合实际的动物提取的方法。
包括任何食物或限制以外的空间限制,得到数据的支持。
考虑所涉及的各种数量的价值,收获数量和人口规模本身,为了设计一个数字量代表的整体价值收获。
找到一个收集政策的人口规模和时间优化的价值收获在很长一段时间。
检查政策优化价值在现实的环境条件。
1985年MCM B:战略储藏管理钴、不产生在美国,许多行业至关重要。
(国防占17%的钴生产。
1979年)钴大局部来自非洲中部,一个政治上不稳定的地区。
1946年的战略和关键材料储藏法案需要钴储藏,将美国政府通过一项为期三年的战争。
建立了库存在1950年代,出售大局部在1970年代初,然后决定在1970年代末建立起来,与8540万磅。
大约一半的库存目标的储藏已经在1982年收购了。
建立一个数学模型来管理储藏的战略金属钴。
你需要考虑这样的问题:库存应该有多大?以什么速度应该被收购?一个合理的代价是什么金属?你也要考虑这样的问题:什么时候库存应该画下来吗?以什么速度应该是画下来吗?在金属价格是合理出售什么?它应该如何分配?有用的信息在钴政府方案在2500万年需要2500万磅的钴。
美国大约有1亿磅的钴矿床。
生产变得经济可行当价格到达22美元/磅(如发生在1981年)。
要花四年滚动操作,和thsn六百万英镑每年可以生产。
1980年,120万磅的钴回收,总消费的7%。
1986 年美国大学生数学建模竞赛MCM 试题1986年MCM A:水文数据下表给出了Z的水深度尺外表点的直角坐标X,Y在码(14数据点表省略)。
深度测量在退潮。
你的船有一个五英尺的草案。
你应该防止什么地区的矩形(75200)X(-50、150)?1986年MCM B:Emergency-Facilities位置迄今为止,力拓的乡牧场没有自己的应急设施。
2014年美国大学生数学建模竞赛MCM A题二等奖
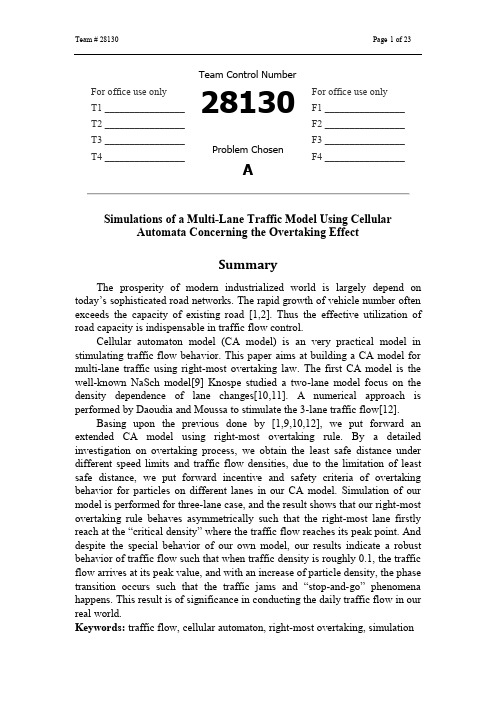
For office use only F1 ________________ F2 ________________ F3 ________________ F4 ________________
A
Simulations of a Multi-Lane Traffic Model Using Cellular Automata Concerning the Overtaking Effect
Summary
The prosperity of modern industrialized world is largely depend on today’s sophisticated road networks. The rapid growth of vehicle number often exceeds the capacity of existing road [1,2]. Thus the effective utilization of road capacity is indispensable in traffic flow control. Cellular automaton model (CA model) is an very practical model in stimulating traffic flow behavior. This paper aims at building a CA model for multi-lane traffic using right-most overtaking law. The first CA model is the well-known NaSch model[9] Knospe studied a two-lane model focus on the density dependence of lane changes[10,11]. A numerical approach is performed by Daoudia and Moussa to stimulate the 3-lane traffic flow[12]. Basing upon the previous done by [1,9,10,12], we put forward an extended CA model using right-most overtaking rule. By a detailed investigation on overtaking process, we obtain the least safe distance under different speed limits and traffic flow densities, due to the limitation of least safe distance, we put forward incentive and safety criteria of overtaking behavior for particles on different lanes in our CA model. Simulation of our model is performed for three-lane case, and the result shows that our right-most overtaking rule behaves asymmetrically such that the right-most lane firstly reach at the “critical density” where the traffic flow reaches its peak point. And despite the special behavior of our own model, our results indicate a robust behavior of traffic flow such that when traffic density is roughly 0.1, the traffic flow arrives at its peak value, and with an increase of particle density, the phase transition occurs such that the traffic jams and “stop-and-go” phenomena happens. This result is of significance in conducting the daily traffic flow in our real world. Keywords: traffic flow, cellular automaton, right-most overtaking, simulation
2014美赛试题翻译
问题答:保留权利-除-到-通规则在国家驾驶汽车,右侧是规则(即,美国、中国和其他大多数国家英国、澳大利亚及一些前英国殖民地),多车道高速公路经常雇用的规则,要求司机在最右边车道驾驶,除非他们通过另一辆车,在这种情况下他们移到左边,通一条行车线并返回到其前旅行车道。
生成和分析的数学模型来分析此规则在轻型和重型交通的性能。
您可能希望检查交通流量和安全的作用下或在 posted 速度限制(就是速度限制,是太高或太低),之间的权衡和(或)其他因素,不能显式调用在这一问题发言。
此规则是有效地促进了更好的交通流量吗?如果不是,建议和分析的替代品(包括可能没有这种规则在所有) 可能促进更大的交通流量、安全、和/或其他您认为重要的因素。
在国家在左侧驾驶汽车的标准是,争论是否您的解决方案可以与一个简单变化的方向,结转或将需要额外的要求。
最后,如上文所述的规则依赖于人为判断的法规遵从性。
如果在同一道路上的车辆运输已完全受到控制的智能化系统——道路网络的任何一个部件或嵌入在设计中所有使用的车辆巷——到何种程度上这会改变你先前分析的结果吗?问题 b:学院教练传奇体育画报杂志为体育爱好者,寻找"最佳所有时间学院教练"男性或女性为上个世纪。
建立一个数学模型,这种作为大学打冰球或曲棍球、足球、棒球或垒球、篮球、足球运动中选择最好的大学教练或从男性或女性教练中的教练 (过去或现在)。
不会它区别哪些时间线地平线,您使用在您的分析,即不会在 1913 年教练教练在 2013 年的区别吗?清楚地表述你的度量进行评估。
讨论如何跨性别和所有可能体育您的模型可以在一般的应用。
当前您的模型的顶部 5 教练每年的 3 个不同的运动项目。
除了 MCM 格式和要求,准备 1-2 页的文章,体育迷们将了解体育画报,解释您的结果,包括你的数学模型的非技术性解释。
ICM 的问题问题 c:使用网络来衡量影响和影响单击下面下载 2014 ICM 问题的 pdf 文件的标题。
2014美赛A题参考翻译
Problem A: The Keep-Right-Except-To-Pass RuleIn countries where driving automobiles on the right is the rule (that is, USA, China and most other countries except for Great Britain, Australia, and some former British colonies), multi-lane freeways often employ a rule that requires drivers to drive in the right-most lane unless they are passing another vehicle, in which case they move one lane to the left, pass, and return to their former travel lane.Build and analyze a mathematical model to analyze the performance of this rule in light and heavy traffic. You may wish to examine tradeoffs between traffic flow and safety, the role of under- or over-posted speed limits (that is, speed limits that are too low or too high), and/or other factors that may not be explicitly called out in this problem statement.Is this rule effective in promoting better traffic flow? If not, suggest and analyze alternatives (to include possibly no rule of this kind at all) that might promote greater traffic flow, safety, and/or other factors that you deem important.In countries where driving automobiles on the left is the norm, argue whether or not your solution can be carried over with a simple change of orientation, or would additional requirements be needed.Lastly, the rule as stated above relies upon human judgment for compliance. If vehicle transportation on the same roadway was fully under the control of an intelligent system –either part of the road network or imbedded in the design of all vehicles using the roadway – to what extent would this change the results of your earlier analysis?除超车外靠右行驶的交通规则在多数国家开车要遵守右边行驶的交通规则(如美国,中国,除了英国,澳大利亚和一些前英国的殖民地外),多道高速公路通常要求驾驶员在最右道行驶,除超车外,在超车时,司机会向左移动一个车道,超车,然后在回到原来的车道。
2014美国数学建模竞赛赛题翻译
问题A:右行左超规则在美国、中国和大多数除了英国、澳大利亚和一些前英国殖民地的国家,多车道高速公路常常有这样一种规则。
司机必须尽量在最右的车道行使,只有超车时,司机才可以向左移动一个车道来达成目的。
当司机超车完毕后必须回到原车道继续行使。
建立并分析一个数学模型,使得这个模型能够分析这个规则在交通高负荷和低负荷情况下的表现。
你可以从许多角度来思考这个问题,比如车流量和车辆安全之间的权衡,或者一个过快或过慢的车辆限速带来的影响等等。
这个规则可以使我们获得更好的交通流?如果不可以,请提出并分析一个替代方案使得交通流得到优化、安全得到保障、或者其他你认为重要的因素得到实现。
在靠左行使才是规则的国家,论证你的解决方案是否可以通过简单的变换或者通过增加一些新的要求来解决相同的问题。
最后,以上的规则的实行是建立在人们遵守它的基础上的,然而不是所有人都愿意去遵守。
那么现在我们使同一条道(可以只是一段,也可以是全段公路)上的交通车辆都在一个智能系统的严格控制下,这个变化对你之前的分析结果有多大的影响?问题B:体育画刊是一个为体育爱好者们设计的杂志。
这个杂志正在寻找上世纪女性或者男性的“历来最优秀的大学教练”。
建立一个数学模型,从男性或者女性体育教练中选择最好的大学教练(退役或者在役的都可以)。
这些体育教练可以是大学曲棍球、陆上曲棍球、足球、橄榄球、棒球、排球、篮球的教练。
你选择划分的时间会对你的分析有影响吗?也就是说,1913年的教练方式和2013年的会有什么不同吗?清楚的阐述你的评估方式。
讨论你的模型如何通用于两性教练和所有可能的运动项目上。
用你的模型为三项体育项目分别找到五个最佳教练。
再为体育画刊提供一篇1-2页的不涉及技术性问题解释的通俗易懂的文章来解释你们的结果,你们必须保证体育爱好者们能够理解。
2014美赛30303
For office use onlyT1 ________________ T2 ________________ T3 ________________ T4 ________________ Team Control Number30303Problem ChosenBFor office use onlyF1 ________________F2 ________________F3 ________________F4 ________________ 2014Mathematical Contest in Modeling (MCM/ICM) Summary Sheet(Attach a copy of this page to your solution paper.)Type a summary of your results on this page. Do not includethe name of your school, advisor, or team members on this page.Sports Illustrated is looking for the "best all time college coach" for the previous century. We synthesize Delphi Method, Analytic Hierarchy Process (AHP) and Principal Component Analysis (PCA) to establish a synthetical evaluation method, DHP.(1) Build a evaluation index system. We improve on Delphi Method to establish a synthetical evaluation index system which includes 4 first-grade indexes (sportsmanship, performance, attitude and abilities) and 16 second-grade indexes(see Table 2) to assess a coach's comprehensive competence and expound the definition of each index and data acquisition.(2) Determine the weight of each index. We adopt AHP and use Y AAHP to calculate the weight of the 4 first-grade indexes:U={U1, U2, U3,U4}={0.1451, 0.4582, 0.1188, 0.2779}. Among those 4 indexes, performance has more influence on comprehensive competence than other three indexes. While abilities comes second and other two indexes has less influence.(3) Establish a synthetical evaluation method. We employ PCA to acquire the synthetical score of each index. Then we determine the comprehensive competence evaluation scores of each coach based on the weight of each index. Considering that performance index is easy to acquire while the other three indexes are difficult to obtain directly (In fact, we can indirectly acquire the data of these three indexes through Expert Decision. Yet there are limits on time and conditions. Also, it is against the rules to seek helps from experts), we might as well assume that each coach has the same indexes of sportsmanship, attitude and abilities. So we use the synthetical evaluation scores of performance index as college coaches' comprehensive competence evaluation scores.(4) The synthetical evaluation of college coaches. We employ PCA only to analyze performance index. We abstract 7 indexes into 4 principle components to acquire comprehensive competence evaluation scores. Taking softball as an example to verify the assumption, we find that the accumulative contribution rate of those 4 principle components accounts for 99.6662%, which means the result is valid. Meanwhile, we rank each coach according to comprehensive competence evaluation score, Z (see Table 7). Also, we assess and rank coaches of basketball and football and list respectively the top 20 college coaches (see Table 8&9). Then we list out respectively the top 5 coaches of those three sports (see Table 10).Looking For the Best College Coaches1.IntroductionSports Illustrated, a magazine for sports enthusiasts, is looking for the "best all time college coach" male or female for the previous century. However, to assess the comprehensive competence of college coaches involves numerous factors, for instance, how a team’s training sessions and games reflect a coach’s comprehensive competence. Therefore, how to make an valid assessment of such competence requires a set of scientific and efficient evaluation methods. In this paper, we are going to build a synthetical evaluation model to assess college coaches' comprehensive competence.Requirement 1: Refer to relevant resources, build a system to evaluate indexes and expound the definition and quantitative approach (sources of data) of each index.Requirement 2: Base on the evaluation index system to establish a synthetical evaluation method which is applicable to male, female and all sports, choose three sports and look for related data, employ the synthetical evaluation method to assess coaches' comprehensive competence and list out the top five college coaches.Requirement 3: Prepare a 1-2 page article for Sports Illustrated that explains the results concluded through the synthetical evaluation method and includes a non-technical explanation of mathematical model that sports fans will understand.2.Symbols and DefinitionsTable 1. Variable DefinitionSymbols DefinitionZ,U Y,U21 G,U22 W,U23comprehensive competence evaluation scoreyears of coachinggameswinsL,U24loses T,U25tiesP,U26 W/Y,U27ijxijxpRwining percentagewins per yearstandardized value of indexvalue of indexthe number of major components correlation coefficient matrixNotes: Those symbols not included here will be given and defined later in this paper.3.Assumptions(1)Neglect the influence of time factor(2)Sex has no effect on the evaluation model(3)The chosen indexes of all sports for evaluation are identical(4)Coaches who have a longer years of coaching are more competent(5)Coaches who coached more games are more competent;(6)Coaches with less losses and ties are more competent;(7)Coaches with higher comprehensive competence evaluation scores are more competent;4. Analysis of the ProblemIt is required to build a mathematical model to choose the best college coach or coaches (past or present) from among either male or female coaches in such sports as college hockey or field hockey, football, baseball or softball, basketball, or soccer. We integrate Delphi, Analytic Hierarchy Process (AHP), Principal Component Analysis (PCA) and establish a synthetical evaluation method, DHP.The following is the detailed methodology of analysis:(1) To improve on Delphi, make it a combination of anonymous questionnaires and group discussion; collect information via consultation and statistics and analyze opinions from experts to establish a synthetical evaluation index system to analyze information.(2) To synthesize experts' judgments to the relative importance of each evaluation criterion and element, adopt AHP to build a index system and determine the weight of each evaluation index.(3) Base on the collected data and employ PCA to calculate the scores of each synthetical evaluation index.(4) Base on scores and weight of each synthetical evaluation index to make a synthetical assessment of each coach.5.Model 1: Determine evaluation index system - Delphi MethodDelphi Method, which relies on personal judgments and panels of experts, now develops as a new visual forecasting method. It is, in essence, an investigation through questionnaires and with feedbacks. In other words, there will be several rounds of questionnaires to a panel of experts. Their answers and questions will be aggregated and sent as anonymous feedbacks to those experts after each round. The experts are allowed to adjust their answers in subsequent rounds. After several rounds of questions and feedbacks, since each member of the panel agrees on what the group thinks as a whole, the Delphi Method could reach arelatively "correct" response through consensus[1].Delphi Method has three notable features:(1)Anonymity. All participants remain anonymous in the process. Therefore, it allows free expression of opinions and encourages open critique.(2) Feedbacks. All participants might make new judgments according to the feedbacks, which prevents or decreases the influence brought by the drawbacks of face-to-face meetings.(3) The statistical feature of predictions. Quantitative analysis is one crucial feature of Delphi Method. By analyzing predictions and assessing answers via statistical approach, the whole panel’s opinions and opinion deviation can be acquired.Since Delphi Method is based on subjective judgments of experts, it is especially applicable to long-term forecast which lacks objective materials or data and technical forecast which difficult to proceed through other methods. Besides, Delphi Method can estimate probability on possible prospect and expected prospect. This provides more options for decision makers to choose while any other methods can not acquire such crucial and probabilistic answers.To improve on Delphi Method, make it a combination of anonymous questionnaires and group discussion; collect information via consultation and statistics and analyze opinions from experts to establish a synthetical evaluation index system to analyze information. The details are as followings[2]:1)Facilitator sends questionnaires to experts on the basis of the issue in question.Meanwhile, experts are allowed to propose new opinions.2)Each expert finishes the questionnaire independently.3)Facilitator aggregates and summaries those answers to the questionnaires.4)Send the result of the first round and a new questionnaire to each experts.5)On the basis of the feedbacks, experts revise their own opinions. The result might lead tonew ideas, or improve the original plan. In the meantime, experts finish the questionnaire of the second round.6)Facilitator synthesizes the experts' opinions and propose several tentative ideas based onthose efforts.7)Model those tentative ideas and analyzes in a quantitative way. Also, the model will berevised time and again according to experts' opinions.8)Compare the quantitative results, integrate experts' opinions and put forward a solutionwith consensus.Index set: U=﹛U1,U2,…,U n﹜According to Delphi Method, together with the findings in article[3], we find that, under the influence of certain environmental elements, college coaches’ comprehensive competence is reflected by four elements, namely sportsmanship, performance, attitude and ability (see Table 2), the analysis is presented as followings:5.1 SportsmanshipSportsmanship is reflected by two indexes, fair competition and respect for referees. In a world with rapid development and diversification of society, politics, culture and economics, excellent professional ethics are the prerequisite of all the other abilities.(1) Fair competitionSports value fair, equal and rational competition. All actions, which involve relying on illegal means such as intentional injury, bias and taking illicit drugs to win game, are by no means moral and fair. Such actions ought to be condemned and punished.(2)Respect for refereesOne should respect for the referee's decisions, not to insult or assault referees, not to interfere with the referee’s ability to make fair decisions.5.2 PerformanceAs competitive sports is getting more and more commercialized, performance becomes a vital index to assess coaches' competence. (Because those evaluation indexes are clear to all, there is no need to further elaborate. ) Indexes are listed as followings:(1)Years of coaching(2)Games coached(3)Wins(4)Loses(5)Ties(6)Wining percentage(7)Wins per year5.3 AttitudeThis is manifested by the respect and love for a job, being responsible, accountable and eager to make progress. Here attitude is reflected by two indexes, enthusiasm and dedication, diligence.(1) Enthusiasm and dedicationIt is the prerequisite for any other jobs. Enthusiasm can promote initiatives and further generate great power and courage to overcome difficulties.(2) DiligenceDiligence is a manifestation of a coach's professional ethics and a fundamental premise for reaching the top level. To realize one’s career dream not only needs enthusiasm, but also needs diligence to learn various relevant knowledges, to lead the whole team to practice hard and to keep exploring the rules and methods of certain sports fixture.5.4 Abilities(1) Knowledge structureA coach's knowledge structure can reflect the degree to which one receives formal education, which is one of the factors that measure one’s knowledge level. Meanwhile, it is also an index to predict a coach’s potentials to lead training sessions and conduct scientific research.(2)Organize training sessionsIt is at the core of the ability structure and is one of the most fundamental ability of a coach.(3) Management abilitySince each athletic team features different characteristics and each athlete varies in psychological, physical and technical conditions, a coach should make full use of the knowledge from managerial theory to conduct comprehensive management in order to promote training and competitiveness.(4) Scientific research and creativityCreativity, which is a synthetical ability based on other abilities, is the core ability of a coach.(5) Ability to command gamesHow to command games well is a must for excellent coaches. A coach's excellent command of the game can help athletes to reach a better condition. Moreover, the command techniques play a decisive role in winning the game.This model adopts improved Delphi Method, integrates the existing results, choose 4 first-grade indexes, 16 second-grade indexes and build an evaluation index system to assess a coach's comprehensive competence.Table 2. An evaluation index system of coaches' comprehensive competence[3]First-grade index Second-grade indexComprehensive competence(U) Sportsmanship(U1)Fair competition (U11)Respect for referees (U12)Performance(U2)Years of coaching(U21)Games coached (U22)Wins (U23)Loses (U24)Ties (U25)Winning percentage (U26)Wins per year (U27) Attitude(U3)Enthusiasm and dedication(U31)Diligence (U32)Abilities(U4)Knowledge structure (U41)Organize training sessions(U42)Management ability (U43)Scientific research andcreativity (U44)Ability to command games(U45)It is easy to quantify performance index on the basis of game statistics which can be acquired via internet. As for other three first-grade indexes and their corresponding second-grade indexes, it is easy to do qualitative analysis instead of quantitative analysis. If we need to quantify those indexes, Expert Decision is usually adopted. Yet this method is time-consuming with certain subjectivity. If time and other conditions are allowed, this method can be adopted to acquire relevant data of those three indexes.6. Model 2: Determine the weight of each index-AHP Method[4]In system analysis of scientific management, people often confront with a complicated system which consists of various correlative and interactive factors and usually lacks quantitative data. While Analytic Hierarchy Process (AHP) provides us with a new, simple and practical way of modeling, especially applicable to those problems that are difficult to be analyzed fully quantitatively.We combine the conclusion from model 1 with the experts' judgments of relative importance of each index, adopt AHP to establish a weight matrix for comparison and judgment, which is the weighted fuzzy subset on U: the following data is all calculated through YAAHP software.In general, there are four steps to employ AHP to model.6.1 Establish hierarchical structure and its featuresWhen adopting AHP to analyze problems and make decisions, firstly we need to methodize the problem and make it stratified in order to establish a structure model with hierarchies. In this model, complicated problem is separated into several elements which form certain hierarchies according to attributes and their relations. Elements in the higher hierarchy serve as the rule and dominate relevant elements in the lower hierarchy.These hierarchies can be classified into three categories:(i)The highest hierarchy: there is only one element in this hierarchy. Generally speaking, it is the predetermined aim or ideal result of problem analysis. It is also called the target hierarchy.(ii)The intermediate hierarchy:this hierarchy includes intermediate links to realize the aim. It consists of several hierarchies, including rules that need attention, sub-rules. Therefore, it is called the rule hierarchy.(iii)The bottom hierarchy:this hierarchy includes alternative measures or options in order to realize one's aim. So it is also called the measure hierarchy or the option hierarchy.The hierarchies in hierarchical structure is associated with the problem's complexity and the detailedness in analysis. Generally, hierarchies are unrestricted in which dominated elements are no more than 9. This is because too many elements will bring difficulties in comparing indexes two by two.Set U as index set and establish a hierarchical structure model, as shown in figure 1.UFigure 1 Hierarchical Structure6.2 Establish a judgment matrixHierarchical structure reflets the relations between elements. Yet the rules in the rule hierarchy account for different proportion in measuring aims. In decision makers' mind, each rule takes up certain proportion.When we determine the proportion of several factors that influence certain element to this element, we frequently confront with difficulties that such proportion is not easy to quantify. Moreover, when a element is influenced by too many factors, if we directly consider the degree to which those factors influence this element, usually we will attend to one thing and lose another. This will lead to discrepancy in importance between the proposed data and what the decision maker actually thinks. The decision maker might even present a set of data with implicit contradiction. In order to see clearly, we could make the following assumptions: First smash a stone which weighs 1 kg into n parts. You can accurately weigh their weight and make their weight as w 1,…,w n . Now, ask someone to estimate the proportion of the weight of the n pieces of stone to the total weight (make sure that he does not know the weight of each stone). This person not only will have difficulties in giving an accurate answer, but also will give self-contradictory data for he might attend to one stone and lose another.Assume that we need to compare the degree to which n factors influence element Z ,{}n x x x X ,,,21⋅⋅⋅=,in what way can the comparison provide us with valid data? Saaty andothers advise one to compare factors two by two and establish a pairwise comparison matrix. That is to say, take two factors x i and x j each time and make a ij equal to the ratio of the degree to which x i influence Z to the degree to which x j influence Z . All the results through comparison are presented by a matrix A =(a ij )n ×n , called A as the pairwise comparison matrix for judgment (judgment matrix for short) between X and Z . Clearly, if the ratio is a ij , than the ratio of the degree to which x j influence Z to the degree to which x i influence Z equalsa a ijji 1=. Definition 1 if a matrix A =(a ij )n ×n meets the following condition,(i )0>ij a , (ii) a a ij ji 1= ()n j i ,,2,1,⋅⋅⋅=It is called reciprocal matrix (it is easy to find that a ii =1, i =1,2,…,n ).As for how to determine the value of a ij , Saaty advise to use number 1 to 9 and their reciprocal as scales. Table 3 lists out the meaning of scales1 to 9:Table 3. Meaning of scalesU 32 U 3 U 2 U 1 U 31 U 11 U 12 U 22 U 23 U 24 U 25 U 21 U 26 U 27 U 42 U 43 U 44 U 45U 41 U 4ScaleMeaning 1Two factors has the same importance 3The former is a little bit more important than the latter 5The former is obviously more important than the latter 7The former is obviously more important than the latter 9The former is extremely more important than the latter 2,4,6,8Represent the median of the judgments aboveReciprocal If the ratio of the importance of factor i to that of factor j equals j i a , then the ratio of the importance of factor j tothat of factor i equals ij ji a a 1=From a psychological perspective, too many hierarchies are beyond people's judgment ability. It not only adds difficulties in making judgments, but also is prone to provide false data. Saaty and others also tried experimental method to compare the validity of people's judgments under different scales. The experiment showed that adopting scales 1 to 9 is the most appropriate.Based on the theory above, we choose proper scales and establish a judgment matrix of 4 first-grade index:UU 1 U 2 U 3 U 4 U 11 1/62 1/5 U 26 17 5 U 31/2 1/7 1 1/6 U 4 5 1/5 6 16.3 Determine weight and check consistencyWe can decide whether matrix A is consistent or not by examining whether the judgment matrix's largest eigenvalue max λequals to the amount of indexes, n. Since the largest eigenvalue continuously relies on ij a , max λis much bigger than n , and the consistency of A is more serious, so the standardized eigenvector corresponding to max λreflects less truly the proportion of the degree to which {}n x x X ,...,1= influence element Z . Thus, we need to check consistency of the judgment matrix provided by the decision maker to decide whether we can accept it.Steps to check consistency are as following:(i )calculate the index of consistency CI1max --=n n CI λ(ii )look up the corresponding mean and random index of consistency RI .Setting 9,,1⋅⋅⋅=n , Saaty gives values to RI which is shown in table 4. Table 4. The value of RIn1 2 3 4 5 6 7 8 9 RI 0 0 0.58 0.90 1.12 1.24 1.32 1.41 1.45 The value of RI is calculated in this way. Establish 500 sample matrices in a random way: choose one number randomly from 1 to 9 and their reciprocals to establish reciprocal matrices and calculate the mean of the standardized eigenvector 'max λ, and then define:1'max --=n nRI λ (iii )Calculate consistency ratio RI CI CR =When 10.0<CR , we consider the consistency of judgment matrix as acceptable, otherwise we will revise the judgment matrix.To calculate the data above in YAAHP software, we can get the largest eigenvalue max λ which equals to 4.0507, then the index of consistency:1440507.41max --=--=n nCI λ=0.0169 In order to make sure whether the judgment matrix has the satisfactory consistency, we need to compare CI with the mean and random index of consistency RI. The mean and random index of consistency of the 4-order matrix is 0.90 (table 4), so:01877.09.00169.0===RI CI CR <0.10 So the judgment matrix has satisfactory consistency. Then we employ AHP and acquire the weight of each first-grade index in this evaluation system.U ={U 1, U 2, U 3, U 4}={0.1451,0.4582,0.1188,0.2779}Which is:U =0.1451U 1+0.4582U 2+0.1188U 3+0.2779U 4We can see from the result above that, in four first-grade indexes, performance index has the biggest proportion, 45.82%. Ability index ranks second with the proportion of 27.79%. While the other two indexes have smaller proportions, which are 14.51% and 11.88% respectively.6. Model 3: Synthetical evaluation-PCA Method[4]Based on the way to acquire data introduced in model 1, we can easily find detailed data of performance index via internet. While there is no direct way to obtain data of the other three indexes. That is to say, no quantified data is available on the internet. (In fact, we can indirectly acquire the data of these three indexes through Expert Decision. Yet there are limits on time and conditions. Also, it is against the rules to seek helps from experts.) Therefore, we might as well first assume that each coach has the same indexes of sportsmanship, attitude and abilities. In other words, we only take the influence of performance index into consideration and set aside the other three indexes. We use the synthetical evaluation scores of performance index as college coaches' comprehensive competence evaluation scores. (Surely, if we can acquire quantified data of the other three indexes, we are also able to get the synthetical scores of each index by employing PCA and then determine thecomprehensive competence evaluation scores according to the weight calculated in Model 2.) Principal Component Analysis (PCA) was first introduced by Pearson in 1901 to deal with non-random variables. Hotelling popularized this method in 1933 to the realm of random variables. PCA, which is based on strict mathematical theory, differs a lot from cluster analysis.The major aim of PCA is to use less variables to explain most variations in the original data. Also, PCA will transform variables with high relevance into variables that are mutually independent or irrelevant. Usually, we choose several new variables which are less than original variables in number and can explain most variations in the original data. These new variables are also called principle components which serve as synthetical indexes to explain data. This shows that PCA is actually a way to reduce dimensions.Steps in Principal Component Analysis 7.1 Standardization of Raw DataSuppose m is the number of the index variable for Principal Component Analysis12,,,m x x x ⋅⋅⋅. The total number of the evaluation objects is n . The value of the j th index of the i th evaluation object is ij x .Standardize all the index values into ij x :,(1,2,,;1,2,,)ij jij jx x x i n j m s -==⋅⋅⋅=⋅⋅⋅in which ()()m j x x n s x n x ni j ij j n i ij j ,,2,111,121121⋅⋅⋅=⎥⎦⎤⎢⎣⎡--==∑∑==That is,j x and j s are the sample mean and sample standard deviation of the j th index.,(1,2,,)i ii jx x x i m s -==⋅⋅⋅is the standardized index variate. 7.2 Standardization of Raw Data Standardization of Raw Data Correlation Coefficient Matrix()ij m mR r ⨯=j1,(,1,2,,)1nkik k ij xx r i j m n =⨯==⋅⋅⋅-∑in which ii r =1,ij r =ji r ,and ij r is the correlation coefficient of the i th index and the j th index.7.3 Standardization of Raw Data Standardization of Raw Data Calculate the Eigenvalue of R , the Correlation Coefficient Matrix120m λλλ≥≥⋅⋅⋅≥≥ , and the corresponding eigenvectors 12,,,m u u u ⋅⋅⋅, in which12(,,,)T j j j nj u u u u =⋅⋅⋅ and the corresponding eigenvectors, in which m , the number of indexvalues composed of the eigenvectors, is11112121212122221122n n n nmm m nm n y u x u x u x y u x u x u x y u x u x u x⎧=++⋅⋅⋅+⎪=++⋅⋅⋅+⎪⎨⋅⋅⋅⋅⋅⋅⎪⎪=++⋅⋅⋅+⎩ in which 1y is the first major component, 2y is the second … and m y is the m th .7.4 Select p (p m ≤) number of major components to calculate the Comprehensive index.1)Calculate the information contribution ratio and accumulated contribution ration of Eigenvalue (1,1,,)j j m λ=⋅⋅⋅. Call1(1,2,,)jj mkk b j m λλ===⋅⋅⋅∑the information contribution ratio of major component i y ;call11pkk p mkk λαλ===∑∑the accumulated contribution ration of major components . When 0.85,0.90,0.95p α= approaches 1, select the first p index variables 12,,p y y y ⋅⋅⋅ as p major components,replacethe original m index variables, and in this way conduct a comprehensive analysis of p components.2)Calculate the Integrate Score.Definition: Z is comprehensive competence evaluation score, which represents college coaches' comprehensive competence and is identical to U 's definition.1pj j j Z b y ==∑Take the data of softball for example. We select 3 or 4 major components, and let p =3 or p =4. A major component analysis is conducted with MATLAB on the m elements, and the first a few characteristic roots and their contribution ratio of the correlation coefficient matrix are listed in Table 5. (Appendix 1 is the program code )Table 5. The Results of Major Components AnalysisNumber Characteristic Roots ContributionRatio Accumulated Contribution Ratio1 4.0577 57.9675 57.96752 1.4338 19.1971 77.16463 0.8969 12.8123 89.97694 0.6782 9.6893 99.66625 0.0121 0.1724 99.8386 6 70.0113 0.00000.1615 0.0000100.0001 100.0001From table 5 we can see that the former four principle components' accumulative contribution is 99.6662%, so we select 4 major components to evaluate comprehensively. Table 6 shows the eigenvectors of the first five characteristic roots. i thTable 6. The Eigenvectors Of the First Four Characteristic Roots of the StandardizedThe 1stEigenvector The 2nd Eigenvector The 3rdEigenvector The 4th Eigenvector 1 -0.4350 0.1311 -0.3719 -0.3400 2 -0.4950 0.0162 -0.0559 0.0364 3-0.4930-0.0706-0.0487-0.0321。
历年美国大学生数学建模竞赛试题MCM.(翻译版)doc
1985 年美国大学生数学建模竞赛MCM 试题1985年MCM:动物种群选择合适的鱼类和哺乳动物数据准确模型。
模型动物的自然表达人口水平与环境相互作用的不同群体的环境的重要参数,然后调整账户获取表单模型符合实际的动物提取的方法。
包括任何食物或限制以外的空间限制,得到数据的支持。
考虑所涉及的各种数量的价值,收获数量和人口规模本身,为了设计一个数字量代表的整体价值收获。
找到一个收集政策的人口规模和时间优化的价值收获在很长一段时间。
检查政策优化价值在现实的环境条件。
1985年MCM B:战略储备管理钴、不产生在美国,许多行业至关重要。
(国防占17%的钴生产。
1979年)钴大部分来自非洲中部,一个政治上不稳定的地区。
1946年的战略和关键材料储备法案需要钴储备,将美国政府通过一项为期三年的战争。
建立了库存在1950年代,出售大部分在1970年代初,然后决定在1970年代末建立起来,与8540万磅。
大约一半的库存目标的储备已经在1982年收购了。
建立一个数学模型来管理储备的战略金属钴。
你需要考虑这样的问题:库存应该有多大?以什么速度应该被收购?一个合理的代价是什么金属?你也要考虑这样的问题:什么时候库存应该画下来吗?以什么速度应该是画下来吗?在金属价格是合理出售什么?它应该如何分配?有用的信息在钴政府计划在2500万年需要2500万磅的钴。
美国大约有1亿磅的钴矿床。
生产变得经济可行当价格达到22美元/磅(如发生在1981年)。
要花四年滚动操作,和thsn六百万英镑每年可以生产。
1980年,120万磅的钴回收,总消费的7%。
1986 年美国大学生数学建模竞赛MCM 试题1986年MCM A:水文数据下表给出了Z的水深度尺表面点的直角坐标X,Y在码(14数据点表省略)。
深度测量在退潮。
你的船有一个五英尺的草案。
你应该避免什么地区内的矩形(75200)X(-50、150)?1986年MCM B:Emergency-Facilities位置迄今为止,力拓的乡牧场没有自己的应急设施。
- 1、下载文档前请自行甄别文档内容的完整性,平台不提供额外的编辑、内容补充、找答案等附加服务。
- 2、"仅部分预览"的文档,不可在线预览部分如存在完整性等问题,可反馈申请退款(可完整预览的文档不适用该条件!)。
- 3、如文档侵犯您的权益,请联系客服反馈,我们会尽快为您处理(人工客服工作时间:9:00-18:30)。
PROBLEM A: The Keep-Right-Except-To-Pass Rule
In countries where driving automobiles on the right is the rule (that is, USA, China and most other countries except for Great Britain, Australia, and some former British colonies), multi-lane freeways often employ a rule that requires drivers to drive in the right-most lane unless they are passing another vehicle, in which case they move one lane to the left, pass, and return to their former travel lane.
Build and analyze a mathematical model to analyze the performance of this rule in light and heavy traffic. You may wish to examine tradeoffs between traffic flow and safety, the role of under- or over-posted speed limits (that is, speed limits that are too low or too high), and/or other factors that may not be explicitly called out in this problem statement. Is this rule effective in promoting better traffic flow? If not, suggest and analyze alternatives (to include possibly no rule of this kind at all) that might promote greater traffic flow, safety, and/or other factors that you deem important.
In countries where driving automobiles on the left is the norm, argue whether or not your solution can be carried over with a simple change of orientation, or would additional requirements be needed.
Lastly, the rule as stated above relies upon human judgment for compliance. If vehicle transportation on the same roadway was fully under the control of an intelligent system –either part of the road network or imbedded in the design of all vehicles using the roadway –to what extent would this change the results of your earlier analysis?
问题A:除非超车否则靠右行驶的交通规则
在一些汽车靠右行驶的国家(比如美国,中国等等),多车道的高速公路常常遵循以下原则:司机必须在最右侧驾驶,除非他们正在超车,超车时必须先移到左侧车道在超车后再返回。
建立数学模型来分析这条规则在低负荷和高负荷状态下的交通路况的表现。
你不妨考察一下流量和安全的权衡问题,车速过高过低的限制,或者这个问题陈述中可能出现的其他因素。
这条规则在提升车流量的方面是否有效?如果不是,提出能够提升车流量、安全系数或其他因素的替代品(包括完全没有这种规律)并加以分析。
在一些国家,汽车靠左形式是常态,探讨你的解决方案是否稍作修改即可适用,或者需要一些额外的需要。
最后,以上规则依赖于人的判断,如果相同规则的交通运输完全在智能系统的控制下,无论是部分网络还是嵌入使用的车辆的设计,在何种程度上会修改你前面的结果?
PROBLEM B: College Coaching Legends
Sports Illustrated, a magazine for sports enthusiasts, is looking for the “best all time college coach”male or female for the previous century. Build a mathematical model to choose the best college coach or coaches (past or present) from among either male or female coaches in such sports as college hockey or field hockey, football, baseball or softball, basketball, or soccer. Does it make a difference which time line horizon that you use in your analysis, i.e., does coaching in 1913 differ from coaching in 2013? Clearly articulate your metrics for assessment. Discuss how your model can be applied in general across both genders and all possible sports. Present your model’s top 5 coaches in each of 3 different sports.
In addition to the MCM format and requirements, prepare a 1-2 page article for Sports Illustrated that explains your results and includes a non-technical explanation of your mathematical model that sports fans will understand.
问题B:大学传奇教练
体育画报是一个为运动爱好者服务的杂志,正在寻找在整个上个世纪的“史上最好的大学教练”。
建立数学模型选择大学中在一下体育项目中最好的教练:曲棍球或场地曲棍球,足球,棒球或垒球,篮球,足球。
时间轴在你的分析中是否会有影响?比如1913年的教练和2013年的教练是否会有所不同?清晰的对你的指标进行评估,讨论一下你的模型应用在跨越性别和所有可能对的体育项目中的效果。
展示你的模型中的在三种不同体育项目中的前五名教练。
除了传统的MCM格式,准备一个1到2页的文章给体育画报,解释你的结果和包括一个体育迷都明白的数学模型的非技术性解释。