跨国公司内部贸易
公司内贸易名词解释

公司内贸易名词解释“公司内贸易”(intra-firm trade)是指在公司内部进行的交易,其交易额被认为是内部交易,而不是以往所说的公司间贸易(extra-firm trade)。
公司内贸易有广义和狭义之分:公司间贸易(intra-firm trade)又称公司外贸易(extra-firm trade),是指在两个或更多的公司之间进行的贸易,即双方都不是该行业的企业,但由于某种原因两家公司进行了业务往来,并对这种交易活动认为是公司间的贸易。
一般是由供应商向零售商提供产品,由零售商再向消费者转售。
例如一个美国商人想在国内采购,需要联系到另一个国家的商人。
如果他通过自己的零售店向美国人销售,则属于公司内贸易,这种交易就不能纳入全球贸易的范围,只有通过中介商或其他渠道完成才能算作全球贸易。
全球贸易包括两类:①跨国公司与母国(外国)政府达成协议,要求子公司提供商品给母公司,然后母公司再把这些商品卖给其他子公司; ②当外国政府向母公司出口商品时,母公司可能与外国政府达成协议,母公司收购外国政府的出口产品,然后出售给子公司,由子公司再将这些产品卖给母公司,这也是全球贸易。
全球贸易按主要运输方式的不同,可分为海运、空运、陆运等形式,而按照货物流程的不同,又可分为加工贸易和一般贸易两种。
(1)报酬方式。
指参与国际分工,各国必须付出的代价及其付出的代价大小。
一般来说,发展中国家付出的劳动力代价最高。
(2)规模经济性。
指生产某种产品的单位成本随着产量增加而下降。
(3)对外贸易的利益。
指出口某种商品,比进口该种商品获得的利益大。
(4)学习效应。
指从事出口贸易比从事进口贸易所需掌握的知识少。
(5)发展阶段。
指从事贸易时的工业水平。
(2)报酬方式。
国际间的商品流通是以不同货币表示的不同商品的流通,而不同国家的商品流通也是以不同货币表示的不同商品的流通。
所谓贸易商品是指在一定时期内具有相同的使用价值,且互为替代品的商品,在这里,替代品表现为商品的使用价值,且以劳务为限。
跨国公司对国际贸易影响

跨国公司对国际贸易的影响一、使国际分工演变为世界分工(一)跨国公司通过其国外直接投资,把子公司所在各国纳入国际分工体系。
如美国福3特与日本马自达合作生产几种型号的小轿车,并允许对方冠以自己的牌名分别在北美洲和亚洲销售,这样使双方顺利扩大了各自的市场。
(二)20世纪90年代以后,跨国公司通过加强和完善国际生产体系,使国际分工向众深发展。
1、跨国公司可以将包括各种服务功能在内的生产过程的不同部分在全球进行部署,使成本资源、物流和市场有机结合,通过最佳的地理布局提高竞争力,使世界市场日益建立在由跨国公司统一指挥的整个生产体制之间的竞争,而不是个别工厂或企业之间的竞争。
2、加强国际生产体制的市场的治理,包括从提供直接管理性监督的所有权联系,各种非产权来县,如把原先独立的中介人(供应商、制造商和分销商)通过诸如特许经营、发挥许可证、分包、营销合同、共同技术标准、基于信任的业务关系联系起来。
3、使全球价值链更加完善。
跨国公司日益重视价值链中知识密集度,从而更为重视产品质量、研究和开发、管理服务,以及营销和品牌管理等。
4、使国际生产体系日益细化。
跨国公司日益倾向于更加细致的专业化,将越来越多的功能发包给分布在全世界独立的公司去做,以便利用物流和成本方面的差别。
有些公司甚至完全退出生产,让合同制造商去从事生产、自己则集中精力在研究开发和营销方面。
二、对东道国贸易发展有巨大影响(一)跨国公司有利于扩大东道国出口(二)跨国公司帮助发展中国家和经济转型国家拓展市场跨国公司通过产权和非产权关系,使外国直接投资生产的产品成为最有活力的出口产品,使这些国家成为出口优胜国。
三、跨国公司使国际贸易结构不断优化1、跨国公司对外直接投资主要集中在制造业部门,尤其在资本、技术密集型产业,这就直接影响着国际贸易商品结构的变化,反映在世界货物构成中,制成品贸易所占比重上升,初级产品所占比重下降。
2、跨国公司内部专业化协作的发展使制成品贸易中中间产品贸易比重不断上升。
美国1997至2005年跨国公司内部贸易数据
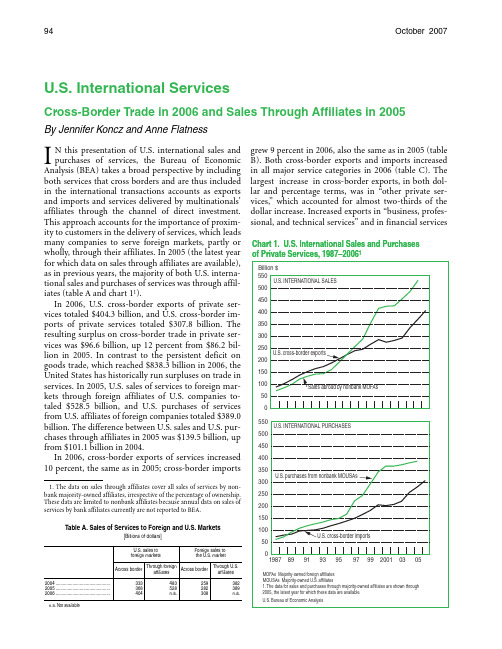
94 October 2007U.S. International ServicesCross-Border Trade in 2006 and Sales Through Affiliates in 2005By Jennifer Koncz and Anne FlatnessI N this presentation of U.S. international sales andpurchases of services, the Bureau of EconomicAnalysis (BEA) takes a broad perspective by includingboth services that cross borders and are thus includedin the international transactions accounts as exportsand imports and services delivered by multinationals’affiliates through the channel of direct investment.This approach accounts for the importance of proximity to customers in the delivery of services, which leadsmany companies to serve foreign markets, partly orwholly, through their affiliates. In 2005 (the latest yearfor which data on sales through affiliates are available),as in previous years, the majority of both U.S. international sales and purchases of services was through affiliates (table A and chart 11).In 2006, U.S. cross-border exports of private services totaled $404.3 billion, and U.S. cross-border imports of private services totaled $307.8 billion. Theresulting surplus on cross-border trade in private services was $96.6 billion, up 12 percent from $86.2 billion in 2005. In contrast to the persistent deficit ongoods trade, which reached $838.3 billion in 2006, theUnited States has historically run surpluses on trade inservices. In 2005, U.S. sales of services to foreign markets through foreign affiliates of U.S. companies totaled $528.5 billion, and U.S. purchases of servicesfrom U.S. affiliates of foreign companies totaled $389.0billion. The difference between U.S. sales and U.S. purchases through affiliates in 2005 was $139.5 billion, upfrom $101.1 billion in 2004.In 2006, cross-border exports of services increased10 percent, the same as in 2005; cross-border imports1. The data on sales through affiliates cover all sales of services by nonbank majority-owned affiliates, irrespective of the percentage of ownership.These data are limited to nonbank affiliates because annual data on sales ofservices by bank affiliates currently are not reported to BEA.Table A. Sales of Services to Foreign and U.S. Markets[Billions of dollars]U.S. sales to foreign markets Foreign sales to the U.S. marketAcross border Through foreignaffiliates Across border Through U.S. affiliates2004 ............................................. 2005 ............................................. 2006 (333)368404483528n.a.259282308382389n.a.n.a. Not available grew 9 percent in 2006, also the same as in 2005 (table B). Both cross-border exports and imports increased in all major service categories in 2006 (table C). The largest increase in cross-border exports, in both dollar and percentage terms, was in “other private services,” which accounted for almost two-thirds of the dollar increase. Increased exports in “business, professional, and technical services” and in financial services Chart 1. U.S. International Sales and Purchases195 October 2007 S URVEY OF C URRENT B USINESScontributed the most to the increase in “other privateservices” exports. The next largest increase was in“other transportation,” which includes services provided by ocean, air, land, pipeline, and inland waterway carriers to transport goods to and from the UnitedStates and between foreign ports. The largest increaseTable B. Sales of Services to Foreign and U.S. Markets ThroughCross-Border Trade and Through AffiliatesThrough cross-bordertrade 1Through nonbank majority-owned affiliates 2U.S. exports (receipts) U.S. imports(payments)Sales to foreignpersons byforeignaffiliates of U.S.companies 3Sales to U.S.persons by U.S.affiliates offoreigncompanies Billions of dollars1986 ...................................................... 1987 ...................................................... 1988 ...................................................... 1989 ...................................................... 1990 ...................................................... 1991 ...................................................... 1992 ...................................................... 1993 ...................................................... 1994 ...................................................... 1995 ...................................................... 1996 ...................................................... 1997 ...................................................... 1998 ...................................................... 1999 ...................................................... 2000 ...................................................... 2001 ...................................................... 2002 ...................................................... 2003 ...................................................... 2004 ...................................................... 2005 ...................................................... 2006 ......................................................1987 ......................................................77.587.0101.0117.9137.2152.4164.0171.6186.7203.7222.1238.5244.4265.1284.0272.8279.6290.2333.0367.8404.364.773.981.085.398.299.9103.5109.4120.3128.7138.8151.5165.6183.0207.4204.1209.0221.9259.2281.6307.860.572.383.899.2121.3131.6140.6142.6159.1190.1223.2255.3286.1(5) 353.2413.5421.7423.5452.5483.0528.5n.a.n.a.62.673.294.2109.2119.5128.0134.7145.4149.7168.4(4) 223.1245.5293.5344.4367.6367.6374.1382.0389.0n.a.Percent change from prior year12.2 14.2 19.5 ........................1988 ...................................................... 16.0 9.5 15.9 17.0 1989 ...................................................... 16.8 5.3 18.4 28.7 1990 ...................................................... 16.4 15.1 22.2 15.9 1991 ...................................................... 11.1 1.8 8.5 9.5 1992 ...................................................... 7.6 3.5 6.8 7.1 1993 ...................................................... 4.6 5.8 1.5 5.3 1994 ...................................................... 8.8 9.9 11.6 8.0 1995 ...................................................... 9.1 7.0 19.4 2.9 1996 ...................................................... 9.0 7.8 17.4 12.5 1997 ...................................................... 7.4 9.1 14.4 (4) 1998 ...................................................... 2.5 9.4 12.0 10.1 1999 ...................................................... 8.5 10.5 (5) 19.6 2000 ...................................................... 7.1 13.3 17.1 17.3 2001 ...................................................... –3.9 –1.6 2.0 6.7 2002 ...................................................... 2.5 2.4 0.4 (*) 2003 ...................................................... 3.8 6.2 6.8 1.8 2004 ...................................................... 14.7 16.8 (6) 6.7 2.1 2005 ...................................................... 10.5 8.7 9.4 1.9 2006 ...................................................... 9.9 9.3 n.a. n.a.n.a. Not available.* A non-zero value between –0.05 and 0.05 percent.1. The estimates for 2003–2005 are revised from those published in last year’s article in this series. See Christopher L. Bach, “Annual Revison of the U.S. International Accounts, 1997–2006,” S URVEY OF C URRENT B USINESS 87 (July 2007): 37–53.2. The estimates for 2004 are revised from those published in last year’s article. The estimates for 2005 are preliminary.3. The figures shown in this column for 1986-88 have been adjusted, for the purposes of this article, to be consistent with those for 1989 forward, which reflect definitional and methodological improvements made in the 1989 Benchmark Survey of U.S. Direct Investment Abroad. The primary improvement was that investment income of affiliates in finance and insurance was excluded from sales of services. The adjustment was made by assuming that investment income of finance and insurance affiliates in 1986–88 accounted for the same share of sales of services plus investment income as in 1989.4. Beginning in 1997, sales by U.S. affiliates were classified as goods or services based on industry codes derived from the North American Industry Classification System; the estimates for prior years were based on codes derived from the 1987 Standard Industrial Classification System. This change resulted in a redefinition of sales of services by affiliates, which resulted in a net shift of sales from goods to services. See the box “Changes in the Definition and Classification of Sales of Services by U.S. Affiliates” in the October 1999 S URVEY, page 61.5. Beginning in 1999, sales by foreign affiliates were classified as goods or services based on industry codes derived from the North American Industry Classification System; the estimates for prior years were based on codes derived from the 1987 Standard Industrial Classification System. This change resulted in a redefinition of sales of services by affiliates, which resulted in a net shift of sales from goods to services. See the box “Changes in the Definition and Classification of Sales of Services by Foreign Affiliates” in the November 2001 S URVEY, page 58.6. In 2004, BEA began to require that the nonbank units of U.S. banks (including bank and financial holding companies), which were required to file separately in the past, be consolidated on the reports of the banks that owned them. Because the data on sales of services abroad cover only sales by affiliates of nonbank U.S. parents, the change in reporting requirements caused the affiliates of the affected parents to drop out of the data. As a result, the measured change in sales between 2003 and 2004, as computed from the table above, was reduced by about 2 percent. After allowing for the effects of the change, the increase in 2004 would have been about 9 percent. (A parallel change was introduced in the series on sales by U.S. affiliates of foreign companies in 2002, but it did not result in a material discontinuity in the estimates.)Table C. Cross-Border Services[Percent change from the preceding year]Exports Imports2005 2006 2005 2006 Private services ..............................................Travel ......................................................Passenger fares......................................Other transportation................................Royalties and license fees ......................Other private services.............................1010111291110561251495614699455717 in cross-border imports, in both dollar and percentage terms, was in “other private services,” mainly reflecting increases in “business, professional, and technical services” and in insurance.U.S. sales of services abroad through foreign affiliates of U.S. companies increased 9 percent in 2005 after increasing 7 percent in 2004.2 This marked the third straight year of strong sales growth, following a historical low of less than 1-percent growth in 2002. Sales of services abroad by foreign affiliates grew strongly across all geographic areas and several industry sectors. The largest increases were for affiliates in “finance (except depository institutions) and insurance” and in “professional, scientific, and technical services.” For affiliates in some countries, depreciation of the dollar against local currencies, particularly the Canadian dollar and the euro, boosted sales in dollar terms. However, increases in sales by affiliates were to a large extent driven by industry-specific factors. For example, the increase in “finance (except depository institutions) and insurance” reflected a pickup in activity in financial markets, higher commissions for commodities trading due to increased prices, and increased demand for insurance products in the Asia and Pacific region.U.S. purchases of services from the U.S. affiliates of foreign multinational companies grew 2 percent for the third consecutive year after having slowed to almost no increase in 2002. The pattern of slow growth in recent years contrasts with the period 1998–2000, which was characterized by very rapid growth. During that period, net additions to the affiliate universe resulting from a boom in international merger and acquisition activity boosted sales of services. In contrast, in recent years the pace of new investment by foreign companies has been slower.In 2005, increases in U.S. purchases of services were largest in administration, support, and waste management and in transportation and warehousing. Shifts in 2. After accounting for the effects of a change in reporting requirements for the nonbank units of U.S. banks, the increase in 2004 would have been about 9 percent. For more information on this change, see footnote 6 in table B in this article and the box “The 2004 Benchmark Survey of U.S. Direct Investment Abroad and the Treatment of Nonbank Units of Banks” in Jennifer Koncz, Michael Mann, and Erin Nephew, “U.S. International Services: Cross-Border Trade in 2005 and Sales Through Affiliates in 2004,” S URVEY OF C URRENT B USINESS 86 (October 2006): 19.96 U.S. International Services October 2007some affiliates’ activities to focus on services rather than on manufacturing, contributed to the increase.3 Overall growth in sales was dampened by decreases in information. In this sector, corporate restructurings resulted in some previously majority-owned affiliates becoming minority-owned and therefore exiting the sales-through-affiliates data set, which covers only majority-owned U.S. affiliates.It is difficult to compare precisely international services delivered through cross-border transactions with those delivered through affiliates because of differences in coverage, measurement, and classification. For example, data on cross-border sales and purchases of services are collected and published by type of service, whereas data on sales through affiliates are published by primary industry of the affiliate.4 Despite these differences, the large gap between sales through cross-border transactions and through affiliates suggests that the latter is the larger channel for both U.S. sales and U.S. purchases of private services in international markets (charts 2 and 3).The remainder of this article consists of four main sections. The first section presents preliminary estimates of cross-border exports and imports of private services for 2006 and revised estimates for 2003–2005. The second section presents preliminary estimates of sales through affiliates for 2005 and revised estimates for 2004. The third section discusses revisions to the estimates, and the fourth section highlights improvements to the estimates of international services.U.S. Cross-Border Trade in 2006U.S. exports of private services (receipts) increased 10 percent to $404.3 billion in 2006 after increasing 10 3. Because BEA data on sales through affiliates are classified by primary industry of activity, the shift in composition of affiliates’ activities led some affiliates to be classified out of manufacturing and into other sectors in 2005. The reclassification of an affiliate increases sales of services in the industry to which it is classified and decreases sales of services in the industry from which it was classified, but in and of itself it does not affect the overall year-to-year change in sales of services abroad. However, for affiliates that were reclassified into the administration, support, and waste management sector and the transportation and warehousing sector, sales of services rose in 2005. Thus, overall sales of services increased, not just sales of services in the sectors to which affiliates were classified, as a result of growth in the activities of these affiliates.4. One source of difference in coverage has been the inclusion of services provided by banks in the cross-border data but not in the data on sales of services through affiliates, which is limited to sales by nonbank affiliates and, in the case of U.S. multinationals’ foreign affiliates, nonbank affiliates with nonbank parents. BEA is working to address this data gap. In its most recent benchmark surveys for U.S. direct investment abroad and foreign direct investment in the United States, BEA collected data needed to estimate sales of services through bank affiliates, and it has proposed to introduce coverage of banks in its annual survey of U.S. direct investment abroad, beginning with data for 2007. An example of a difference in measurement has been the estimation of insurance services, which is also being addressed by BEA with the collection of new data items on insurance beginning with the most recent benchmark surveys and continuing in the follow-on annual surveys. For more information, see the box “Supplemental Measures of Insurance, Trade Services, and Financial Services Sold through Affiliates.” percent in 2005. U.S. imports of private services (payments) increased 9 percent to $307.8 billion after increasing 9 percent. The services surplus increased 12 percent in 2006, down from a 17-percent increase in 2005. The services surplus increased for the third straight year.Growth in both exports and imports of services remained strong in 2006. Increases in real gross domestic product (GDP) growth of major U.S. trading partners contributed to the continued growth in exports. In the United Kingdom, real GDP growth rose to 2.8 percent from 1.8 percent; in the euro area, it rose to 3.0 percent from 1.8 percent, and in Japan, it rose to 2.2 percent from 1.9 percent. Real G DP growth in Canada fell slightly, to 2.8 percent from 3.1 percent. GDP growth in the United States also slowed slightly in 2006, falling to 2.9 percent from 3.1 percent. Despite this slowdown, U.S. demand for services imports remained strong.U.S. cross-border trade in services was also affected by changes in the foreign-currency value of the dollar. In 2006, the dollar depreciated 6 percent against the Canadian dollar, less than 1 percent against the euro, and 1 percent against the British pound.5 The dollar appreciated 6 percent against the Japanese yen and less than 1 percent against the Mexican peso. The depreciation of the U.S. dollar against the Canadian dollar and the euro continued a trend in recent years.Much of the growth in both exports and imports of private services in 2006 was accounted for by increases in “other private services,” especially in “business, professional, and technical services.” Financial services also contributed significantly to the growth in receipts, while insurance services contributed significantly to the growth in payments. Growth in both receipts and payments for travel and passenger fares slowed in 2006; growth in receipts slowed more than growth in payments. G rowth in receipts for “other transportation” matched the growth recorded in 2005, but growth in payments slowed.Trade with Europe and Asia and Pacific accounted for two-thirds of total U.S. cross-border exports and imports of private services in 2006 (chart 4). The United Kingdom, Japan, Canada, Germany, and Mexico continued to be the largest services trading partners of the United States (table D). Services trade with China and India continued to grow rapidly in comparison with services trade with most other countries. U.S. services exports to China and India increased over 20 percent in 2006.Trade within multinational companies (affiliated trade) accounted for 26 percent of U.S. exports of private services in 2006 and for 23 percent of U.S. imports of private services. Affiliated exports of private services 5. Annual exchange rates are period averages.97October 2007S URVEY OF C URRENT B USINESSincreased 9 percent in 2006 after increasing 10 percent in 2005. Affiliated imports of private services increased 15 percent after a 16-percent increase. Additional information on affiliated trade in services is available in table E.TravelReceipts. U.S. travel receipts increased 5 percent to $85.7 billion in 2006 after increasing 10 percent in 2005. Although growth in travel receipts slowed, 2006 marked the third straight year of growth following 3 years of declines. Most of the slowdown in 2006 was attributable to slower growth in travel receipts from overseas (countries other than Canada and Mexico). Chart 2. U.S. International Sales and Purchases U.S. International Sales and Purchases of Services by Major Area in 2005Growth in receipts from visitors from overseas fell to 3 percent in 2006 from 9 percent in 2005, as the number visitors declined slightly, following 2 years of growth. The number of visitors from Japan declined 5 percent in 2006, following an increase of 4 percent in 2005, leading to a drop in receipts from Japan. Receipts from the rest of Asia and the Pacific, however, increased, driven by a 7-percent increase in the number of visitors. The number of visitors from Europe declined 2 percent in 2006, following a 7-percent increase in 2005, leading to slowed growth in receipts from Europe.Travel receipts from Canada grew 14 percent to $10.3 billion in 2006, matching the 2005 growth rate. The number of travelers from Canada grew 6 percentChart 3. U.S. International Sales and Purchases Chart 3. U.S. International Sales and Purchases of Services by Major Country in 2005of Services by Major Country in 200598U.S. International Services October 2007in 2006, a slightly faster rate than in 2005. Average spending by Canadian visitors also increased, although at a slightly slower rate than in 2005. The appreciation of the Canadian dollar against the U.S. dollar likely contributed to the continued strong growth in travel receipts from Canada.Travel receipts from Mexico increased 5 percent in 2006 after increasing 8 percent in 2005. Receipts from travel to the interior of the United States accounted for all of the growth in receipts from Mexico. Receipts from visitors to the U.S. interior increased 15 percent, up from 12 percent in 2005, reflecting increases in both the number of visitors and their average expenditures. In contrast, travel receipts from border visitors showed no growth in 2006, as an increase in average expenditures was offset by a decrease in the number of visits.Payments. U.S. travel payments increased 4 percent to $72.0 billion in 2006, after increasing 5 percent in 2005. Like travel receipts, travel payments increased for the third straight year after declining for 3 years. Growth in travel payments to overseas countries (other than Canada and Mexico) slowed to 5 percent in 2006 from 6 percent in 2005. Growth in the number of U.S. visitors overseas slowed slightly in 2006, partly reflecting higher airfares and the depreciation of the dollar. The slowdown in the number of visitors more than offset a slight increase in average expenditures, partly reflecting increased costs facing those who chose to travel. The slowdown was particularly pronounced in payments to Europe, especially the United Kingdom, and Asia and Pacific.Travel payments to Canada increased 2 percent in 2006 after decreasing 2 percent in 2005. The number of travelers to Canada decreased 9 percent, continuing a trend of decreasing U.S. travel to Canada that began in 2000. In 2006, a 6-percent depreciation of the U.S. dollar against the Canadian dollar and high gasoline prices were factors contributing to the decrease. However, the drop in the number of travelers was more than offset by an increase in average expenditures. The increase in U.S. travelers’ average expenditures may be partly the result of the above-mentioned developmentsTypes of Cross-Border Services: Coverage and Definitions—ContinuesThe estimates of cross border transactions cover both travel between the United States and foreign countries affiliated and unaffiliated transactions between U.S. resi-and between foreign points, the fares received by dents and foreign residents. Affiliated transactions U.S. vessel operators for travel on cruise vessels, and the consist of intrafirm trade within multinational compa-fares paid by U.S. residents to foreign air carriers for nies—specifically, the trade between U.S. parent compa-travel between the United States and foreign countries nies and their foreign affiliates and the trade between and to foreign vessel operators for travel on cruise ves-U.S. affiliates and their foreign parent groups. Unaffili-sels.ated transactions are with foreigners that neither own, “Other transportation.” These accounts cover U.S. nor are owned by, the U.S. party to the transaction. international transactions arising from the transporta- Cross border trade in private services is classified in the tion of goods by ocean, air, land (truck and rail), pipe-same five broad categories that are used in the U.S. inter-line, and inland waterway carriers to and from the United national transactions accounts—travel, passenger fares, States and between foreign points. The accounts cover “other transportation,” royalties and license fees, and freight charges for transporting exports and imports of “other private services.” goods and expenses that transportation companies incur Travel. These accounts cover purchases of goods and in U.S. and foreign ports. Freight charges cover the services by U.S. persons traveling abroad and by foreign receipts of U.S. carriers for transporting U.S. exports of travelers in the United States for business or personal rea-goods and for transporting goods between foreign sons. These goods and services include food, lodging, points and the payments to foreign carriers for transport-recreation, gifts, entertainment, local transportation in ing U.S. imports of goods. (Freight insurance on goods the country of travel, and other items incidental to a for-exports and imports is included in insurance in the eign visit. U.S. travel transactions with both Canada and “other private services” accounts.)Mexico include border transactions, such as day trips for Port services consist of the value of the goods and sershopping and sightseeing. vices purchased by foreign carriers in U.S. ports and by A “traveler” is a person who stays less than a year in a U.S. carriers in foreign ports.country and is not a resident of that country. Diplomats Royalties and license fees. These accounts cover trans-and military and civilian government personnel are actions with nonresidents that involve patented and excluded regardless of their length of stay; their expendi-unpatented techniques, processes, formulas, and other tures are included in other international transactions intangible assets and proprietary rights used in the pro-accounts. Students’ educational expenditures and living duction of goods; transactions involving trademarks, expenses and medical patients’ expenditures for medical copyrights, franchises, broadcast rights, and other intancare are included in “other private services.” gible rights; and the rights to distribute, use, and repro-Passenger fares. These accounts cover the fares duce general use computer software.received by U.S. air carriers from foreign residents for。
跨国公司内部贸易的经济学分析
置 资 源 ,生 产 规 模 的 确 定 不 受 特 定 国家 或 地 区市 场 容 量 的 限 制 ,更 易 达 到 或 接 近 经 济 规 模 。大 型跨 国 公 司 一 般 实行 统 一 采 购 、 一 统
大 型跨 国 公 司 资 产 额 大 、 售 额 多 、雇 销 员 人 数 众 , 是 一 个 独 立 运 行 的 庞 大 的 经 济 体 。 些 大 型跨 国 公 司 的 年 销售 额甚 至 高 于 某
维普资讯
跨 国 公 司 内 部 贸 易 硇 经 济 学 分 析
李 春 华
( 中科技 大 学 , 华 湖北
摘
武汉
407 ) 3 0 4
要 目前 , 全世 界 共 有 6 3万 家跨 国公 司, 9万 家境 外 分 支 机 构 。 国公 司 已经 成 为 最 重要 的 非 国 家 经 济 体 , 、 6 跨 在
国 际经 济 乃 至政 治 上扮 演 着 越 来 越 重要 的 角 色。 2 而 O世 纪 9 O年 代 全 球 跨 国公 司 内部 贸 易 占世 界 贸 易 总 额 的 比 重 已经 达
到 3 % , 国公 司 贸 易 内部 化 是 追 求 权 力和 财 富 的 必 然 结 果 3 跨
关 键 词 公 司 内部 贸 易 财 富权 力 权 力
乏 的 。跨 国 公 司 将 生 产 中 上 游 和 下 游 活 动 置 于 公 司 的 统 一 控 制 下 , 过 内 部 调 拨 把 它 们 通 联 系起 来 ,可 保 证 生 产 投 入 的 供 应 和 产 品 的 销 售 ,使 得 生 产 活 动 能 够 持 续 进 行 。 通 过 对 原 料 、相 应 的 资 本 来 源 、 品 生 产 及 销 售 市 产 场 的控 制 来 实 现 对 权 力 的追 求 。
国际贸易 第十三章 跨国公司与国际贸易

第三节 跨国公司对当代国际贸易的影响
(1)跨国公司推动了国际贸易的大发展 2001年,跨国公司的贸易额已占全球贸易总额的4 0%,跨国公司的销售额从1980年的30000亿美元 增加到140000亿美元,是国与国之间贸易总额的2 倍多。跨国公司实行的全球贸易策略,既拓展了自 己的发展空间,又有力地促进全球市场体系的形成, 推动了全球贸易的发展。 (2)跨国公司对国际贸易商品结构和地理方向的影 响; (3)跨国公司促进了技术贸易的迅速增长; (4)跨国公司在促进自由贸易和自由竞争的同时, 也一定程度地制造了国际贸易中的障碍和垄断。
(4)运行方式开放化 跨国公司通常把营运过程的各个阶段全部地 或部分地放在海外进行,所以其运行方式是 外向、开放型的。
(5)生产经营跨国化 跨国公司的资本、商品、人才、技术、管理和信息 等 “一揽子活动”是在母公司控制下在世界范围内 进行。 跨国公司的国内外经济活动关系紧密并有其必然性: 一方面,国外子公司受制于国内母公司,另一方面, 母子公司的业务在分工协作的基础上融为一体,相 辅相成。 跨国公司的许多涉外经济活动是在公司内部进行的, 如母公司与子公司之间、子公司与子公司之间。
从投资的行业看,二战前,跨国公司在海外重点投资 于矿业和石油业等初级产品部门;二战后,投资重点 逐渐转移到了制造业和服务业。1989年,制造业投 资所占比重为41.7%,服务业为38.4%,初级产品加 工业为16.9%。 进入70年代后,一些发展中国家和地区不断增加对 外直接投资,到2005年,全球范围对外直接投资为 9160亿美元,其中发展中国家的对外直接投资约为 1200亿美元。属于发展中国家和地区的跨国公司, 1988年有1000多家,设在国外的子公司和分支机构 约5000家。1996年分别约为7900家和13万家。 2005年世界跨国公司100强中有5家来自发展中国家。
在华跨国公司内部贸易对中国经济的负面影响分析

在 华 跨 国 公 司 内 部 贸易 对 中 国 经 济 的 负 面 影 响 分 析
姚 宏 丽
( 首 都 经济 贸 易大 学 。北 京 1 0 0 0 7 0 )
【 摘 要 】随着经济一体化的发展,跨 国公 司的国际贸易在世界贸 易中的地位 日 益突 出,而跨 国公 司内部化贸易也 以其 巨大的规模及其特有 的方式与特征 影响 着东道国、投 资国,乃至整个世界经济。但是 ,跨 国公司的为追 求利 润最大化,通过 与关联企业的内部化 贸易将大量利润移 至海外 ,出现 了 账面亏损,实际 盈利 的假象 。因此 ,跨国公司在我国开展 内部化贸易规模 不断扩 大的形势下,对 其内部化贸易进行探讨 ,以应对跨国公 司内部化贸易给我 国经济带来的不利 影响十分 重要。 【 关键词】跨国公司;内部化贸易;转移价格
子 公 司的 竞争 地位 。 ( 3 )增 强 公 司垄 断地位 当 子 公 司 处 于 市 场 占 领 阶 段 时 ,跨 国 公 司 通 过 内 部 化 贸 易 以 低 价 向这 一子 公 司提供 原 材料 或产 品 , 降低 该 子公 司 的生产 成本 或 销 售 价 格 , 帮 助 它 占据 当地 市 场 。 当 市 场 处 于 完 全 竞 争 条 件 下 时 , 公 司 内 部 化 贸 易 既 无 必 要 也 无 优 势 可 言 。而 在 市 场 集 中 度 高 ( 卖 方 或 买 方 垄 断 ) 的 行 业 或 部 门 ,跨 国 公 司 通 过 公 司 内 部 交 易 , 一 方 面 依 靠 自身 的综合 生 产 营销 实力 ,垄 断上 游产 品 的生 产 ,制定 较高 的 内 部 化 贸 易 价 格 , 从 初 级 产 品 中 获 取 高 额 利 润 ; 另 一 方 面 提 高 了 产 品 下游 阶段 的进 入壁 垒 ,有 力阻止 新 的竞争 者 的进入 。 ( 4)获得 融 资优 势 跨 国 公 司 所 需 的 资 金 来 源 于 内 部 积 累 和 外 部 筹 借 ,但 它 外 部 筹 借 的 范 围 更 广 、 方 式 更 多 、 成 本 更 低 。 在 西 方 大 型 跨 国 公 司 中 ,外 部 筹 资 占较 大 的 比例 ,它 可 以在 成 本 最 低 的地 区融 资 ,在 收益 最 高 的 地 方投 资 。大 型 跨 国 公 司具 有 较 高 的 资信 等 级 及 很 强 的利 用 不 同区 位利 率 和 成 本 差 的 能力 ,可 以帮 助 子 公 司及 时 地 以 较 低 的成 本 筹借 所 需资 金 。此 外 ,各 国 的金 融 自由化 及 外 汇 管 理 自 由化 和 科 学 技术 的进 步 也 为跨 国公 司拓 展 外 部 筹 资创 造 了 良好 的外部 条 件 。 四 、跨 国公 司 内部 交易 对我 国 经济 的负 面影 响 ( 1 )减 少我 国的税 收 收入 ,侵 吞 中方 利益 当 前 , 我 国 对 外 资 企 业 征 收 的 所 得 税 税 率 低 于 美 国 、 日 本 等 发 达 国 家 , 但 高 于 巴 哈 马 、 百 慕 大 等 避 税 地 的 实 际 税 负 。 因 此 , 跨 国 公 司 往 往 通 过 “高 进 低 出 ” 的 转 移 价 格 转 移 其 子 公 司 的 利 润 ,从 而逃 避 税 收 。 更为 严 重 的是 ,许 多跨 国公 司 在 “避税 天 堂 ”设立 象征 性 的 分 支 机构 或 子 公 司 ,从 而 有计 划 地 进 行 内部 化 贸 易 ,通 过 账 面 上 的 周 转使 得 卖 者 子 公 司 “ 低 价 ” 出售 而 无利 , 买者 子 公 司高价 购 买亦 无赢 利 ,从 而减 少 了东 道 国税 收收 入 。 此 外 ,我 国外 资 企业 中合 资 企 业 和 合作 企 业 都 占 了不 少 的数 目 , 外 方 通 过 转 移 价 格 操 纵 企 业 利 润 , 使 企 业 利 润 减 少 , 甚 至 出 现 “ 零 利 润 ” 或 “负 利 润 ” , 侵 吞 中 方 利 益 , 却 使 外 方 公 司 的 总 体 收 益实 现 了 “ 虚 亏 实 盈 ” , “中 亏 外 盈 ” 的 目标 。 ( 2)跨 国 公 司 在 华 部 分 行 业 的 垄 断 优 势
跨国公司内部交易的转移定价分析
①
P o l i c y o p t i o n s f o r e n h a n c i n g t h e p r o d u c t i v e c a p a c i t y a n d i n t e r n a t i o n a l
c o mp e t i t i v e n e s s o f S ME s[ E B / O L] .h t t p:/ / u n c t a d .o r g / e n fP a g e s /
者 单位 :北 京 大 学 经 济 学 院 )
除了与上述动机相关联 ,还可能是 出于避免引起东道 国政府注意 ,从 而 丧失其政府扶持等等其他原 因。 四 、跨 国 公 司 转 移 定 价 的 限制 与 约 束 跨国公司的 内部交易虽然给跨 国公司带来诸 多便利 和利益 ,但其 在 定程度上打乱 了传统 的贸易格局 ,使得 国际贸易关 系更趋复 杂化。虽 然跨国公司的规模庞大 、组织结构复杂决定 了其 自身必须 要有一定 的制 度约柬保持公司 的持续稳定经 营,也会有 自身的经 营管 理约束 ,而不能 在 内部交易的转移定价上任意行事 。但转移 价格 的手段 ,确实易 于达到 跨国公司的特定 目 标 ,如将 资金利 润转 出东道 国、逃 避东 道 国的税 收 、 绕过东道 国的关税壁垒等等使得东道 国的利 益受损 。 正 因为跨 国公 司可 以很 容易的从 内部 交易中获取超额利润 ,故各 国 政府也在为 了防止企业 的这种行 为逃避税 收等给东 道国带来损 失 ,从而 对转移定价有着严格 的监管措施 ,税 务当局更是 对跨国企业转移 定价有 严 格 的审 查 并 对 逃 税 行 为予 以 惩 处 。 2 0 1 0年 ,多家法 国媒体 向政府反映谷 歌通过 他们 的产 品获取 利润 , 却没有支付任何 费用 , 法 国文化部出台报告称 ,法国应该 向互 联网公 司 征收广告 收入税 以补 贴本 国的文 化产业 。这项 税被形 象地 称为 “ 谷歌
跨国公司内部贸易对中国国际收支的影响
一
发展 中 国家和 地 区,子 公司相 当 于公 司全球 一 体化 生产 网络 中的 个 节点 , 中 国正是世 界上 最大 的 出 口加 工 、 而 初级 制造基 地 , 跨
国公 司纷 纷选 择 中国 为其投 资对 象 , 国公司 在中 国的 内部 贸易 跨
也 无法 分辨 出哪 些属于 跨 国公 司 内部贸 易 , 关机 构预 估其 比重 相 占 7 %一 %, 有一 点可 以肯 定 , 0 8 但 0 以转移价 格为 代表 的内部 贸易从 发 生次 数 、 贸易额 、 易量等 每 年都 在急速 上 升 , 无疑 有利 于我 贸 这
国进 出 口贸 易量 的增加 和 贸 易额 的增 长 ,反映 出贸 易规模 不 断扩 大 , 由于 转移 定价 出于跨 国公司 内部考虑 , 往价 格低 于市场 价 但 往
格, 加之 中 国是加工 贸 易基地 、 级产 品制 造大 国 , 初 牛产利 益往 往 流入 发达 国 家,因此 实 际增加 的 贸易额 比正常价 格交 易增 加 的贸
易额 小得 多 。
支地位 不 断提 高 , 国际收支 构成 变化 显著 , 国国 际收支 甲衡 追求 我 的战略 目标不仅 是某一年 度 的短 期平衡 , 重要 的是 中长期 ( 23 而 如 - 年 ,- 35年) 内保持 的 国际收 支动 态平 衡 。 然而 , 合近 几年 国家 外 结 汇 管理 局 发布 的 《 国 国际收支 报 告》 以看 出, 国表现 为 长期 中 可 我
部 白定 的, 易方式 和 动机 服从 公司 内部经 营 管理 的需 要 。 交
( ) 国的 出 口加 工制造 地位 决 定 了跨 国公 司 内部 贸 易成 为 四 我 跨 国公 司在 华 贸易潜在 主要 形 式 , 变化 与 国际收 支状 况休 息相 其
美跨国公司内部贸易对中美贸易的影响分析
蔡 丽娟
( 南海 东软信 息技术职 业学院,广东 佛 山 5 8 0 ) 2 2 0
摘要 :维持 垄断优 势,克服 市场 的不完全性 ,转移价格 实现利益最大 化是 美跨国 , 司内部 贸易的主要原因。本文从 厶 \
美跨 国公 司内部 贸易的概况 出发 ,试图在阐述美跨 国公 司的内部 贸易产 生机制、运行机制 的基础上 ,探 讨对 中美贸易的
资 的 子 公 司 出 口 为 主 ,子 公 司从 母 公 司进 口为 辅 的局 面 。 研 究 6 5 0 3 .5亿 美 元 上 升 至 2 0 0 6年 的 3 2 . 美 元 。通 过 上 面 对 美 4 9 6亿 美 跨 国 公 司 内部 贸 易 的 产 生 机 制 以 及 运 行 机 制 ,了 解 内部 贸 易
的具 体 运 作 具 有 现 实 意 义 。
国跨 国 公 司 内部 贸 易 的 分 析 , 如 此 高 的增 长 速 度 是 与 美 跨 国 公 司的 内 部 贸 易 是 分 不 开 的 。 随 着 对 海 外 子 公 司 驻 资 后 内 部 贸 易 量 的 增 加 , 海 外 子 公 司 对 母 公 司 的 出 口也 会 随 之 增 加 。 为保 持 技 术 垄 断 优 势 ,满 足 中 间 产 品 的 特 殊 需 要 ,如 高 科 技 产 品 的 技
二 美跨 国公 司内部贸易 的产 生机 制与运行机制
1 产 生 机 制— — F 与跨 国 公 司 内部 贸 易 . DI 海 外 子 公 司 的 贸 易 。 当美 跨 国 公 司在 海 外 建 立 和 扩 建 企 业 时 ,
经 验 认 为 ,跨 国 公 司 的 对 外 直 接 投 资 会 有 利 于 母 公 司 与 其 术 含 量 较 高 ,故 技 术 贸 易 方 面 的 内部 贸易 的 比重 将 会 更 高 。 但 这 将 会 弱 化 中 国 的技 术 创 新 以及 升 级 能 力 ,不 利 于 中 国 可 以有 效 地 利 用 其 在 海 外 建 立 的 内部 市 场 ,母 公 司 势 必 增 加 有 产 业 链 的 升 级 ,弱 化 行 业 以 及 产 业 的 关 联 效 应 。 跨 国 公 司之 所 关 产 品 和 劳 务 的 出 口销 售 , 如 资 本 和 技 术 密 集 产 品 ,因 此 ,这 以 运 用 直 接 投 资 的 方 式 很 大 程 度 上 在 于 国 际技 术 转 让 的 考 虑 , 种 技 术 密 集 产 品 也 具 有 较 高 的 内 部 出 口 比 率 。 但 随 着海 外 营 业 因 为 跨 国 公 司 控 制 着 7 % 的 国 际技 术 转 让 ,以 及 对 发 展 中 国 家 5 的 不 断 扩 大 ,海 外 子 公 司将 可 能 把 产 品和 劳 务 返 销 于 母 公 司 。 贸 易 的 9 %,跨 国 公 司 不 会 考 虑 因 为 市 场 的 问题 而 无 偿 出让 专 O
跨国公司内部贸易负面影响与对策
并且 在 价 格 和 供 应 量方 面有 着 不 确 定 素 , 耗 能 大 、 染 重 、 益 差 的 传统 工业 将 污 效 1 内部 贸 易是 解 决跨 国公 司 内部 各 的 , 、 影 因此 只有把它们纳入整个跨 国公 司生 部 门从 母 国转 移 到 我 国 , 响我 国产 业 结 利 益 中 心 之 矛 盾 的产 物 。 跨 国 公 司 的 母 性 , 构升级 。 保 公 司 与 子 公 司 之 间关 系 一 般 有 股 本 份 额 产体系才能确保这种 中间产品的提 供, ( ) 国公 司将 可 能程 度 不 同地控 五 跨 决定 , 股本份额不同经济利益统 一程 度往 证 生 产 过 程 的 继续 。 二 、 国公 司 内部 贸 易 对我 国经 济 的 制 着我 国 的生 产 与 贸 易 , 击我 国的 经 济 跨 冲 往就不 一致。跨 国公 司通过 内部市场机
加, 国公司的 内部贸易也越来 越多。根 跨
4 、增 强公 司在 国际 市 场 上 的 垄 断地 手 中。即使我们付出了巨额的专利费 , 它
实行差别 也 不 会 出 售 最 先 进 的 技 术 , 时 甚 至转 让 有 据联合国贸发会议 的估计 , 目前公 司内贸 位 。跨国公司通过市场 内部化 , 充分地掌握市场力量 ; 另外 , 即将 淘 汰 的 技 术 , 严 重 阻 碍 了 我 国技 术 这 易 大 约 占 世 界 贸 易 总 量 的 1 3 根 据 性定价战略, /;
制满足各方的经济 利益 , 以解决内部 经济 负面 影 晌
利益 的矛 盾 。
主权 。跨 国公司凭借其垄断优 势, 在一定
( ) 过 转 移价 格 侵 吞 我 国经 济利 程 度 上 控 制 着 我 国的 生 产 和 出 口贸易 。 一 通 我
- 1、下载文档前请自行甄别文档内容的完整性,平台不提供额外的编辑、内容补充、找答案等附加服务。
- 2、"仅部分预览"的文档,不可在线预览部分如存在完整性等问题,可反馈申请退款(可完整预览的文档不适用该条件!)。
- 3、如文档侵犯您的权益,请联系客服反馈,我们会尽快为您处理(人工客服工作时间:9:00-18:30)。
各国政府对跨国公司转移价格的管理
• 一些发达国家早在20世纪五六十年代 就已经注意到转移价格的问题,并采 取了各种积极措施,如美国
• 20世纪八九十年代,许多发达国家也 都修改或实施了新的转移价格管理规 定
各国政府对跨国公司转移价格的管理
• 以“正常价格”作为报税基础 • 加强海关对外资企业进口货物的监管作用 • 建立健全审计制度,严格审议外资企业财务帐目 • 降低外资企业的纳税标准,通常低于跨国公司母
– 公司把资金由低利国家转向高利国家
资金配置
• 避免东道国家对资金的限制
– 公司使用转移价格提前调回资金,或者减少直 接投资额,利用高利贷方式将资金以利息方式 调回,可规避东道国对资金调出的限制,因为 一般来说,各国的外汇管制都不限制贷款和利 息的汇出
利润调节
• 以低价向子公司出售,以高价由子公 司买进——盈利从高税区转移到低税 区,增加了整个公司的利润
• 不同点
– 交易价格由公司内部自定 – 交易动机主要是实现企业内部的经营与
管理
内部贸易的分类
• 按内部贸易主体分类
– 母公司向海外子公司的销售 – 海外子公司向母公司的销售 – 同一母公司控制下的子公司之间的交易
a.独立子公司战略下的 单向内部贸易
海外 子公司
母公司
海外 子公司
海外 子公司
b.简单一体化生产战略下的 双向内部贸易
跨国公司内部贸易产生的原因
• 内部贸易是技术进步和国际分工进一 步发展的结果
– 技术进步和国际分工的发展使传统的公 司间分工相当大的部分转化为公司内部 分工,在公司的内部分工中,传统的水 平分工也逐步让位于垂直分工,其结果 必然使公司内部的贸易量大大增长。
日本丰田汽车公司零部件跨国生产网络
泰国 公司:丰田汽车泰国公司
跨国公司内部贸易
跨国公司内部贸易
跨国公司内部贸易概述 内部贸易理论
跨国公司转移价格概述 跨国公司转移价格的经济利益 各国政府对跨国公司转移价格的管理
跨国公司内部贸易的含义
• 跨国公司内部贸易(Intrafirm Trade) 是指一家跨国公司内部的产品、原材 料、技术与服务在国际间流动,这主 要表现为跨国公司的母公司与国外子 公司之间以及国外子公司之间产生的 贸易关系。
• 内部贸易降低了东道国引进外资的关 联效应
– 东道国大力引进外资的目的之一就是希 望通过跨国公司的投资带动上游产业或 下游产业的发展
• 跨国公司内部贸易使国际关系复杂化
– 侵占了东道国的利益,破坏了东道国的 投资声誉等
内部贸易理论
• 内部化理论
– 企业面对的是不完全的市场且企业的目 标是利润最大化
进口额,从而减少进口税。另外,可以
利用区域性关税同盟的有关关税优 惠的规定,减少关税的缴纳
资金配置
• 由各子公司分担研发的开支
– 公司实行集中研究开发新技术和新产品, 而产品销售地分布世界各个市场,于是 母公司要求各子公司对集中开支要进行 分担,采用转移价格调拨内部各单位的 资金
• 转移资金以求厚利
跨国公司转移价格概述
• 转移价格(Transfer Price),在我国 又称为转让价格、划拨价格、调拨价 格。在西方国家转移价格也被称之为 公司内部价格,内部价格或记帐价格。
• 它是指跨国公司内部,母公司与子公 司、子公司与子公司之间相互约定的 出口和采购商品、劳务和技术时所规 定的价格
转移定价的程序
– 有形商品的转移定价以内部成本为基础 的定价体系和以外部市场为基础的定价 体系。
– 无形商品的定价体系,由于缺乏外部市 场相应的可比价格,定价没有具体的依 据,通常根据需要,考虑相关因素再酌 定
有形商品的转移定价
• 内部成本加调高(调低)的转移价格 定价体系
– 在一个成本中心的垂直化企业里,以成 本为基础确定转移价格;
– 当中间产品市场不完全时,企业创造
内部市场的动力就会产生 – 企业市场内部化的界限超越国界时就产
生了跨国公司
内部贸易理论
• 成本收益法
– 通过对比出口贸易生产方式、许可证合 同生产方式和跨国公司内部贸易方式认 为跨国公司内部贸易是国际生产方式中 的最优选择
内部贸易理论
• 内部化成本
– 激励成本 – 信息成本 – 约束成本 – 讨价还价成本
有形商品的转移定价
有形商品的转移定价
无形商品的转移定价
• 无形商品的转移定价,如子公司付给 母公司技术使用费、贷款利息、商品 使用费、佣金及管理费等的作价,由 于无形商品的价格可比性差,没有可 靠的定价基础,其价格的制定因素, 主要取决于掌握市场信息的情况和谈 判中讨价还价的能力
跨国公司使用转移价格的经济效益
• 转移定价方式
– 以母公司为中心,实行高度集权的“本 国中心”体制
• 其转移价格的制定采用集中化方式
– 以海外子公司为中心,实行分权管理的 “多元化中心”体制
• 其转移价格的制定采用分权化方式
– 公司实行管理权的集中与分散相结合的 “全球中心”体制
• 其转移价格的制定采用协议方式
转移定价的具体步骤
印度尼西亚 公司:丰田-阿斯汽车公司 产品:发动机等
跨国公司内部贸易产生的原因
• 内部贸易是跨国公司追求利润最大化 的结果
– 节约成本、减少风险、转移价格
• 内部贸易是解决跨国公司内部各利益 中心矛盾的产物
– 通过内部市场机制满足各方的经济利益
跨国公司内部贸易的特征
• 内部贸易不转移商品或劳务的所有权 • 较强的隐蔽性
国税率 • 加强国内立法,建立专门调查转移价格的机构,
建立“黑名单”制度
我国转让定价税制的国际比较
• 转让定价法律体系的完善程度不同
– 我国有关转让定价的法律法规相对简单, 虽经过多次补充,与国外相比,尤其是 与OECD转让定价指南和美国相比较,更 为简单
• 关联企业的认定标准不同
– 我国界于美国和日本之间,既有原则性 的规定又有股权及借贷资金比例的要求
– 经周密研究后,提出新的转移价格政策 报告,内容包括价格目标体系、经营商 品、定价依据、外购政策等八个方面
• 仲裁
– 公司内部设立仲裁委员会或仲裁员,解 决由于价格不完全一致而产生的争端
• 定期检查和修订转移价格体系
– 各种条件的变化,要求公司定期回顾、 检查和修订原价格体系
转移定价的方法
• 实行转移价格的商品有两大类:一是 有形商品;二是无形商品
我国转让定价税制的国际比较
Siam丰田制造公司 产品:发动机、仪表盘、
灯具等
马来西亚 公司:UHV丰田汽车公司
7﹠K汽车零部件公司 产品:减震器、音像等
新加坡 丰田汽车 管理服务 新加坡公 司
日本
菲律宾 公司:丰田汽车菲律宾公司
丰田汽车零部件菲律 宾公司 产品:速器、模压零件中国台湾 公司:Fung Yong
Kuozui 汽车 公司
海外 子公司
母公司
海外 子公司
c. 全球一体化生产战 略下的多边化内部贸易
海外 子公司
海外 子公司
海外 子公司
海外 子公司
母公司
海外 子公司
海外 子公司
内部贸易的分类
• 按内部贸易性质分类
– 投资性内部贸易(技术、相关设备和物 品)
– 经营性内部贸易(贸易的客体为了满足 日常经营所需)
– 管理性内部贸易(会计、法律、服务、 会议及督导等)
• 目前比较著名的避税港有加勒比地区的巴 哈马、英属维尔京群岛、开曼群岛、伯里 兹、安提瓜、特克斯与凯科斯、圣基兹与 尼维斯等、亚洲的巴林、香港和欧洲的卢 森堡等地。
“低价”出 售
无利润
逃避所得税
“高价”买 入
无盈利
美国跨国公司
英国子公司
低价卖出
百慕大群岛子公司 避税港
高价卖出
减轻税负
• 逃避关税 – 公司通过转移价格,将设在高关税国家 的子公司进货价低估,降低子公司的
斯沃琪(Swatch)集团避税案
• 斯沃琪亚洲分部办公地设在中国香港 特区,却在英属维尔京岛登记注册, 英属维尔京岛成为其操纵转让定价非 法避税的中心地。通过亚洲分部销往 斯沃琪其他关联企业的所有产品,其 内部交易价格都被人为地大大提高。
斯沃琪(Swatch)集团避税案
• 报告透露,近6年来,斯沃琪集团亚洲 分部利用转移价格,从美国转移出去 了大笔利润,从而逃避了100多万美元 的美国税收。同时在澳大利亚和亚洲 等地,其逃避的各国国内税收和关税 总额超过1.8亿美元。
逃避东道国的价格控制
• 当东道国政府限制跨国公司以高价 销售时,母公司则采取调高转移价 格的方式,使子公司的成本提高, 其结果仍能使整个公司获取较高的 利润
避免外汇汇率变动风险
• 在不实行外汇管制或管制较少的国家 里,跨国公司如果发现东道国或母国 的汇率即将变动,就可以利用转移价 格促进提早或推迟付款,以减少因货 币贬值而造成的经济损失,或者获取 汇率差价利益
跨国公司内部贸易的含义
• 跨国公司的内部贸易虽然导致商品或 服务跨越国界流动,但是交易行为主 体实质上是同一个所有者。它既具有 国际贸易的特征,又具有公司内部商 品调拨的特征。因此,它是一种特殊 形式下的国际贸易。
特殊形式下的国际贸易
• 共同点
– 是一种跨越国界的商品流通,是两个经 济实体的商品和劳务的交易,会影响两 国的国际收支。