基于景观格局定量分析
景观生态学原理——景观格局与分析
景观生态学原理|——景观格局与分析景观的三个特征:1、格局:生态系统的大小、形状、数量、类型及空间配置相关的能量、物质和物种的分布2、功能:景观单元之间的相互作用,生态系统组分间的能量流动、物质循环和物种流3、动态:斑块镶嵌结构与功能随时间的变化3.1 景观发育景观格局的形成,受到生物与非生物两个方面的影响3.2 景观要素景观要素包括景观斑块、廊道、基质,以及附加结构3.2.1 斑块(patch)空间的非连续性以及内部均质性1. 斑块起源主要因素:环境异质性(environmental heterogeneity)自然干扰(natural disturbance)人类活动(human activity)1、环境资源斑块由于环境异质性导致,稳定,与自然干扰无关,由于环境资源的空间异质性和镶嵌规律2、干扰斑块由于基质内的各种局部干扰引起,具有最高的周转率,持续时间最短3、残存斑块是动植物群落受干扰后基质内残留的部分4、引进斑块人们把生物引入某一地区后形成的斑块1)种植斑块2)聚居地2. 斑块面积1、对物质和能量的影响2、对物种的影响1)岛屿,面积效应——生境多样性(habitat diversity)——物种多样性2)陆地,基质异质性高3. 斑块形状斑块的形状和走向对穿越景观扩散的动植物至关重要1、圆形和扁长形斑块,内缘比(interior ratio)2、环状斑块3、半岛4. 斑块镶嵌相似的斑块容易造成扩散不同类型的斑块镶嵌,能够形成对抗干扰的屏障、5. 斑块化(缀块性,patchiness)与斑块动态1、斑块化机制斑块化:斑块的空间格局及其变异,大小、内容、密度、多样性、排列状况、结构、边界特征对比度(contrast):斑块之间以及斑块与基质之间的差异程度空间异质性(spatial heterogeneity):通过斑块化、对比度以及梯度变化所表现出来的空间变异性生物感知(organism-sensed):生物对于斑块化的反应最小斑块化尺度(smallest patchiness scale):粒度(grain)最大斑块化尺度(largest patchiness scale):幅度(extent)斑块化动态:斑块内部变化和斑块间相互作用导致的空间格局及其变异随时间的变化斑块化产生的原因:物理的和生物的,内部和外源的2、斑块化的特点1)可感知2)内部结构,时空等级性,大尺度斑块是小尺度斑块的镶嵌体3)相对均质性4)动态特征5)生物依赖性6)斑块的等级系统(patch hierarchy)7)等级间的相互作用8)斑块敏感性(patch sensitivity)9)斑块等级系统中的核心水平:最能集中体现研究对象或过程特征的等级水平,相应的时空尺度称为核心尺度(focal scale)10)斑块化原因和机制的尺度依赖性3、斑块化的生态与进化效应3.2.2 廊道(corridor)廊道是线性的景观单元,具有通道合阻隔的双重作用1. 廊道的起源干扰廊道、残存廊道、环境资源廊道、种植廊道、再生廊道2. 廊道的结构特征1)曲度:廊道的弯曲程度,影响物质、能量、物质的移动速度2)宽度3)连通性:廊道单位长度上间断点的数量表示4)内环境:较大的边缘生境和较小的内部生境3. 廊道分类1)线状廊道:全部由边缘物种占优势的狭长条带2)带状廊道:较丰富的内部种的内环境的较宽条带3)河流廊道:分布在河流两侧3.2.3 基质(matrix)1. 基质的判定1)相对面积2)连通性3)控制程度4)3个标准结合2. 孔隙度和边界形状孔隙度(porosity):单位面积的斑块数目3.2.4 附加结构(add-on)异常景观特征,在整个景观中只出现一次或几次的景观类型3.3 景观格局特征目的:从无序的斑块镶嵌中,发现潜在的有意义的规律性3.3.1 斑块-廊道-基质模式(patch-corridor-matrix model)3.3.2 景观对比度1. 低对比度结构自然形成的,热带雨林,相邻景观要素彼此相似2. 高对比度结构自然、人工3.3.3 景观粒径(landscape grain)粗粒(coarse grain)和细粒(fine grain)生物体粒径(home range):生物体对其敏感或利用的区域粒径大小取决于整个景观的尺度3.3.4 景观多样性(landscape diversity)由不同类型生态系统构成的景观在格局、功能和动态方面的多样性或变异性,反映景观的复杂性程度1)斑块多样性:数量、大小、形状的多样性2)类型多样性:景观类型的丰富度3)格局多样性:景观类型空间镶嵌的多样性3.3.5 景观异质性(landscape heterogeneity)多样性——斑块性质的多样化异质性——斑块空间镶嵌的复杂性,景观结构空间分布的非均匀性、非随机性1)空间异质性2)时间异质性3)功能异质性梯度分布镶嵌结构3.4 生态交错带与生态网络3.4.1 边缘效应与生态交错带景观单元之间的空间联系:生态交错带、网络结构1. 边缘效应(edge effect)边缘地带由于环境条件不同,可以发现不同的物种组成和丰富度边缘物种:仅仅或主要利用景观边界的物种内部物种:远离景观边界的物种2. 生态交错带(ecotone)描述物种从一个群落到其界限的过渡分布区,由两个不同性质的斑块的交界及各自的边缘带组成生态过渡带(transition zone)景观边界(landscape boundary)1)特征:生态应力带(tension zone)、边缘效应、阻碍物种分布(半透膜)、2)描述:结构:大小、宽度、形状、生物结构、限制因素、内部异质性、密度、分形维数、垂直性、外形或长度、曲合度功能:稳定性、波动、能量、功能差异、通透性、对比度、通道、过滤、屏障、源、汇、栖息地3)尺度效应:某一尺度上可以明辨的交错带在另一尺度上可能模糊不清4)气候变化:更为敏感,迟滞(lag)5)生态交错带与生物多样性:农业生产把异质的自然景观变成大范围同质的人工景观,消灭了自然生态交错带,扩展了人为生态交错带3.4.2 生态网络与景观连通性生态网络(network)将不同的生态系统相互连接起来两类物种:生活在网络包围的景观要素内部的物种,廊道是一种障碍;生活在廊道内、沿着廊道迁移的物种1. 廊道网络由节点(node)和连接廊道构成,分布在基质上形式:分支网络(branching network):树状的等级结构环形网络(circuit network):封闭的环路结构1)廊道网络的结构特征网络交点、网状格局、网眼大小、网络结构的决定因素(历史和文化的)2)廊道网络描述连通性:在一个系统中所有交点被廊道连接起来的程度,指示网络的复杂度,用r指数方法来计算r指数:连接廊道数与最大可能连接廊道数之比r=L/Lmax=L/3(V-2),V为节点数环度:用α指数衡量,表示能流、物流、物种迁移路线的可选择程度。
基于景观空间格局的公路景观定量评价指标体系

性、 破坏植 被 群落 、 加剧 水 土流 失 、 生视 觉 污染 等环境 问题 不 断加剧 . 产 目前 主 要 的解 决方 法是 对 建设项 目进 行环 境影 响评 价 , 使公 路建设 对 环境 的影 响尽 可 能减 小 . 现行 公 路 环评 中 , 但 由于 景 观评 价 的 复杂 性、 不确 定性 、 多学 科性 及评 价 人员专 业 知识所 限 , 多 采用 较 为 简 略 的 、 性 论述 分 析 的方 法 ]作 者 大 定 . 通过 对公 路景 观环 境影 响评 价 的实践 与研 究 , 借鉴 景 观生 态学研 究方 法 , 出选 取 反映景 观空 间格 局 的 提 斑块 数量 、 小 、 状及 景 观破碎 度 、 大 形 景观 多样性 等指 标 体 系对 公 路 景观 环 境 进行 定 量 评 价 该评 价 。.
指 标 体 系 简 便 明 了 、 比性 强 , 定 性 描 述 更 为 实 用 科 学 , 国 内 外 公 路 景 观 环 境 影 响 评 价 中 尚 未 见 有 可 较 在 关这 方面 的应 用实 践 与研究 报道 .
1 公 路 景观 空 间格 局分 析 与 景观 类 型 划 分原 则
元镶嵌 组 合 、 互作 用 , 相 形成 具有 一定 空 间结 构 的公 路景 观环 境。
1 2 公 路 景 观 类 型 划 分 原 则 .
在公 路景 观环 境影 响评 价 中 , 于景观 单元 的分 类 , 根据 所 评 价公 路 所 处 区域 的景 观特 点 , 下 对 应 按 述 原则 分类 【 ]① 必须 明确 景 观单元 等 级 , 3 : 即根 据 不 同空 间 尺度 或地 形 图 比例 确 定分 类 的 基 础 单元 ; ② 应体 现 出景观 空 间分异 与组 合 , 即不 同景 观 间既相 互独 立 又相互 联 系 ; ③要 反 映 出控 制景 观形 成过程
基于RS和GIS对龙凤湿地自然保护区景观格局变化特征定量分析
第3 9卷 第 9期 2 1 年 9月 01
东
北
林
业
大
学
学
报
V 13 . o . 9 No 9
S p. 2 1 e 01
J RNAL OF NO HEAS RE T NI RS T OU RT T FO S RY U VE I Y
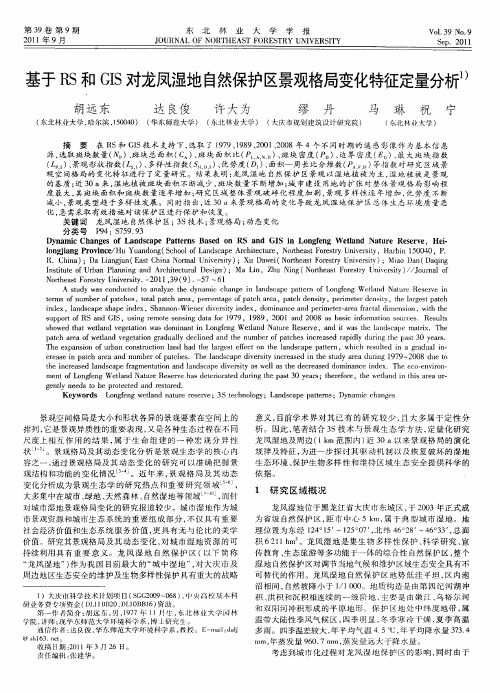
基于 R 和 GS S I对龙凤湿地自 然保护区景观格局变化特征定量分析 )
A su y w s c n u td t n lz h y a c c a g n l n s a e p t r fL n fn el n t r s r e i td a o d ce o a ay e t e d n mi h n e i a d c p at n o o g e g W t d Nau e Re e v n e a t mi o u e f ac e ,tt l ac r a, e c n a e o ac r a ac e st e s fn mb r t h s o a th ae p re tg fp t h a e ,p t hd n i op p y,p r t r e st t e lr e t ac e me e n i i d y, h a g s p t h
基于GIS的市域景观格局定量分析与优化

生态环境 2008, 17(4): 1554-1559 Ecology and Environment E-mail: editor@基金项目:国家杰出青年科学基金项目(50225926;50425927)作者简介:华昇(1984-),女,硕士研究生,主要从事3S 技术、城市生态和景观生态研究。
E-mail: hs0723@ *通讯联系人:曾光明,教授(长江学者),湖南大学环境科学与工程学院院长,博士生导师。
E-mail: zgming@ 收稿日期:2008-02-20基于GIS 的市域景观格局定量分析与优化华昇,谢更新,石林,杨馥,周建飞,李忠武,曾光明*湖南大学环境科学与工程系,湖南 长沙 410086摘要:以长沙市为例,结合长沙市2000年4月份 Landsat TM 影像和1∶250000地理信息矢量数据库,借助Arc/view 和Arc/Info 软件,对其景观进行分类,并形成景观分类图,一级分类6个类型,在此基础之上进行二级分类,共分为15种景观类型。
并用景观格局分析软件FRAGSTA TS 软件计算了各类景观参数,并从斑块、类型和景观3个水平上,计算了相应的参数和景观指数,定量的揭示了整个景观格局与类型特征。
研究结果表明,分布面积占研究区总面积达46.8707%的有林地景观其连接性、完整性比其他景观类型好,是研究区的基质,但斑块和景观的空间形状较为复杂,表现出强烈的干扰特征。
水田的斑块数量最多,受人为活动影响强烈。
天然草地,改良草地,滩涂表现出萎缩特征。
从各类用地的空间组合来看,除了城镇相对集中的城区等几个地方外,农村居民点多为耕地和林地景观所隔开,各城镇和农村居民点由道路或水系连接。
定量分析城市景观的空间格局,将有助于深入研究景观格局的形成机制和理解城市景观的格局与过程。
在此基础上初步探讨了基于景观格局优化的城市生态系统的内部空间布局。
研究结果对长沙市景观生态规划有指导意义。
关键词:地理信息系统;景观格局分析;景观指数;FRAGSTA TS ;景观格局优化中图分类号:X821 文献标识码:A 文章编号:1672-2175(2008)04-1554-06景观生态学中的格局是指空间格局,包括景观组成的单元类型、数目以及空间分布与配置[1]。
石河子荒漠绿洲土地利用景观格局的定量分析
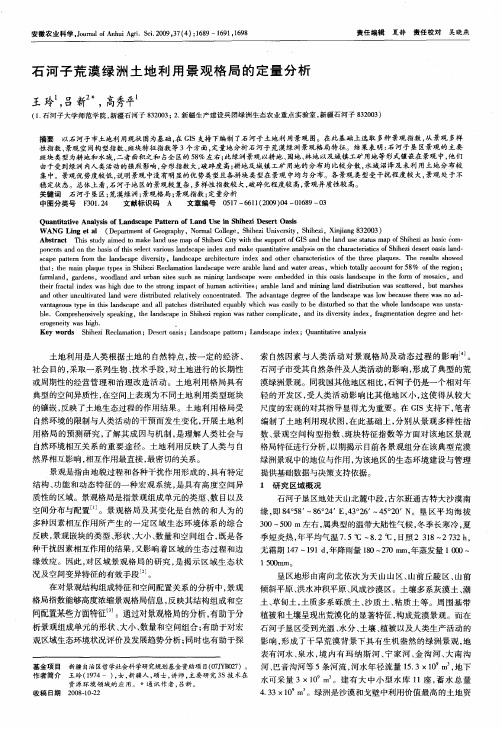
Absr c Thssu y ame oma e1n s peln s ttsma fS i eia a i o tat i td i d t k a d u e ma fS i eiCiywi t u p  ̄ fGI n h a d u e sau p o h h z sb scc m— h
Qu nia v ayi f n sa eP ten o n ei hh z sr ss a t t eAn lsso dc p atr f ti La La dUs S ieiDeetOai n
青海省祁连山三河源地区景观空间格局定量分析
局的研究 , 示其变 化规律 , 究结果有利 于 了解半 干旱 山地 河谷地 区景观格 局 与生态 过程 和社会 经济 活动之 揭 研
E d sI gn 9 1和 E r a ma ie. NVI. 建 立 了三河 源 区景 观分 类 数 据库 ; 4 6) 使用 景 观 统 计 软 件 ( rg tt 3 3 计 算 F a sai . ) s 选 取 的景观 指数 , 对研 究 区景观 格 局变化 进行 了定性 与定 量分 析. 并
曹广 超 李 玲 琴 , , 曹生奎 , 易俊 柱
( .青 藏 西 宁 1 青 800 ; 10 8
2 .青 海 师范 大 学 生命 与 地理 科 学学 院 , 海 西 宁 青
摘
80 0 ) 10 8
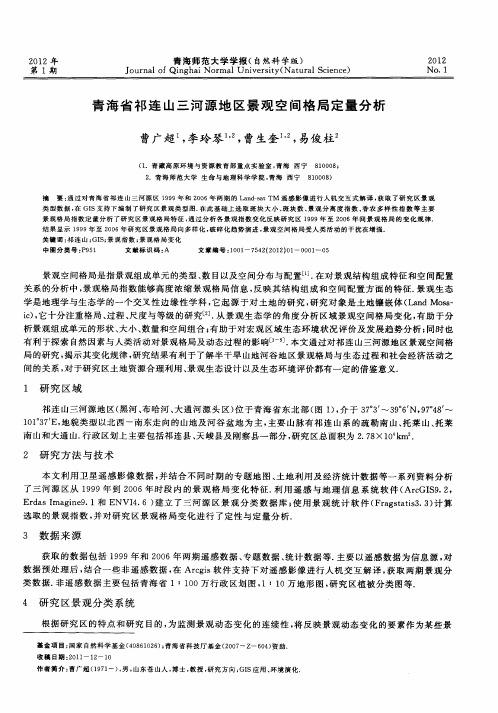
要 : 过对青海省祁连山三河源区 19 通 9 9年 和 20 年 两 期 的 L n —a TM 遥 感 影 像 进 行 人 机 交 互 式 解 译 , 取 了 研 究 区 景 观 06 adst 获
3 数 据 来 源
获 取 的数 据 包括 1 9 9 9年 和 2 0 0 6年两 期遥 感数 据 、 专题数 据 、 统计 数据 等. 主要 以遥感 数据 为信 息 源 , 对 数据 预处 理后 , 合一 些 非遥感 数 据 , Args 结 在 c i 软件 支持 下对 遥感 影像 进行 人机 交 互解 译 , 取两 期 景观 分 获
关 键 词 : 连 山 ; S; 观 指数 ; 观 格 局 变 化 祁 GI 景 景 中图分类号 :91 P 5 文献标识码 : A 文 章 编 号 : 0 1 7 4 ( 0 2 0 —0 0 —0 10— 5221)1 0 1 5
景观生态学5 景观格局分析
式中,Pk是斑块类型k在景观中出现的频率,n是景观中斑块类 型的总数。
5.2 景观指数
Landscape Ecology
5.2.1 常用的景观指数 (3)景观多样性指数(landscape diversity index)
5.2 景观指数
5.2.1 常用的景观指数
Landscape Ecology
(1)斑块形状指数(patch shape index) 通过计算某一斑块形状与相同面积的圆或正方形之间的偏
离程度来测量起形状复杂程度。 常见的斑块形状指数S有两种形式:
(以圆为参照几何形状)
(以正方形为参照几何形状)
其中,P是斑块周长,A是斑块面积。
景观指数不是万能的,景观生态学有很多内容用景观 指数是表征不出来的;
景观指数与景观格局并不是一对一的对应关系,而是 多对多的关系,我们分析的时候要具体问题具体分析, 不要陷入指数这样变就一定对应什么结论的思维定势;
我们计算指数,主要通过定量的依据来证明定性的结 论,不能为计算而计算,玩数字游戏,如果某个指数 说明不了什么问题,那么这个数字就没有任何意义。
所以,我们要关心具体的生态过程,多观察几个指数, 结合起来说明问题。
5.2 景观指数
5.2.2 景观指数应用举例 (1)用于两种景观的对比
Landscape Ecology
5.2 景观指数
Landscape Ecology
5.2.2 景观指数应用举例 (2)景观格局指数可以用来定量地描述和监测景观的结构特 征随时间的变化。
具体问题具体分析——多观察几个指数
景观空间格局指标及其分析方法

2.5景观空间格局指标及其分析方法
对景观空间格局的定量描述是分析景观结构功能及过程的基础。
景观空间格局是指大小和形状不一的景观斑块在空间上的配置.它是
景观异质性的具体表现(傅伯杰等,2001),是自然、生物和社会要素之间相互作用的结果。
通常,景观空间格局可以用景观格局指数来度量,景观格局指数是指能够高度浓缩景观格局信息,反映其结构组成和空间配置某些方面特征的简单定量指标(邬建国,2000)。
2.5.1斑块面积(A)和斑块周长(P)斑块面积和斑块周长是描述景观斑块
形态特征和景观空间格局分析的基础。
斑块的面积可以反映湿地景观类型/覆盖斑块的基本特征.斑块的大小直接影响单位面积的生物量、生产力及物种组成和多样性(蒋卫国等,2003)。
2.5.2景观的破碎化指数(C)景观的破碎化指数是指景观被分割的破碎
程度.该指数的研究对景观中生物和资源的保护具有十分重要的意义(陈鹏,2O05)。
其表达式为:C=MPS x(Nf 1)/Nc式中.MPS为景观中各类斑块的平均斑块面积,Nf是某~种景观类型的斑块总数,Nc是景观总面积。
通过景观破碎化分析可以从一定的角度对景观的稳定性和人类干扰程度进行适当评价。
2.5.3斑块的分维数(D) 斑块的分维数主要揭示斑块及斑块组成的
景观的形状和面积大小之间的相互关系,它反映了在一定的观测尺度上斑块和景观格局的复杂程度,表达式是:D = 2Ig(P/4)/Ig(A)
式中,P为斑块周长,A为斑块面积,D为分维数,且满足1≤D≤2。
D
值越大,反映斑块的形状越复杂;当D=1时,斑块形状为简单的欧几
里德正方形(阎传海等,2003)。
- 1、下载文档前请自行甄别文档内容的完整性,平台不提供额外的编辑、内容补充、找答案等附加服务。
- 2、"仅部分预览"的文档,不可在线预览部分如存在完整性等问题,可反馈申请退款(可完整预览的文档不适用该条件!)。
- 3、如文档侵犯您的权益,请联系客服反馈,我们会尽快为您处理(人工客服工作时间:9:00-18:30)。
基于景观格局定量分析的滨水区景观建设摘要基于人水和谐的理念,以景观生态学等为理论基础,解析了滨水区的概念及其内涵。
认为在城市化进程不断推进的背景下,滨水区已成为生态敏感脆弱的区域,而构建生态循环系统、重塑滨水景观环境已成为当务之急。
在此基础上,以包括南湖荡主体及沿湖岸 500 km的区域为研究区域,探究了其景观生态分类和景观格局分析。
结合相关分析评价,针对南湖荡3个景观子区存在的不同问题,对每个子区因地制宜地进行具有不同特色的生态景观建设,以期实现滨水区的生物平衡、滨水景观的高效和谐与可持续发展。
关键词滨水区;景观建设;景观生态;景观格局水是生命之源,是人类发展史中不可或缺的一部分。
同时,由于人有亲水、近水的天性,水除了满足人们的物质需求外,更需要实现人们的精神追求。
水不仅是珍贵的资源,也是一种优越的景观,对滨水地区的发展具有尤为重要的意义。
滨水区经济发展速度快,人类活动对其干扰强度大,给水生态系统带来了正、负两方面的效应,即在自然和人类活动的双重作用下,既形成了滨水地区水生态的一些优势,也带来了一系列问题。
如今,如何建设高效、健康、安全的滨水景观成为一项热门的研究课题。
1.滨水区概念及其内涵水景观包括水体景观和滨水景观两部分,统称为“滨水景观”在滨水景观建设中引入滨水区的概念,即生态影响环境范围内水域(江、河、湖、海)与陆地相接的一定范围内的区域,包括水域、水际线和陆域 3个区域,应综合考虑水与陆地的共同构成环境的主导要素进行景观建设。
景观是空间上不同生态系统的聚合,是空间上彼此相邻、功能上相互有关并且发生上有一定特点的若干个生态系统的聚合。
景观生态学主要研究景观的结构、功能和变化以及景观的规划管理。
景观生态学为景观建设提供了一个新的思维模式——景观生态规划,通过对景观空间格局、景观特征的综合分析,为景观规划提出最优化方案。
滨水区的发展和当地的经济发展水平密切相关。
纵观滨水景观建设的研究历程,目前国内滨水区景观建设规划中仍然突出体现了以下几个方面的问题:①缺乏对水域、水际线和陆域的综合考虑。
目前现有景观建设方面存在着一定的片面性,不能从滨水区这个整体范围内予以全面考虑和综合解决。
②对于景观生态、景观格局的分析比较欠缺。
虽然目前生态学、景观生态学等理论思想已经逐步引入滨水景观建设中,但尚无一套系统的理论。
③没有定量描述。
目前的景观建设主要是定性的分析,对景观没有定量分析与评价。
滨水区景观建设是一项复杂的、多目标的系统工程 J,应该综合融入建筑学、地理学、生态学等多学科的知识和方法,以景观生态学为依据,对滨水景观进行格局分析,为滨水区景观建设提供依据。
图 1 南湖荡分段2 研究区概况南湖荡位于常熟市区西南部阳澄片内,是经典水上旅游区的点睛之笔,尚湖一望虞河一南湖荡一昆承湖一沙家浜构成了常熟市的特色水上生态旅游线。
笔者以南湖荡为主体,将包括南湖荡主体及沿湖岸 500m的区域作为研究区域。
根据湖体形态及水景观现状,将南湖荡划分为3段,拟定各段的基准线(组织空间秩序的基本骨架,也就是联系相对孤立景观元素的线性结构)。
分别对3段进行分析评价:①第1段,水质较好,存在着一些自然状态下的湿地,有着优美的田园风光,但湖体狭窄;②第2段,属于传统农业耕作区,有着优美的田园风光,景色宜人,湖面平静、湖水清澈,且零星分布着一些岛屿,周围的自然环境良好,湖体渐宽;③第3段,为东部化工厂密集的地段,水体严重污染,水质较差,另外垃圾填埋场附近亦属于生态敏感区。
3 研究方法和内容3.1 景观生态分类3.1.1 景观分类原则。
景观生态分类就是根据现有资料,综合分析研究区域的自然特征、人类活动以及社会经济条件,按照一定原则、依据和目标选择分类指标,从功能着眼、从结构着手,对景观生态系统类型进行划分,是景观结构与功能研究的基础,也是进行景观格局分析以及景观生态规划、评价及管理的前提条件。
景观格局分析的前提是景观生态分类,除了景观生态学结构和功能原理、景观动态原理等基本原理外,景观生态分类还遵循其他一些原则:①综合性和主导性原则;②目标和实用原则;③异质性与均质性相结合的原则;④定性和定量相结合的原则;⑤景观功能与生态过程一致性原则。
3.1.2 南湖荡景观生态分类。
对研究土地利用现状进行屏幕数字化,制作景观图,并建立数据属性库,然后将土地利用图导入到 CAD中,通过其中的图形、数据以及文字资料,对景观生态进行斑块划分,初步确定个体单元的范围及类型,构建分类体系。
南湖荡的景观生态分为:水域景观(包括鱼塘)、农耕地 (包括植被地)、居住用地、工业景观(含垃圾填埋场)以及未利用地(取总面积中扣除上述类型以外的剩余面积)。
3.2 景观格局分析景观由大小不同的斑块组成,而斑块的空间分布称为格局。
对景观空间格局与异质性的定量描述,就是景观格局指数,它是分析景观结构功能及其过程的基础。
景观格局分析可以将景观的空间特征和时间过程联系起来,从而清楚地对景观内在规律进行分析和描述。
3.2.1 景观格局指数。
景观格局指数是高度浓缩的景观格局信息,可以比较不同景观或研究区之间的异同,是反映景观结构组成、空间配置特征的简单量化指标。
对于景观格局分析,目前已经提出了许多指标,结合研究区实际情况,笔者选取表l中的几项指标来研究滨水景观格局特征。
3.2.2 景观格局结果分析。
3.2.2.1 景观斑块特征指数。
对于南湖荡,分维数、伸展指数取各斑块分维数的平均值,计算结果见表 2、由表中数据显示,各景观类型的分维数都大于,1但又较接近于 1,且各斑块之间的分维数相差并不是很大,这表明斑块之间具有一定的自相似程度,而且也说明该区域受到一定的人为干扰。
各种景观类型的伸展指数都在5左右,结合南湖荡土地利用现状图以及实际勘测所得到的资料,不难发现这些景观斑块除了湖体外,一般都不是呈狭长分布状态,而是接近于圆形,形状相对比较规则。
.表 1 常用景观格局指数分类指数意义景观斑块分维数测定斑块形状的复杂程度特征指数伸展指数代表斑块形状与圆形的差异程度值越大,则说明斑块形状越长,与圆形差异越大,亦说明斑块周边越发达,形状越不规则景观多样多样性指数综合反映景观斑块丰富程度和均匀程度,值性指数越大,景观类型越丰富,也就是景观结构组成的复杂性越大优势度描述一种或几种景观嵌块体支配景观格局的程度,值越大,表明偏离程度越大,即组成景观的各景观类型所占的比例差异大相对均匀度描述景观各景观类型的分配均匀度指数景观空间分离度某一景观类型中不同斑块个体分布的分离程构型指数度,值越大,说明景观在地域的分布越分散,破碎化程度也越高景观破碎度指景观被分割的破碎程度,它在一定程度上反映了人类活动对景观的干扰强度;值为0时,表示景观完全未被破坏;为1时,表示景观被完全破坏反映同一种类型斑块受到干扰的破碎化程度,如果取值较低,则表明景观类型的单独斑块面积较大,反映受人为干扰强度较低反映景观被分割的破碎程度,比值愈大,斑块密度越大,破碎化程度愈高3.2.2.2 景观多样性指数。
南湖荡滨水区景观多样性指数 (取3段平均值)为 1.125,但是第3段的多样性则较低,说明该段景观类型不够丰富,且景观结构组成比较单一。
另外从优势度(取 3段平均值)也可以看出第 3段多样性指数的最大值和实际值之差较大,也进一步说明了第 3段的景观多样性对最大多样性的偏离程度较大,即各景观类型所占比例差异大,或者说景观只受某一种或少数几个景观类型支配。
另外两段各景观类型所占比例差异并不大,各景观分布较均匀。
均匀性指数则进一步说明上述情况。
3。
2.2.3 景观空间构型指数。
在南湖荡滨水区各景观类型中,其景观分离度的排序为:水域景观 <农耕地 <居住用地 <工业景观(图表4)。
其中,工业景观分离度较大,说明工业景观在区域上的分布较分散,景观分布也较复杂,破碎化程度较高。
南湖荡滨水区景观破碎度见表 5,其中农耕地破碎度较高,即其破碎化程度较高,说明了人类活动对农耕地的干扰强度较大。
水域分布较为集中,其破碎化指数则相对较低,但若将鱼塘等分开考虑的话,水域的破碎化程度则将提高。
南湖荡河道景观内部生境破碎化指数,都相对较高,这与景观斑块面积的大小、人为干扰状况等都有关系,说明程度低,景观分布较集中;但其他几类景观则相反。
这一指标也相应反应出各类景观受干扰的强度。
表2分形维数的计算结果水景观(包括鱼塘)农业用地(包括植被的土地)住宅用地工业景观(包括垃圾填埋场)分形维数扩展指标分形维扩展指标扩展指标分形维数扩展指标分形维数扩展指标1 1.128,8 5.386,3 1.068,8 5.355,1 1.057,3 5.565,7 1.071,88.170,92 1.066,8 6.203,4 1.080,4 5.783,8 1.052,3 5.183,4 1.035,6 4.763,33 1.075,6 6.328,9 1.054,9 5.210,1 1.064,0 5.476,8 1.032,5 4.634,2表3多样性指数的计算结果,优势和相对均匀度部分多样性指数优势相对均匀度11.285,8 0.323,7 0.734,6 21.122,9 0.486,5 0.551,9 3 0.966,9 0.642,6 0.454,8表4隔离度计算结果水景观(包括鱼塘) 农业土地(包括植被的土地)工业景观(包括垃圾垃圾填埋场) 部分 住宅用地1 0.005,3 0.007,2 0.027,42.622,4 2 0.001,8 0.014,7 0.103,10.211,5 3 0.001,5 0.023,9 0.308,10.833,4表5 计算结果和FN2 FN1景观破碎化景观碎片(FN 1) 景观破碎化(FN2) 水景观(包括鱼塘) 农业土地(包括植被的土地) 部分住宅用地 工业景观(包括垃圾垃圾填埋场)10.003,7 0.109,4 0.625,0 0.187,5 0.015,6 20.004,2 0.120,9 0.560,4 0.230,8 0.044,0 3 0.003,7 0.142,9 0.628,6 0.085,7 0.028,6 表6破碎化的指数FI1以及景观内部生境面积计算结果部分 景观内部生境面积破碎化指数(FI1) 对景观内部生境面积破碎化指数(导致)水面积 农业用地 住宅用地 工业景观 未利用土地水面积 农业用地 住宅用地 工业景观 未利用土地10.699,7 0.578,4 0.882,1 0.997,0 0.842,8 0.869,3 0.946,6 0.967,3 0.998,7 0.842,8 20.416,7 0.765,0 0.951,8 0.981,8 0.884,7 0.868,7 0.980,1 0.994,8 0.987,5 0.884,7 30.345,1 0.836,8 0.983,4 0.993,2 0.841,4 0.891,3 0.973,9 0.994,9 0.997,1 0.841,4Waterfront Landscape Construction Based onQuantitative Analysis of Landscape Pattern Abstract Based on the concept of the harmony between humanand water and the theory of landscape ecology, the paper hasanalyzed the concept and connotation of waterfront area. It isconsidered that waterfront areas have been ecologically sensitiveareas under the background of constant advancement ofurbanization; and constructing ecological circulation system andreshaping waterfront landscape environment have been toppriorities. On this basis, it has studied the classification oflandscape ecology and analysis of landscape pattern by takingNanhudang Lake and the area 500 km within the lake as theresearch area. In view of different problems of the threelandscape sub-zones of Nanhudang, different characteristiceco-landscape constructions have been conducted on eachsub-zone according to local conditions, so as to achieve thebiological balance of waterfront areas, and efficient andharmonious sustainable development of waterfront landscape.Key words Waterfront areas, Landscape construction, Landscape ecology, Landscape patternWater is the source of life and an indis-pensible part of human development. As human love water in nature, water can not only meet people’s material needs but also help achieve their spiritual pursuit. Water is not only a kind of precious resource, but also an excellent landscape, of vital significance to the development of waterfront areas. The rapid economic development in waterfront areas and the interference of human activities has brought positive and negative effects on water eco-system, that is, under the double actions of natural and human activities, some advantages have formed and a series of problems have been brought in water ecology of waterfront areas. Now, how to build an efficient, healthy and safe waterfront landscape has been a hot research topic.1 Concept and connotation of waterfront areaWater landscape includes water body landscape and waterfront landscape, which areall called as “waterfront landscape”[1]. When the concept of waterfront area has been introduced into waterfront landscape construction, which refers to the area at the junction of water and land including water area, water border line and land area[2], it should consider the dominant element of the environment composed of water and land to conduct landscape construction. Landscape is the collection of different eco-systems in space and the gathering of several eco-systems close in space, mutually related in function and presenting certain characteristics in their interaction[3]. Landscape ecology aims to atudy the structure, function and change of landscape, and the planning and management of landscape[4], Landscapeecology has provided a new thinking mode for landscape construction, that is, landscape ecological planning. Through the comprehensive analysis of landscape spatial pattern and landscape characteristics, the optimization scheme can be proposed for landscape planning.The development of waterfront area is closely related to local economic deve-lopment. From the perspective of researches on waterfront landscape construction, following problems are prominent in dom-estic landscape construction of waterfront area. First, it is lacked of an integrated consideration of the water area, water border area and land area. The current landscape construction is one- sided, and the whole waterfront area has not been taken intoFig.1 Division of Nanhudang Lake2 General satiation of the study areaNanhudang Lake is seated at Yangchengintegrated consideration. Second, it is short of the analysis of landscape ecology and landscape pattern. Though some theoretical thoughts of ecology and landscape ecology have bee n gradually introduced into the construction of waterfront landscape, there isn’t a set of systematic theory. Third, there is no quantitative analysis. The current landscape construction is primarily based qualitative analysis, without quantitative analysis and evaluation.Waterfront landscape construction is a complex and multi-objective systematicengineering[5], should integrate knowledge and methods of architecture, geography, ecology and so on. Based on landscape ecology, waterfront landscape pattern should be analyzed, providing a reference for waterfront landscape construction.District on the southwest of Changshu City and it is a hot spot of classical water tourist areas. Shanghu Lake, Wangyu River,Nanhudang Lake, Kuncheng Lake and Shajia River have constituted a characteristic water eco-tourism route of Changshu City. The paper has selected Nanhudang Lake and the area within 500 m along the lake as the study area.According to the pattern and water landscape of Nanhudang, it has been divided into three sections, and the base line of each section has been set (the base line is the basic framework organizing spatial sequence and also the linear structure relating each isolated landscape factor[6]) . The three sections have been analyzed and evaluated. First, the water quality of the first section is good, there exist some natural wetlands and beautiful pastoral scenery, but it is narrow. Second, the second section belongs to traditional agricultural land, with pretty scenery, peasant landscape, tranquil and limpid water. Some islands have been distributed sporadically. The surrounding natural environment is good and this section becomes wide. Third, the third section is the eastern chemical industrial intensive area, where water pollution is serious and water quality is poor. Besides, the surrounding area of refuse landfill is ecologically sensitive.3 Study methods and contents3.1 Classification of landscape ecology3.1.1 Principles for landscape ndscape ecology classification refers that landscape eco-system should be classifiedTable 1 Common landscape pattern indexesClassification Index MeaningLandscape patch Fractal dimension Measuring the complexity of the shapes of patchescharacteristicindexExtension index Repres enting the difference between patches’ shapes and the round; the larger the index is, the longer thepatch is, largely different from the round, showing that the surrounding area of the patch is developedLandscapediversity Diversity Comprehensively reflecting the abundance and homogeneity of landscape patches; the higher the value is,index the more abundant landscape types are, the more complex landscape structure isDominance Describing the dominance degree of one or several landscape patches in landscape pattern; the higher thevalue is, the larger the deviation is, that is, the proportion of each landscape type composing the landscapediffers largelyRelative homogeneous Describing the distribution evenness of each landscape typedegreeLandscape space Isolation degree Representing the separation degree of different patches in a certain landscape type; the higher the value is,configurationindex the more scattered regional landscapes in distribution are, and the higher the fragmentation isLandscape fragmentation Indicating the degree of landscape being separated, reflecting the interference of human activity to landscapeto a certain degree; when the value is 0, the landscape is not destroyed totally; when it is 1, landscape isdestroyed totallyFragmentation of landscape Reflecting the degree of one type of patch being interfered; the lower the value is, the larger the individualinternal habitat patch is, reflecting that human interference is smallPatch density Reflecting the fragmentation of landscape being separated; the higher the value is, the larger patch densityis, the higher the fragmentation is3.2.2 Analysis of landscape pattern results.3.2.2.1 Landscape patches’ characteristic index. As for Nanhudang, fractal dimension and extension index of each patch have been from the perspective of function and structure, based on current materials and comprehensive analysis of natural feature, human activity and social economic condition of the study area through selecting classification indexes according to certain principles, references and targets. It is the foundation of landscape structure and function research, and also the precondition for the analysis of landscape pattern and planning, evaluation and management of landscape ecology.The premise of landscape pattern analysis is landscape ecology classification. In addition to the structure and functional principle of landscape ecology, and landscape dynamic principle, the classification of landscape ecology should also follow other principles[7-8], which are comprehensiveness and dominance; target and practical principle; the combination of heterogeneity and homogeneity; the combination of quantitative and qualitative analysis; and the consistency of landscape function and ecological process.3.1.2 Landscape ecology classification of Nanhudang. Land use situation of the study area has been digitalized on screen, then a landscape map has been made, and an attribute database has been established. Land use map can be led to CAD. Through the figures, data and text materials, the patches’ division has been conducted on landscape ecology, so as to initially identify the scope selected, and the mean value has been and type of individual unit and construct a classification system. Landscape ecology of Nanhudang has been classified into water landscape (including fishponds), agricultural land (including vegetation land), residential land, industrial landscape (including refuse land fill), and unused land (equal to the total area deducts above-mentioned lands).3.2 Landscape pattern analysisLandscape is composed of patches of different sizes, and the spatial distribution ofpatches is called as pattern[9]. The qualitative description of landscape space pattern and heterogeneity is landscape pattern index which is the also the foundation to analyze the function and process of landscape structure. In landscape pattern analysis, it can connect the spatial characteristics with time process of landscape, so as to clearly analyze and describe the inherent law of landscape.3.2.1 Landscape pattern index. Landscape pattern index refers to highly condensed landscape pattern information, which can be used to compare the difference between landscapes and the study areas. It is a simple quantitative index reflecting landscape structural composition and spatial disposition characteristics. As for the analysis of landscape pattern, it has proposed many indexes currently. By combining with the actual situation of the study area, several indexes in Table 1 have been selected to study characteristics of waterfront landscape pattern calculated in Table 2. The value of fractal dimension of each landscape type is larger than 1, but close to 1, and their difference is not large, showing that these patches share a certain similarity and also this area has been interfered by human activity to a certain degree. The value of extension index of each patch is about 5. By combining with the land use map and the actual surveying materials, it is easy to find these landscape patches are close to be round but not long and narrow; and their shapes are regular.3.2.2.2 Landscape diversity Index. Land-scape diversify index of waterfront area of Nanhudang (the mean value of the three sections) is 1.125. The value of landscape diversity of the third section is low, indicating that this section has no a bundant landscape types and has a simple landscape structure. From the perspective of dominance (the mean value), it can be seen that the difference between maximum value and actual value of the diversity index of the third section is large, further showing that its landscape diversity deviates from the maximum diversity a lot, that is, the proportion of each landscape type differs a lot, or the landscape is dominated by a or several landscape types. Besides, the proportion of each landscape type in the other two sections doesn’t differ largely, each landscape distribution is even. The homogeneity further shows what have been illustrated above.3.2.2.3 Landscape spatial configuration.Among landscape types of waterfront area of Nanhudang Lake, landscape isolation of water landscape is smaller than that of agricultural land, followed by that of residential land and industrial landscape (Table 4). The isolation degree of industrial landscape is the largest, showing that industrial landscape is distributed in scatter, landscape distribution is complicated and fragmentation degree is high.Landscape fragmentation of waterfront area of Nanhudang is showed in Table 5. The fragmentation of agricultural land is high, implying that human activity has interfered with agricultural land. Water distribution is concentrated and its fragmentation is low. If fishponds are separated, the fragmentation of water area will increase.The internal habitat fragmentation of river channel of Nanhudang is high, which is related to the size of landscape patches and human interference, showing that the interference is large and landscape is fragmentized (Table 6)The patch density of the study area is small. It can be seen from the calculation data of the three sections that the patch density of water landscape is smaller than that of agricultural land, followed by that of residential land and industrial landscape (Table 7). It shows that the fragmentation of water area is low, landscapes are distributed densely; but other types of landscape are in contrary. This index also reflects the degree of each landscape type being interfered.3.3 Landscape planning of NanhudangBased on the analysis and evaluation, in view of different problems existing in the three sections of Nanhudang, different eco-landscape constructions have been carried out (Table 8).Though a definite division has been given, there is no definite boundary between each landscape zone and between differentspaces composed of landscape zones. They integrate, and set each other off, unifying as a whole.3.3.1 The first section. The shoreline should be adjusted to broaden the water area, which, on the one hand, helps sediments from Wangyu River deposit, further purifying the water; on the other hand, is beneficial to the navigation of ships. As to wetlands on both banks, it should protect existing wetland eco-Table 2 Calculation results of fractal dimensionWater landscape (including fishponds)Agricultural land (includingResidential landIndustrial landscape (including theSection vegetation lands)refuse landfill)Fractal dimension Extension index Fractal dimension Extension index Fractal dimension Extension index Fractal dimension Extension index1 1.128,8 5.386,3 1.068,8 5.355,1 1.057,3 5.565,7 1.071,88.170,92 1.066,8 6.203,4 1.080,4 5.783,8 1.052,3 5.183,4 1.035,6 4.763,33 1.075,6 6.328,9 1.054,9 5.210,1 1.064,0 5.476,8 1.032,5 4.634,2 Table 3 Calculation results of diversity index, dominance and relative homogeneous degreeSection Diversity index Dominance Relative homogenous degree1 1.285,80.323,70.734,62 1.122,90.486,50.551,930.966,90.642,60.454,8Table 4 Calculation results of isolation degreeWater landscapeAgricultural Industrial landscapeSection land (including Residential land(including the refuse(including fishponds)vegetation lands)landfill)10.005,30.007,20.027,4 2.622,420.001,80.014,70.103,10.211,530.001,50.023,90.308,10.833,4Table 5 Calculation results of landscape fragmentation FN 1 and FN 2LandscapeLandscape fragmentation (FN 2)Water landscapeAgriculturalSection fragmentationResidentialIndustrial landscape (includingland (including(FN 1)land(including refuse landfill)fishponds)vegetation lands)10.003,70.109,40.625,00.187,50.015,62 0.004,2 0.120,9 0.560,4 0.230,8 0.044,030.003,70.142,90.628,60.085,70.028,6Table 6 Calculation results of the fragmentation index FI 1 and FI 2 of landscape internal habitat areaSectionThe fragmentation index of landscape internal habitat area (FI 1)The fragmentation index of la ndscape internal habitat area (FI 2)Water areaAgricultural Residential Industrial UnusedWater areaAgriculturalResidential Industrial Unusedlandlandlandscapelandlandlandlandscapeland10.699,70.578,40.882,10.997,00.842,80.869,30.946,60.967,30.998,70.842,82 0.416,7 0.765,0 0.951,8 0.981,8 0.884,7 0.868,7 0.980,1 0.994,8 0.987,5 0.884,7 30.345,10.836,80.983,40.993,20.841,40.891,30.973,90.994,90.997,10.841,4。