外文翻译---静力弹塑性分析法在侧向荷载分布方式下的评估研究
静力弹塑性分析方法简介
静力弹塑性分析方法简介摘要:PUSHOVER方法是基于性能/位移设计理论的一种等效静力弹塑性近似计算方法,该方法弥补了传统的基于承载力设计方法无法估计结构进入塑性阶段的缺陷,在计算结果相对准确的基础上,改善了动力时程分析方法技术复杂、计算工作量大、处理结果繁琐,又受地震波的不确定性、轴力和弯矩的屈服关系等因素影响的情况,能够非常简捷的求出结构非弹性效应、局部破坏机制、和整体倒塌的形成方式,便于进一步对旧建筑的抗震鉴定和加固,对新建筑的抗震性能评估以及设计方案进行修正等。
PUSHOVER方法以其概念明确、计算简单、能够图形化表达结构的抗震需求和性能等特点,正逐渐受到研究和设计人员的重视和推广。
目前,国内外论述PUSHOVER方法的文章已经很多,但大部分是针对某一方面的论述。
为了给读者一个比较快速全面的认识,本文在综合大量文献的基础上,对PUSHOVER 方法的基本原理、分析步骤、等效体系的建立、侧向荷载的分布形式等方面做了比较全面的论述。
关键词:基于性能抗震设计;静力弹塑性分析;动力时程分析方法;恢复力模型;目标位移1前言结构分析方法基本可以分为弹性方法和弹塑性方法。
按对地震得不同处理方式,又分为等效静力分析与动力时程分析。
一般来说动力弹塑性时程分析方法能较真实地模拟地震作用过程,但是,由于计算工作量巨大,地震波的不确定性等因素的影响,此方法尚处于科研阶段,在短期内做到实用化非常困难。
自20世纪90年代美国学者提出基于性能设计的抗震设计思想以来,PUSHOVER方法由于其简单方便以及对结构特性的良好表现性,很快成为各国学者积极讨论广泛研究的焦点之一。
经过十几年的研究,已经取得了较大发展,并且得到了美国的SEAOCVision2000,ATC–33,ATC–34,ATC–40,FEMA273,FEMA274[1-3];欧洲的Eurocode8和日本的BuildingStandardLawofJapan等规范或规程的认可,我国也将这种方法引入了《建筑抗震设计规范》(GB50011-2001)。
静力弹塑性性分析

铰位置
单元中心 单元中心 单元中心 单元中心
My, Mz
(弯矩)
Copyright ⓒ2000-2007MIDAS Information Technology Co., Ltd.
定义铰特性值—M铰(FEMA)
1 3 4 5 1 2 3
选择屈服强度的输入方法 选择I、J端的特性是对称还是非对称 单元两端特性为非对称时在此输入 选择受拉和受压区段特性是否相同 输入M/MY、D/DY 输入屈服强度 用户输入屈服变形(新
Displacement
Cs接近0.0时,将自动终止分析
Copyright ⓒ2000-2007MIDAS Information Technology Co., Ltd.
Pushover荷载工况
当前刚度比
分析模型
位移控制结果: 可获得稳定解
荷载控制结果:屈服后的刚度为0.0,所以无法获 得稳定解
选择骨架曲线类型: My和Mz只能选择同样类型的曲线 *.PMM铰的刚度折减系数在屈服面特性窗口中进行设置。 屈服面特性窗口
6
屈服强度的定义: 自动计算时不必用户输入 - 考虑轴力变化的影响时,在各步骤计算中都将考 虑变化的轴力对屈服面的影响。 定义屈服面: 自动计算时不必输入
选择屈服面特性的计算方法 定义刚度折减系数
2
3 4 6
5
7
5
7
PMM铰类型中即使选择了用户输入也不能修改屈 服强度 实际分析中并不使用该值。
Copyright ⓒ2000-2007MIDAS Information Technology Co., Ltd.
步骤同“钢筋混凝土结构抗震分析及设计”
Copyright ⓒ2000-2007MIDAS Information Technology Co., Ltd.
对某工程的静力弹塑性分析 (push-over)的探讨

对某工程的静力弹塑性分析(push-over)的探讨摘要:本文简要介绍了静力弹塑性分析的原理和实施步骤,并通过工程实例进行相关的对比和讨论。
关键词:静力弹塑性分析;push-over;反应谱;结构抗震性能评价1 前言利用静力弹塑性分析(Pushover Analysis)进行结构分析的优点在于:既能对结构在多遇地震下的弹性设计进行校核,也能够确定结构在罕遇地震下潜在的破坏机制,找到最先破坏的薄弱环节,从而使设计者仅对局部薄弱环节进行修复和加强,不改变整体结构的性能,就能使整体结构达到预定的使用功能;而利用传统的弹性分析,对不能满足使用要求的结构,可能采取增加新的构件或增大原来构件的截面尺寸的办法,结果是增加了结构刚度,造成了一定程度的浪费,也可能存在新的薄弱环节和隐患。
对多遇地震的计算,可以与弹性分析的结果进行验证,看总侧移和层间位移角、各杆件是否满足弹性极限要求,各杆件是否处于弹性状态;对罕遇地震的计算,可以检验总侧移和层间位移角、各个杆件是否超过弹塑性极限状态,是否满足大震不倒的要求。
2 原理与实施步骤2.1 原理静力非线性分析方法是基于性能评估现有结构和设计新结构的一种方法。
它是将静力弹塑性分析和反应谱相结合进行图解的快速计算方法。
其原理是使结构分析模型受到一个沿结构高度为单调逐渐增加的侧向力或侧向位移,直至控制点达到目标位移或建筑物倾覆为止。
基于结构行为设计使用Pushover分析,包括形成结构近似需求曲线和能力曲线,并确定曲线交点。
需求曲线基于反应谱曲线,能力曲线基于静力非线性Pushover分析。
在Pushover分析中,结构受到逐渐增加的荷载作用,从而得到需求曲线和能力曲线的交点,即性能点。
由于性能点定义了结构的底部剪力和位移,因此通过结构在性能点的行为和现行规范进行比较,从而确定结构是否满足要求。
实施步骤准备工作:建立结构模型,包括几何尺寸、物理参数以及节点和构件的编号,并输入构件的实配钢筋以便求出各个构件的塑性承载力。
浅谈静力弹塑性分析(Pushover)的理解与应用

浅谈静力弹塑性分析(Pushover )的理解与应用摘要:本文首先介绍采用静力弹塑性分析(Pushover )的主要理论基础和分析方法,以Midas/Gen 程序为例,采用计算实例进行具体说明弹塑性分析的步骤和过程,表明Pushover 是罕遇地震作用下结构分析的有效方法。
关键词:静力弹塑性 Pushover Midas/Gen 能力谱 需求谱 性能点一、基本理论静力弹塑性分析方法,也称Pushover 分析法,是基于性能评估现有结构和设计新结构的一种静力分析方法,在一定精度范围内对结构在罕遇地震作用下进行弹塑性变形分析。
简要地说,在结构计算模型上施加按某种规则分布的水平侧向力或侧向位移,单调加荷载(或位移)并逐级加大;一旦有构件开裂(或屈服)即修改其刚度(或使其退出工作),进而修改结构总刚度矩阵,进行下一步计算,依次循环直到控制点达到目标位移或建筑物倾覆为止,得到结构能力曲线,之后对照确定条件下的需求谱,并判断是否出现性能点,从而评价结构是否能满足目标性能要求。
Pushover 分析的基本要素是能力谱曲线和需求谱曲线,将两条曲线放在同一张图上,得出交会点的位移值,同位移容许值比较,检验是否满足特定地震作用下的弹塑性变形要求。
能力谱曲线由能力曲线(基底剪力-顶点位移曲线)转化而来(图1)。
与地震作用相应的结构基底剪力与结构加速度为正相关关系,顶点位移与谱位移为正相关关系,两种曲线形状一致。
其对应关系为:1/αG V S a =roofroof d X S ,11γ∆=,图1 基底剪力-顶点位移曲线转换为能力谱曲线其中1α、1γ、roof X ,1分别为第一阵型的质量系数,参与系数、顶点位移。
该曲线与主要建筑材料的本构关系曲线具有相似性,其实其物理意义亦有对应,在初始阶段作用力与变形为线性关系,随着作用力的增大,逐渐进入弹塑性阶段,变形显著增长,不论对于构件,还是结构整体,都是这个规律。
需求谱曲线由标准的加速度响应谱曲线转化而来。
外文翻译---静力弹塑性分析法在侧向荷载分布方式下的评估研究
静力弹塑性分析法在侧向荷载分布方式下的评估研究Armagan KORKMAZ1, Ali SARI21访问学者,土木工程学院, 得克萨斯大学, 奥斯汀, TX 78712, PH: 512-232-9216;armagan@2博士, 土木工程学院, 得克萨斯大学, 奥斯汀, TX 78712, PH: 512-232-9216;ali_sari@摘要:这项研究的目的是通过弹塑性分析法和非线性时程分析法来评估框架结构的性能或多种荷载形式及自然周期的多样性。
弹塑性分析法的荷载分布状态有三角形、IBC(k=2),和矩形。
在这个研究中四种典型的钢筋混凝土框架结构被采用,它们分别有四种不同的自然周期。
非线性时程分析法是计算地震的最好方法,但美国的FEMA-273容量震谱法和ATC-40位移系数法推荐使用静力弹塑性分析法。
这篇论文将比较分别利用静力弹塑性分析法与非线性时程分析法分析所得到的结果。
为了评估弹塑性分析法在三种不同荷载形式和四种自然周期下的结果,非线性时程分析法也被执行来对照。
在不同地震下分布在全球的50个站点纪录了地面运动情况被用来做分析,通过比较静力弹塑性分析法和非线性时程分析法的结果来选择这种典型框架结构在特殊自然周期下最佳的荷载分布方式。
关键词:静力弹塑性分析、非线性时程分析、荷载形式、抗弯矩框架前言一般的抗震设计中仅仅只有安全和碰撞是在地震设计规范中明确要求避免的,抗震设计一般基于结构在地震中的性能表现。
这样在低的地震水平下就要求考虑结构的非弹性行为。
FEMA-273和ATC-40采用静力弹塑性分析法而不是非线性时程分析,因为前者在抗震计算中能得到更精确度结果。
在抗震计算的目的是:(a)、在经常发生的小震情况下避免非结构破坏;(b)、在偶尔发生的中震情况下避免结构破坏和最小限度的非结构破坏;(c)、在罕遇大震下不倒塌或产生严重破坏。
结构设计要明确的在这三种情况下进行。
这项研究的目的是通过弹塑性分析法和非线性时程分析法来评估框架结构的性能或多种荷载形式及自然周期的多样性。
结构抗震静力弹塑性分析方法(Pushover)的研究与改进的开题报告
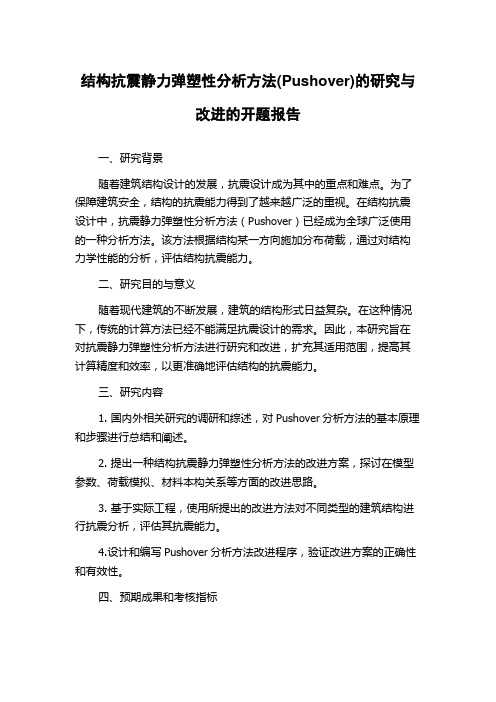
结构抗震静力弹塑性分析方法(Pushover)的研究与改进的开题报告一、研究背景随着建筑结构设计的发展,抗震设计成为其中的重点和难点。
为了保障建筑安全,结构的抗震能力得到了越来越广泛的重视。
在结构抗震设计中,抗震静力弹塑性分析方法(Pushover)已经成为全球广泛使用的一种分析方法。
该方法根据结构某一方向施加分布荷载,通过对结构力学性能的分析,评估结构抗震能力。
二、研究目的与意义随着现代建筑的不断发展,建筑的结构形式日益复杂。
在这种情况下,传统的计算方法已经不能满足抗震设计的需求。
因此,本研究旨在对抗震静力弹塑性分析方法进行研究和改进,扩充其适用范围,提高其计算精度和效率,以更准确地评估结构的抗震能力。
三、研究内容1. 国内外相关研究的调研和综述,对Pushover分析方法的基本原理和步骤进行总结和阐述。
2. 提出一种结构抗震静力弹塑性分析方法的改进方案,探讨在模型参数、荷载模拟、材料本构关系等方面的改进思路。
3. 基于实际工程,使用所提出的改进方法对不同类型的建筑结构进行抗震分析,评估其抗震能力。
4.设计和编写Pushover分析方法改进程序,验证改进方案的正确性和有效性。
四、预期成果和考核指标本研究旨在对抗震静力弹塑性分析方法进行改进研究。
主要的预期成果包括:1.提出一种结构抗震静力弹塑性分析方法的改进方案,改进方案应能够在某些方面比传统的方法更加准确和高效。
2.通过实际工程评估所提出的改进方法的优缺点,验证其适用性和实用性。
3.设计和编写Pushover分析方法改进程序,展示改进方案的正确性和有效性。
预计的考核指标包括:论文的质量、研究方法是否合理、研究成果是否能够达到预期目标、研究结果的可重复性和实用性。
五、研究步骤与进度安排1.查阅相关文献,了解国内外关于结构抗震静力弹塑性分析方法的研究现状和进展,设计改进方案。
预计用时2周。
2.对所提出的改进方案进行模拟,并对改进方案中涉及的各项参数进行详细分析研究。
静力弹塑性分析方法与与动力弹塑性分析方法的优缺点

静力弹塑性分析方法与与动力弹塑性分析方法的优缺点Pushover)分析法1、静力弹塑性分析方法(Pushover)分析法优点:(1)作为一种简化的非线性分析方法,Pushover方法能够从整体上把握结构的抗侧力性能,可以对结构关键机构及单元进行评估,找到结构的薄弱环节,从而为设计改进提供参考。
(2)非线性静力分析可以获得较为稳定的分析结果,减小分析结果的偶然性,同时花费较少的时间和劳力,较之时程分析方法有较强的实际应用价值。
2、静力弹塑性分析方法(Pushover)分析法缺点:(1)它假定所有的多自由度体系均可简化为等效单自由度体系,这一理论假定没有十分严密的理论基础。
(2)对建筑物进行Pushover分析时首先要确定一个合理的目标位移和水平加载方式,其分析结果的精确度很大程度上依赖于这两者的选择。
(3)只能从整体上考察结构的性能,得到的结果较为粗糙。
且在过程中未考虑结构在反复加载过程中损伤的累积及刚度的变化。
不能完全真实反应结构在地震作用下性状。
二、弹塑性时程分析法1、时程分析法优点:(1)采用地震动加速度时程曲线作为输入,进行结构地震反应分析,从而全面考虑了强震三要素,也自然地考虑了地震动丰富的长周期分量对高层建筑的不利影响。
(2)采用结构弹塑性全过程恢复力特性曲线来表征结构的力学性质,从而比较确切地、具体地和细致地给出结构的弹塑性地震反应。
(3)能给出结构中各构件和杆件出现塑性铰的时刻和顺序,从而可以判明结构的屈服机制。
(4)对于非等强结构,能找出结构的薄弱环节,并能计算出柔弱楼层的塑性变形集中效应。
2、时程分析法缺点:(1)时程分析的最大缺点在于时程分析的结果与所选取的地震动输入有关,地震动时称所含频频成分对结构的模态n向应有选择放大作用,所以不同时称输入结果差异很大。
(2)时程分析法采用逐步积分的方法对动力方程进行直接积分,从而求得结构在地震过程中每一瞬时的位移、速度和加速度反应。
所以此法的计算工作十分繁重,必须借助于计算机才能完成。
侧向荷载分布方式对静力弹塑性分析结果的影响_熊向阳

[文章编号]1002-8528(2001)05-0008-06侧向荷载分布方式对静力弹塑性分析结果的影响熊向阳,戚震华(同济大学土木工程学院,上海200331)[摘 要]就侧向荷载分布方式,对静力弹塑性pushover 分析结果的影响进行了研究。
用五种不同的侧向荷载分布方式,对两幢十五层和二十层框架结构进行了分析。
分析结果表明,在不同侧向荷载分布方式作用下,pushover 分析结果相差很大。
[关键词]静力弹塑性分析;pushover;适应性侧向荷载分布方式;高振型影响[中图分类号]T U 312+11;T U 31313 [文献标识码]AT he Influence of Lateral Load Patterns on the Resultsof Static Pushover A nalysisXI ON G X iang -yang ,QI Zhen -hua(College of Civil Engineer ing ,T ongj i University ,Shanghai 200331,China)[Abstract]I n this paper,the influence o f later al load patter ns on the results of stat ic pushover analysi s has been studied.T he stat ic pushover analysis with five different later al lo ad patterns was applied to two fr ame structur es of tall building.It is demonstrated t hat the analysis results may v ar y sig nificantly under different lateral load patterns.[Key words]static nonlinear analysis;push -over;adaptive lateral load pattern;higher mode effects[收稿日期]2001-06-25[作者简介]熊向阳(1977)),男,硕士研究生1 引 言在罕遇地震作用下,抗震结构都会进入弹塑性状态,因此,为了满足结构在大震作用下的抗震要求,有必要研究和计算结构的弹塑性变形要求,因而结构弹塑性分析逐已成为抗震设计的一个重要组成部分。
- 1、下载文档前请自行甄别文档内容的完整性,平台不提供额外的编辑、内容补充、找答案等附加服务。
- 2、"仅部分预览"的文档,不可在线预览部分如存在完整性等问题,可反馈申请退款(可完整预览的文档不适用该条件!)。
- 3、如文档侵犯您的权益,请联系客服反馈,我们会尽快为您处理(人工客服工作时间:9:00-18:30)。
静力弹塑性分析法在侧向荷载分布方式下的评估研究Armagan KORKMAZ1, Ali SARI21访问学者,土木工程学院, 得克萨斯大学, 奥斯汀, TX 78712, PH: 512-232-9216;armagan@2博士, 土木工程学院, 得克萨斯大学, 奥斯汀, TX 78712, PH: 512-232-9216;ali_sari@摘要:这项研究的目的是通过弹塑性分析法和非线性时程分析法来评估框架结构的性能或多种荷载形式及自然周期的多样性。
弹塑性分析法的荷载分布状态有三角形、IBC(k=2),和矩形。
在这个研究中四种典型的钢筋混凝土框架结构被采用,它们分别有四种不同的自然周期。
非线性时程分析法是计算地震的最好方法,但美国的FEMA-273容量震谱法和ATC-40位移系数法推荐使用静力弹塑性分析法。
这篇论文将比较分别利用静力弹塑性分析法与非线性时程分析法分析所得到的结果。
为了评估弹塑性分析法在三种不同荷载形式和四种自然周期下的结果,非线性时程分析法也被执行来对照。
在不同地震下分布在全球的50个站点纪录了地面运动情况被用来做分析,通过比较静力弹塑性分析法和非线性时程分析法的结果来选择这种典型框架结构在特殊自然周期下最佳的荷载分布方式。
关键词:静力弹塑性分析、非线性时程分析、荷载形式、抗弯矩框架前言一般的抗震设计中仅仅只有安全和碰撞是在地震设计规范中明确要求避免的,抗震设计一般基于结构在地震中的性能表现。
这样在低的地震水平下就要求考虑结构的非弹性行为。
FEMA-273和ATC-40采用静力弹塑性分析法而不是非线性时程分析,因为前者在抗震计算中能得到更精确度结果。
在抗震计算的目的是:(a)、在经常发生的小震情况下避免非结构破坏;(b)、在偶尔发生的中震情况下避免结构破坏和最小限度的非结构破坏;(c)、在罕遇大震下不倒塌或产生严重破坏。
结构设计要明确的在这三种情况下进行。
这项研究的目的是通过弹塑性分析法和非线性时程分析法来评估框架结构的性能或多种荷载形式及自然周期的多样性。
3、5、8和15层的四种框架结构被用来分析,分析中荷载分布状态选择三角形IBC(k=1),IBC(k=2)和矩形。
其中k是与结构周期相关的系数,用来定义荷载竖向因素。
这四种结构用非线性程序DRAIN-2D (Prakash, V., Powell, G., Campbell, S., 1993)来分析,并把其结果与记录的相应数分布方式。
地表运动数据在这个研究中,50个不同的数据被用于非线性时程分析法中,在表1中给出。
所有数据来自四个A、B、C、D四个等级不同地点,它们的横波速度分别是> 750 m/s, 360m/s至750 m/s, 180 m/s至360 m/s, 180 m/s。
这些数据选至发生在世界不同地方的毁灭性地震,其中地震的名称、数据源、记录名称、加速度峰值、有效期及过期类型都在表1中给出。
地表加速度峰值大约在0.046g至0.395g,其中g为重力加速度。
所有地表运动数据取至距离地面最大为20km的近地范围内。
框架结构的描述有着典型截面和钢筋的3、5、8和15层的钢筋混凝土框架结构见图1,这些钢筋混凝土结构是按Turkish 规范设计。
考虑结构所处环境为土质类型Z1、地震1区,设计为等级为1级,其中恒载、活载以及地震荷载在设计中已经被考虑。
所有这些钢筋混凝土框架结构都有3跨,长8m,层高3m。
柱子假定与地基固结,钢筋的屈服强度为22 kN/cm2 ,混凝土的抗压强度为1.6kN/cm2.3层框架结构的第一周期经计算为0.54 s ,结构中所有的框架梁截面为矩形,宽25 cm、高25cm,框架柱截面尺寸为30cmx30cm。
5层框架结构的第一周期经计算为0.72 s ,框架梁截面为矩形,宽25 cm、高50cm,框架柱截面尺寸前三层为40cmx40cm,后两层为30cmx30cm。
8层和15层的框架结构的周期分别为0.90 s和1.20s ,两者的框架梁截面为矩形,宽25 cm、高55cm。
8层结构框架柱截面尺寸前五层为50cmx50cm,后三层为40cmx40cm,而15层结构框架柱截面尺寸前八层为80cmx80cm,后七层为60cmx60cm。
框架结构的静力弹塑性分析法对于低等级的性能,为了估计其需求,就需要考虑结构的非弹性行为。
静力弹塑性分析法可以用来识别地震的危险,并选择性能等级以此来设计性能目标。
在静力弹塑性分析法中,以侧向荷载近似代表由层间产生的相关惯性力并使结构在这个侧向荷载作用下产生的位移大于地震设计中预期的位移(Li, Y.R., 1996)。
这种分析方法提供了剪力与位移的置换关系并指出非弹性的界限和结构侧面负荷能力,而曲线斜率方面的改变表明了各有限元的屈服强度。
静力弹塑性分析法的主要目的是决定结构的荷载数量和变形能力。
这些信息都能够用于评价结构的整体性。
在详细设计了钢筋混凝土框架结构后,就用静力弹塑性分析法评估结构的地震反应,为此电脑程序Drain 2D会被用到。
有以下三种简化荷载形式:三角形IBC (k=1),IBC(k=2)和矩形,其中k是与结构周期相关的系数,用来定义荷载竖向因素。
它们也会用于3、5、8和15层的钢筋混凝土框架结构的静力弹塑性分析。
VC F vx x = (1) =VX C ∑=n i ki ik x x h w h w 1(2) 式中:C vx 为竖向分布参数V 为总侧向力设计值,或结构底部剪力w i 和w x 为部分结构自重h i 和h x 为结构高度(至基地算起)k 为与结构周期相关的参数除这些侧向荷载外,结构还承受恒载和活载。
P-△作用在静力弹塑性分析中同样被考虑。
侧向荷载一直会增加,直到3、5和8层的框架结构楼顶位移达到50cm ,15层的框架结构楼顶位移达到100 cm 。
梁柱单元用于结构分析,假定梁在水平方向是刚性的,考虑非弹性影响单元是铰接的,而应变强化被忽略。
双线性弯矩—转角关系假定用于所用梁柱单元,由ACI 318-89建议的轴压荷载—弯矩关系、P —M 、交互关系被用于柱单元屈服表面。
薄弱破碎区段的惯性矩I cr ,在分析的时候用于所有的梁柱。
I cr 取总惯性矩I g 的一半。
由静力弹塑性分析法所得的结果见图2-5。
每个框架结构的弹塑性曲线都分均布荷载、三角形荷载以及IBC 荷载三种荷载方式给出,显示了剪重比与之相对应的层间位移。
基底剪力V 由地面以上所有荷载相加得到,结构重力W 所有楼层重量之和。
除此之外,这些曲线还表示结构抗侧力的损失情况和柱位移下的剪切破坏。
曲线中曲率的变化表明了不同结构单元屈服情况,首先是梁屈服,接着是柱屈服和各单元的剪切破坏。
随着结构自重的增加,顶层位移增大,出现首次屈服和剪切破坏(见图2-5)。
在相应的结构位移(水平位移)下,矩形荷载分布比其它荷载分布形式相比会造成更高的剪重比。
框架结构的非线性时程分析前面对框架结构进行了静力弹塑性分析,下面用非线性时程分析法对其进行分析。
这些框架结构都承受恒载和活载,同静力弹塑性分析法一样,P-△作用在非线性时程分析中也被考虑。
在非线性时程分析中Drain 2D 程序被利用,有限元程序也被用来模拟结构。
在静力弹塑性分析中所描述的模型同样用于非线性时程分析法中,且假定质量集中在节点处。
结构承受的种地震情况都是在以下地震中被记录的,这些地震是美国南加州Anza 地震、美国加州Parkfield 地震、美国西部Morgan Hill 地震、土耳其Kocaeli 地震、日本Coyota Lake 地震、美国N. Palm Springs 地震、美国加州Northridge 地震、美国加州Santa Barbara 地震、美国Imperial Valley 地震、美国加州Cape Mendocino 地震、日本神户Kobe 地震、美国Central California 地震、美国加州Lytle Creek 地震、美国南加州Whittier Narrows 地震、美国Hollister Westmoreland 地震、美国Livermor 地震、美国加州Cape Mendocino 地震。
这些数据取自A 、B 、C 、D 四类地区,来用不同荷载情况,即矩形、三角形和IBC(k=2)下四种框架结构的结果。
结论在详细设计了钢筋混凝土框架结构后,静力弹塑性分析法和非线性时程分析法被执行来评价在不同荷载情况下的地震反应。
静力弹塑性分析法假定抗震所设的目标位移量与实际地震下的最大位移大致一样。
从图-2至图-5可以看出,对于高层的框架结构位移增大,出现首次屈服和剪切破坏。
在相应的结构位移(水平位移)下,矩形荷载分布比其它荷载分布形式相比会造成更高的剪重比。
如图-6所示,在所选的地表运动数据下,非线性时程分析法在三角形荷载、矩形荷载和IBC(k=2)荷载情况的结果相互比较知:静力弹塑性曲线在高层框架结构(8和15层框架结构)下与非线性时程分析得出的结构不是很相符。
静力弹塑性分析法在矩形分布下所得的抗震要求要比其它荷载方式如三角形荷载、IBC(k=2)荷载形式下更合理。
参考文献1. ATC-40 (1996), “Seismic evaluation and Retrofit of Concrete Buildings”,Vol.1, Applied Technology Council, Redwood City, CA.2. FEMA-273 (1997),“NEHRP Guidelines for the Seismic Rehabilitation of Buildings, federal Emergency Managem ent Agency”, Washington D.C.3. IBC (2000) “International Building Code”.4. Prakash, V., Powell,G., Campbell, S. (1993), DRAIN 2D User Guide V 1.10, University of California at Berkeley, CA.5. Li, Y.R. (1996), “Non-Linear Time History And Pushover Analyses for Seismic Design and Evaluation” PhD Thesis, University of Texas, Austin, TX.6. Vision 2000 Committee (1995).Structural Engineering Association of California, CA.EVALUATION OF LATERAL LOAD PATTERNIN PUSHOVER ANALYSISArmagan KORKMAZ1, Ali SARI21Visitor Researcher, Department of Civil Engineering, University of Texas at Austin, Austin,TX78712, PH: 512-232-9216; armagan@2Ph. D. Student, Department of Civil Engineering, University of Texas at Austin, Austin, TX 78712, PH: 512-232-9216; ali_sari@ABSTRACTThe objective of this study is to evaluate the performance of the frame structures or various load patterns and variety of natural periods by performing pushover and nonlinear dynamic time history analyses. The load distributions for pushover analyses are chosen as triangular, IBC (k=2) and rectangular. Four different framed structures are used, which are typical reinforced concrete (R\C) frame systems and have four different natural periods. Even though the nonlinear dynamic time history analysis is the best way to compute seismic demands FEMA-273 and ATC-40 proposes to use of nonlinear static procedure or pushover analysis. This paper is also intended to compare the results of pushover and nonlinear dynamic time history analyses. To evaluate the results from the pushover analyses for three load patterns and also four natural periods, nonlinear dynamic time history analyses are performed. Earthquake ground motions recorded at 50 stations during various earthquakes overall the world are used in the analyses. Pushover and nonlinear time history analyses results are compared to choose the best load distribution for specific natural period for this type of frame structure.Keywords: Pushover analysis, nonlinear time history, load patterns, moment-resisting frameINTRODUCTIONOnly the life safety and collapse prevention in general earthquake resistant design phenomena are explicitly prevented in seismic design codes. The design is generally based on evaluating the seismic performance of structures. It is required to consider inelastic behavior while evaluating the1996, FEMA-273, 1997). The purposes in earthquake-resistance design are: (a) to prevent non-structural damage in minor earthquakes, which may occur frequently in life time, (b)to prevent structural damage and minimize non-structural damage in moderate earthquakes which may occur occasionally, (c) to prevent collapsing or serious damage in major earthquakes which may occur rarely. Designs are explicitly done only under the third condition.The objective of this study is to evaluate the performance of the frame structures for various load patterns and variety of natural periods by performing pushover and nonlinear dynamic time history analyses. 3, 5, 8 and 15 story R\C frame structures are used in the analyses and the load distributions for pushover analyses are chosen as triangular (IBC, k=1), IBC (k=2) and rectangular, where k is the an exponent related to the structure period to define vertical distribution factor (IBC, 2000). The four frame structures have been analyzed using nonlinear program DRAIN-2D (Prakash, V., Powell, G., Campbell, S., 1993) and the results have been compared by recorded response data. Both nonlinear static pushover analysis and nonlinear dynamic time history analysis are performed. The correlations between these nonlinear analyses are studied.The performance of the buildings subjected to various representative earthquake ground motions is examined. Finally, pushover and nonlinear time history analyses results are compared to choose the best load distribution (pattern) for specific natural period for these types of reinforced concrete frame structures.GROUND MOTION DATAFor this study, it is considered as 50 different data used in the nonlinear dynamic time history analyses, given in the Table 1. All the data are from different site classes as A, B, C and D. The shear velocities for the site classes A, B, C and D are Vs > 750 m/s, 360m/s to 750 m/s, 180 m/s to 360 m/s, and 180 m/s, respectively. The ground motion data are chosen from different destructive earthquakes around the world earthquake name, date of earthquake, data source, record name, peak ground accelerations (pga) for the components, effective durations and fault types for each data are presented in the Table1., respectively.The peak ground accelerations are in the range 0.046 to 0.395g, where g is acceleration due to gravity. All ground motion data are recorded in near-field region as in maximum 20 km distance.DESCRIPTION OF THE FRAME STRUCTURES3, 5, 8 and 15-story R\C frame structures with typical cross-sections and steel reinforcements are shown in Figure 1. The reinforced concrete frame structures have been designed according to the rules of the Turkish Code. The structures have been considered as an important class 1 with subsoil type of Z1 and in seismic region 1. The dead, live and seismic loads have been taken account during design.All reinforced concrete frame structures consist three-bay frame, spaced at 800 cm. The story height is 300 cm. The columns are assumed as fixed on the ground. Yield strength of the steel reinforcements is 22 kN/cm2and compressive strength of concrete is 1.6kN/cm2.The first natural period of the 3-story frame structure is computed 0.54 s. The cross-section of all beams in this frame is rectangular-shapes with 25cm width and 50cm height. The cross-section of all columns is 30cmx30cm. The first natural period of 5-story frame structure is 0.72 s and the cross-section of beams is 25cm width and 50cm height similar to 3-story frame. Cross-section of columns at the first three stories is 40cmx40cm and at the last two stories, it is 30cmx30cm. The eight-story and 15-story frame structures have natural period of 0.90 s and 1.20 s. The cross section of beams for both frame structures is 25cmx55cm. The 8-story frame structure has 50cmx50cm columns for the first five stories and 40cmx40cm for the last three stories. The cross section of columns for first eight stories in the 15-story frame structures is 80cmx80cm and at the last seven stories, it is 60cmx60cm. NONLINEAR STATIC PUSHOVER ANALYSIS OF FRAME STRUCTURESFor low performance levels, to estimate the demands, it is required to consider inelastic behavior of the structure. Pushover analysis is used to identify the seismic hazards, selection of the performance levels and design performance objectives. In Pushover analysis, applying lateral loads in patterns that represent approximately the relative inertial forces generated at each floor level and pushing the structure under lateral loads to displacements that are larger than the maximum displacements expected in design earthquakes (Li, Y.R., 1996). The pushover analysis provides a shear vs. displacement relationship and indicates the inelastic limit as well as lateral load capacity of the structure. The changes in slope of this curve give an indication of yielding of various structural elements. The main aim of the pushover analysis is to determine member forces and global and local deformation capacity of a structure. The information can be used to assessused. Three simplified loading patterns; triangular, (IBC, k=1), (IBC, k=2) and rectangular, where k is an exponent related to the structure period to define vertical distribution factor, are used in the nonlinear static pushover analysis of 3, 5, 8 and 15-story R\C frame structures.Load criteria are based on the distribution of inertial forces of design parameters. The simplified loading patterns as uniform distribution, triangular distribution and IBC distribution, these loading patterns are the most common loading parameters.Vertical Distribution of Seismic Forces:V C F vx x = (1)=VX C ∑=n i k iikx x h w h w 1 (2) where:C vx = Vertical distribution factorV = Total design lateral force or shear at the base of structurew i and w x = The portion of the total gravity load of the structureh i and h x = The height from the basek = An exponent related to the structure periodIn addition these lateral loadings, frames are subjected live loads and dead weights. P-△ effects have been taken into the account during the pushover analyses. The lateral force is increased for 3, 5 and 8-story frames until the roof displacement reached 50 cm and 100cm for15-story frame. Beam and column elements are used to analyze the frames. The beams are assumed to be rigid in the horizontal plane. Inelastic effects are assigned to plastic hinges at member ends. Strain-hardening is neglected in all elements. Bilinear moment-rotation relationship is assumed for both beam and column members. Axial load-Moment, P-M, interaction relation, suggested by ACI 318-89, is used as yielding surface of column elements. Inertial moment of cracked section, I cr , is used for both column and beam members during analyses. I cr is computed as half of the gross moment of inertia, I g .The results of the pushover analyses are presented in Figures 2 to 5. The pushover curves are shown for three distributions, and for each frame structures. The curves represent base shear-weight ratio versus story level displacements for uniform, triangular and IBC load distribution. Shear V was calculated by summing all applied lateral loads above the ground level, and the weight of the building W is the summation of the weights of all floors. Beside these, these curves represent the lost of lateral load resisting capacity and shear failures of a column at the displacement level. The changes in slope of these curves give an indication of yielding of various structural elements, first yielding of beam, first yielding of column and shear failure in the members. By the increase in the height of the frame structures,corresponding story displacement (horizontal displacement). NONLINEAR DYNAMIC TIME HISTORY ANALYSIS OF FRAME STRUCTURESAfter performing pushover analyses, nonlinear dynamic time history analyses have been employed to the four different story frame structures. These frames are subjected live and dead weights. Also P- △effects are under consideration as in pushover analysis. For time history analysis P-effects have been taken into the account. Finite element procedure is employed for the modeling of the structures during the nonlinear dynamic time history analyses. Drain 2D has been used for nonlinear time history analysis and modeling. The model described for pushover analyses has been used for the time history analyses. Mass is assumed to be lumped at the joints.The frames are subjected to 50 earthquake ground motions, which are recorded during Anza (Horse Cany), Parkfield, Morgan Hill, Kocaeli, Coyota Lake, N. Palm Springs, Northridge, Santa Barbara, Imperial Valley, Cape Mendocino, Kobe, Central California, Lytle Creek, Whittier Narrows, Hollister Westmoreland, Landers, Livermor and Cape Mendocino earthquakes, for the nonlinear dynamic time history analyses. These data are from different site classes as A, B, C and D.The selected earthquake ground motions have different frequency contents and peak ground accelerations. T he ground motion data are chosen from near-field region to evaluate the response of the frame structures in this region and comparison of them with pushover analyses results. The results of nonlinear time history analysis for 3, 5, 8 and15-story frame structures are presented in Figure 6. Pushover and nonlinear time history analyses results are compared to for specific natural period for four different frame structure and for each load distributions; rectangular, triangular and IBC (k=2).CONCLUSIONSAfter designing and detailing the reinforced concrete frame structures, a nonlinear pushover analysis and nonlinear dynamic time history analysis are carried out for evaluating the structural seismic response for the acceptance of load distribution for inelastic behavior. It is assumed for pushover analysis that seismic demands at the target displacement are approximately maximum seismic demands during the earthquake.According to Figures 2, 3, 4 and 5, for higher story frame structures, firstcorresponding story displacement.As it is presented in Figure 6, nonlinear static pushover analyses for IBC (k=2), rectangular, and triangular load distribution and nonlinear time history analyses results for the chosen ground motion data (all of them are near-field data) are compared. Pushover curves do not match with nonlinear dynamic time history analysis results especially for higher story reinforced pushover analyses results for rectangular load distribution estimate maximum seismic demands during the given earthquakes more reasonable than the other load distributions, IBC (k=2), and triangular.REFERENCES1. ATC-40 (1996), “Seis mic evaluation and Retrofit of Concrete Build ings”, Vol.1, AppliedTechnology Council, Redwood City, CA.2. FEMA 273 (1997). “NEHRP Guidelines for the Seismic Rehabilitation of Buildings,Federal Emergency Managem ent Agency”, Washington D.C.3. IBC (2000) “International Building Code”.4. Prakash, V., Powell, G., Campbell, S. (1993), DRAIN 2D User Guide V 1.10,University of California at Berkeley, CA.5. Li, Y.R. (1996), “Non-Linear Time History And Pushover Analyses for Seismic Design andEvaluation” PhD Thesis, Universit y of Texas, Austin, TX.6. Vision 2000 Committee (1995). Structural Engineering Association of California, CA.Table 1. Ground Motion Data Used in the Analyses60/603mf y=22kN/cm2Beams: 25x50 : As=10.30 cm225x55 : As=13.26 cm260/6060/6060/603m30/603m30/603m3m 60/6030/3050x50 : As=45.20 cm280x80 : As=145.00 cm225/503m25/5025/503m25/5025/5025/5025/5025/5040/4050/5050/5050/5050/503m50/5025/5525/5525/5560/6060/603m80/803m80/803m80/803m80/803m80/803m80/803m80/8030/603m30/603m30/603m30/603m30/603m30/603m30/603m30/603m3m3m8m8m8m3-story8m8m8m5-story8m8m8m8-story8m8m8m15-Story(a) (b) (c) (d)F igure 1. Diagram of analyzed 3, 5, 8 and 15-story R\C frames with typical cross sections and steel reinforcementsV /WV /WV /WV /WV /WV /WRC Frame, Pushover Curve, Rectangular LoadRC Frame, Pushover Curve, Triangular LoadRC Frame, Pushover Curve, IBC (k=2) Load0.080.080.080.07 0.070.070.06 0.06 0.060.050.05 0.050.04 2nd floor 0.04 0.04 2nd floor 3rd floor 3rd floor 0.03 4th Floor 0.03 0.03 4th floor 5th floor 5th floor 0.02 6th floor 0.02 0.02 6th floor 7th floor 7th floor 0.018th floor 0.01 0.01 8th floorRoofRoof0.000.00 0.000.005.00 10.00 15.0020.00displacement (cm)0.005.0010.0015.0020.00displacement (cm) 0.005.00 10.00 15.0020.00displacement (cm)Figure 4. Push-over Curves of 8-story R\C Frame for three different Load Patterns0.10 0.09 0.08 0.07 0.06 0.05 0.04 0.03 0.02 0.01 0.00RC Frame, Pushover Curve, Rectangular Load2nd floor 3rd floor 4th floor 5th floor 6th floor 7th floor 8th floor 9th floor 10th floor 11th floor 12th floor 13th floor 14th floor 15th floor Roof0.10 0.09 0.08 0.07 0.06 0.05 0.04 0.03 0.02 0.010.00RC Frame, Pushover Curve, Triangular Load2nd floor 3rd floor 4th floor 5th floor 6th floor 7th floor 8th floor 9th floor 10th floor 11th floor 12th floor 13th floor 14th floor 15th floor 16th floor0.10 0.09 0.08 0.07 0.06 0.05 0.04 0.03 0.02 0.010.00RC Frame, Pushover Curve, IBC (k=2) Load2nd floor 3rd floor 4th floor 5th floor 6th floor 7th floor 8th floor 9th floor 10th floor 11th floor 12th floor 13th floor 14th floor 15th floor Roof0.0020.00 40.00 60.00 80.00 displacement (cm) 0.0020.00 40.00 60.00 80.00 displacement (cm) 0.0020.00 40.00 60.00 80.00displacement (cm)V /WV /WV /WV /WFigure 5. Push-over Curves of 15-story R\C Fram e for three different Load Patterns0.200.18 0.160.140.12 0.160.14 0.120.10 0.100.080.060.04 0.020.080.06 0.040.020.0024681012displacement (cm)0.0024681 01 21 41 6dis p la cem en t (c m )RectangularIBCA andB site classes D site class R e c t a n g u larTrian g u la r IB CA a n dB s i te c l a s s esC s i te c l a s sD s i te c l a s sa) 3-Story Frameb) 5-Story Frame0.120.120.10 0.100.08 0.080.06 0.060.04 0.040.020.020.002468101214161820displacement (cm)0.0024681012141618202224262830displacement (cm)RectangularTriangular IBCA andB site classesC site classD site classRectangularTriangularIBCA andB site classesC site classD site classc) 8-Story Frame d) 15-Story Frame Figure 6. Pushover and Nonlinear Time History Results of 3, 5, 8 and 15-story Frames。