db2top工具详解
DB2性能工具简介

在数据库数据页损坏无法进行正常的数据操作时,可以通过db2dart进行数据恢复。当行,则可以在已损坏的表中用 db2dart命令进行数据导出,前提是数据库能连接上。 Db2dart dbname /ddel 然后按提示输入表id,表空间id,起始页,导出页数 Filename used for output data file is TS2T10.DEL. If existing file, data will be appended to it. Formatted data being dumped ... Dumping Page 0 .... Dumping Page 1 .... Table object data formatting end. 导出的数据就在TS2T10.DEL中,以文本形式保存。 由于db2dart命令不需要通过db2数据库管理器进行对数据库的访问,而是直接从磁盘 中读取数据的数据,因此,就算是数据表无法访问,也能进行数据的导出。不过当数 据量大时速度会十分慢。
db2dart 当数据库出现问题的时候,可以用db2dart进行检查,验证数据库以及相关数据库对象是 否正确 db2dart dbname /db Table inspection start: UCAR.TABLE4 Data inspection phase start. Data obj: 7 In pool: 2 Data inspection phase end. Index inspection phase start. Index obj: 7 In pool: 2 Scanning pages for unique index itoken(0) root page:385p. Scanning pages for unique index itoken(1) root page:386p. Index inspection phase end. Table inspection end. ......... Database inspection phase end. ______________________________________ The requested DB2DART processing has completed successfully! All operation completed without error; no problems were detected in the database. ______________________________________ Complete DB2DART report found in: PRODDB.RPT
数据库中top的用法
数据库中top的用法一、简介在数据库中,我们经常会遇到需要查询出排名靠前的数据的情况。
这时,就可以使用数据库中提供的TOP关键字来实现此目的。
TOP关键字用于限制查询结果集返回的记录数,只返回排名最靠前(或最靠后)的若干条数据。
在这篇文章中,我将详细介绍数据库中TOP关键字的用法。
二、基本语法在 SQL 中,不同数据库管理系统(DBMS)对于 TOP 关键字有不同的实现方式。
下面是几个常见 DBMS 中 TOP 的基本语法:1. MySQL: 使用 LIMIT 子句来实现 TOP 功能。
SELECT * FROM table_name LIMIT n;2. Oracle: 使用 ROWNUM 来筛选 TOP 记录。
SELECT * FROM (SELECT * FROM table_name ORDER BY column_name) WHERE ROWNUM <= n;3. Microsoft SQL Server: 使用 TOP 关键字来获取 TOP 记录。
SELECT TOP n * FROM table_name;三、示例应用下面将通过具体示例来展示如何使用 TOP 关键字来获取数据库中排名靠前的数据。
1. MySQL 示例:假设我们有一个学生成绩表格,表格结构如下:```sqlCREATE TABLE student_scores (id INT,name VARCHAR(50),score INT);```我们想要查询成绩排名前五名的学生记录,可以使用以下 SQL 语句:```sqlSELECT * FROM student_scores ORDER BY score DESC LIMIT 5;```这将返回成绩排名前五名的学生记录。
2. Oracle 示例:我们仍然使用上述的学生成绩表格,在 Oracle 中,可以使用 ROWNUM 关键字来获取 TOP 记录。
以下是实现查询成绩排名前五名的 SQL 语句:```sqlSELECT *FROM (SELECT * FROM student_scores ORDER BY score DESC)WHERE ROWNUM <= 5;```3. Microsoft SQL Server 示例:我们继续使用上述学生成绩表格,下面是在 Microsoft SQL Server 中查询成绩排名前五名的 SQL 语句:```sqlSELECT TOP 5 * FROM student_scores ORDER BY score DESC;```四、注意事项在使用 TOP 关键字时,需要注意以下几点:1. 排序方式:TOP 关键字结合 ORDER BY 子句使用时,可以根据指定的列进行排序。
db2look语法

db2look语法摘要:1.DB2look简介2.DB2look的基本语法3.DB2look命令的分类与使用4.DB2look实用案例分享5.小结与建议正文:DB2look是一款用于IBM DB2数据库管理和查询的实用工具,它可以帮助数据库管理员(DBA)和开发人员更加方便地操作和维护数据库。
本文将介绍DB2look的基本语法、命令分类与使用,并通过实用案例分享,帮助大家更好地掌握DB2look的使用技巧。
一、DB2look简介DB2look是一款免费、开源的DB2管理工具,支持Windows、Linux和Mac OS等操作系统。
它提供了丰富的功能,包括数据库对象浏览、查询、数据Export/Import、SQL脚本编辑与执行等。
DB2look以其简洁的界面、强大的功能和易用性,受到了广大数据库从业者的喜爱。
二、DB2look的基本语法DB2look的使用遵循SQL语法,同时它还支持一些特定的关键字和命令。
在使用DB2look时,需要熟悉以下基本语法:1.数据库连接:使用`CONNECT TO`命令连接到数据库,需要提供数据库服务器地址、端口、用户名和密码等信息。
2.数据库对象浏览:使用`SELECT`命令查看数据库中的表、视图、索引等对象。
3.查询与数据操作:使用SQL查询语句对数据库进行查询、插入、更新和删除等操作。
4.数据导出与导入:使用`EXPORT TO`和`IMPORT FROM`命令将数据导出到文件或从文件导入到数据库。
5.SQL脚本编辑与执行:使用`EDIT`和`RUN`命令编辑和执行SQL脚本。
三、DB2look命令的分类与使用1.连接与认证相关命令:包括`CONNECT TO`、`DISCONNECT FROM`、`SET PASSWORD`等命令。
2.数据库对象管理:包括`SELECT`、`USE`、`DROP`、`CREATE`等命令,用于管理表、视图、索引等数据库对象。
DB2 性能调优入门(1-Tools)

DB2 snapshot switches on
当前挂起的锁定 =0 锁定等待 =0 数据库等待锁定时间(毫秒) = 0 在使用的锁定列表内存(以字节计)= 3360 检测到死锁 =0 锁定升级 =0 互斥锁定升级 =0 当前正等待锁定的代理程序数 = 0 锁定超时 =0 不确定事务数 =0
已分配的专用排序堆总数 =0 已分配的共享排序堆总数 =4 共享排序堆高水位标记 =4 后阈值排序(共享内存) =0 总计排序 =0 总计排序时间(毫秒) =0 排序溢出 =0 活动排序数 =0
RESET MONITOR {ALL [DCS] | FOR [DCS] DATABASE databasealias} [AT DBPARTITIONNUM db-partition-number | GLOBAL]
© 2007 IBM Corporation
DB2 9.5 Administration for the Oracle DBA – Proof of Technology – Part 1
© 2007 IBM Corporation
DB2 9.5 Administration for the Oracle DBA – Proof of Technology – Part 1
DB2 Information Management
学习目标 了解DB2日常监控的过程 熟悉DB2常用的监控工具 能够熟练使用snapshot工具 能够熟练使用event monitor工具 能够熟练使用db2pd工具 能够使用SQL访问监控结果 能够熟练使用recovery expert工具
UPDATE MONITOR SWITCHES USING {switch-name {ON | OFF} ...} [AT DBPARTITIONNUM db-partition-number | GLOBAL]
db2top工具详解(翻译)
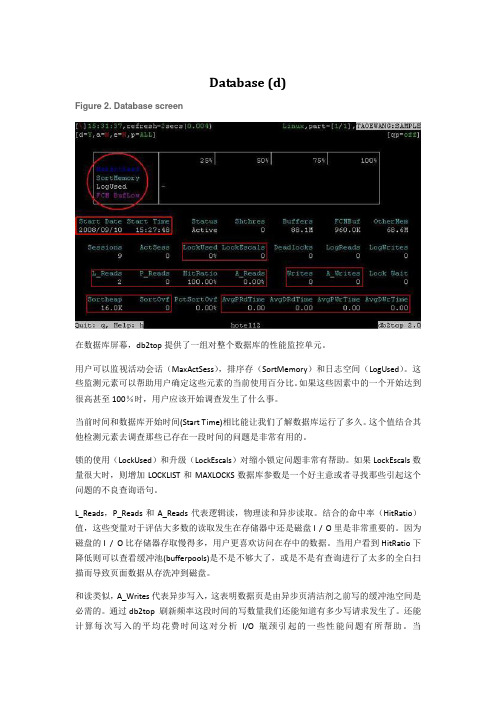
Database (d)Figure 2. Database screen在数据库屏幕,db2top提供了一组对整个数据库的性能监控单元。
用户可以监视活动会话(MaxActSess),排序存(SortMemory)和日志空间(LogUsed)。
这些监测元素可以帮助用户确定这些元素的当前使用百分比。
如果这些因素中的一个开始达到很高甚至100%时,用户应该开始调查发生了什么事。
当前时间和数据库开始时间(Start Time)相比能让我们了解数据库运行了多久。
这个值结合其他检测元素去调查那些已存在一段时间的问题是非常有用的。
锁的使用(LockUsed)和升级(LockEscals)对缩小锁定问题非常有帮助。
如果LockEscals数量很大时,则增加LOCKLIST和MAXLOCKS数据库参数是一个好主意或者寻找那些引起这个问题的不良查询语句。
L_Reads,P_Reads和A_Reads代表逻辑读,物理读和异步读取。
结合的命中率(HitRatio)值,这些变量对于评估大多数的读取发生在存储器中还是磁盘I / O里是非常重要的。
因为磁盘的I / O比存储器存取慢得多,用户更喜欢访问在存中的数据。
当用户看到HitRatio下降低则可以查看缓冲池(bufferpools)是不是不够大了,或是不是有查询进行了太多的全白扫描而导致页面数据从存洗冲到磁盘。
和读类似,A_Writes代表异步写入,这表明数据页是由异步页清洁剂之前写的缓冲池空间是必需的。
通过db2top 刷新频率这段时间的写数量我们还能知道有多少写请求发生了。
还能计算每次写入的平均花费时间这对分析I/O瓶颈引起的一些性能问题有所帮助。
当A_Writes/Writes的比值越高则写I/O性能越高。
SortOvf代表排序溢出。
如果用户发现这个数字变为非常高,就需要寻找查询了。
排序溢出发生在SORTHEAP不足够大,导致排序(Sort)或HashJoin操作可能会溢出数据到临时空间。
db2top

DB2TOP(1) User Manuals DB2TOP(1)NAMEdb2top − DB2 performance monitorSYNOPSISdb2top [−d dbname] [−n nodename] [−u username] [−p passÂ-word] [−V schema] [−i interval] [−P<partition> ] [−boption] [−a] [−B] [−k] [−R] [−x] [−f file</HH:MM:SS><+offset> ] [−D delimiter] [−C<option>] [−m duration] [−ooutfile]db2top [−H host ] [−N port ] [−h]DESCRIPTIONdb2top is a monitor for DB2 UDB specifically designed for DPF environments. It provides a unified, ’single system view’ of a multi−partition DB2 database that can be used to quickly identify either partition−specific or global problems in the system.The user interface is character−based and built using the curses library and is similar in nature to many UNIX moniÂ- toring utilities.db2top uses the DB2 snapshot monitoring APIs to retrieve data. It uses both global as well as partition−specific monitoring information to provide aggregation as well as quick drill−down capabilities.It can be run interactively or in batch mode. Main feaÂ- tures can be selected by an interactive command or by specifying the option in the personal or system−wide conÂ- figuration file. See below .db2toprc for more information.COMMAND OPTIONS−n specifies the node to attach to.−d specifies the database to monitor.−u specifies the DB2 username used to access the database.−p specifies the DB2 password.−V specifies the default schema used in explains.−i specifies the delay between screen updates.−k specifies whether to display actual or delta values.−R Reset snapshot at startup.−P <number>. Snapshot issued on current or partition numÂ-ber.−x specifies whether to display additionnal counters on session snd appl creens (might run slower on session).−b tells db2top to run in background mode.−a specifies only active queries will be displayed.−B enable bold for active objects.−C Runs db2top in snapshot collector mode, raw snapshot data is saved in <db2snap−Machine>.bin> by default (unless −f is specified).−f <file> </HH:MM:SS> <+offset>. Run db2top in replay mode when snapshot data has been previously collected in <file>. offset will jump to a certain point in time in the file. It can be expressed in seconds (+10s), minutes (+10m) or hours (+10h). /HH:MM:SS will skip entries until the specified point in time.−m Will limit duration of db2top in minutes for −b and −C.−o <outfile>. Outfile for −b option.−D <delimiter>. Separator for −b option.−h short help. When using the −b option, db2top will display information in CSV format. db2top can be run in background mode in combination with reading snapshot data from collection file, in this case, use the −f <file> option. Valid sub− options for −b and −C are :d : databasel : sessionst : tablespacesb : bufferpoolsT : TablesD : Dynamic SQLs : StatementsU : Locksu : UtilitiesF : Federationm : Memory poolsWhen using the −X switch with the −b option, the output will be displayed in XML format. When using the −L switch with the −b option, in session mode (sub−option l), all queries will be written to ’ALL.sql’. When using the −A switch with the −b option, db2top will produce a top twenty performance report. When using the −s <sample> switch with the −b option, db2top will only display n samÂ-ples and exit.Interactive commandsd Goto database screen.l Goto sessions screen.a Goto application details for agent (or restrict on agent on statement screen). db2top will prompt for the agent−id.G Toggle between all partitions and current partitions.P Select db partition on which to issue snapshot.t Goto tablespaces screen.T Goto tables screen.b Goto bufferpools screen.D Goto the dynamic SQL screen.m Display memory pools.s Goto the statements screen.U Goto the locks screen.p Goto the partitions screen.u Goto the utilities screen.A Goto the HADR screen.F Goto the federation screen.B Goto the bottleneck analysis screen.H Goto the history screen (experimental).f Freeze screen.W Watch mode for agent_id, os_user, db_user, applicaÂ-^HÂ-tion or netname. Statements returned by the sessionsnapshot (option l) will be written to agent.sql, os_user−agent.sql, db_user−agent.sql, application−agent.sql or netname−agent.sql. The Dump DB Structfield will create scripts in the current directory torecreate the database. When issued from the dynamicSQL screen (option D), statements will be written to db2adv.sql in a format compatible with db2advis./ Enter expression to filter data. \Expression mustconform to regular expression. Each function (screen)can be filtered differently. regexp check is applyiedto the whole row.<|> Move to left or right of screen.z|Z Sort on ascending or descending order.c This option allows to change the order of the columnsdisplayed on the screen. The syntax is in the form:1,2,3,... where 1,2,3 correspond respectively to the1st, 2nd and 3rd columns displayed. These are thecolumn numbers to use when specifying a sort criteÂ-ria.S Run native DB2 snapshot.L Allows to display the complete query text from the SQL screen. Regular DB2 explain can then be run usinge or X.R Reset snapshot data.i Toggle idle sessions on/off.I Reset refresh interval.k Toggle actual vs delta values.g Toggle graph on/off.X Toggle extended mode on/off.C Toggle snapshot data collector on/off.V Set default explains schema.O Display session setup.w Write session settings to .db2toprc.q Quit db2top.Interactive commands(applications screen only)r Return to previous function.R Toggle automatic refresh.g Toggle graph on/off.X Toggle extended mode on/off.d Display agents.Snapshot data collectordb2top can be run in replay mode, which means it can be run against a saved copy of the raw binary snapshot data. In order to do so, db2top must be run first in data colÂ- lector mode, either in batch mode by running db2top from the command line with the [−C] switch, or by activatÂ- ing/deactivating data collection from an interactive sesÂ- sion by pressing C. This will create a file <db2snap−Machine> in the current directory. Afterwards, db2top can be ran against <db2snap−Machine> by using the [−f <db2snap−Machine> arguments. db2top does not need to attach to DB2 in replay mode, which makes convenient to do remote monitoring. It is possible to limit the content of the stream file (and it’s size) by specifying any of the suboptions dltbTDsUF.Network data collector(EXPERIMENTAL)db2top can be run in client/server mode. This means that one instance of db2top can issue DB2 snapshots in data collection mode and send the output stream via the network to other instances of db2top. To enable this, db2top needs to be started in collection mode with −C and −N (network). Eventually, the −D will set db2top to daemon mode; in this case, messages are sent to syslog(3). Then, other instances of db2top will connect to the server using the −H [host] and −N <port> switchs.Network commands−−stop, −−restart,−−ping.FILESdb2toprc.db2toprc is a configuration file used to setup parameters at initialization time. db2top will search for the location of .db2toprc using the environement variable $DB2TOPRC. If the variable is not set, db2top will then search for .db2toprc in the current directory and finally in the home directory.ENVIRONMENTDB2TOPRCsee above.DB2DBDFTIf non null and nothing has been specified on the command line or in .db2toprc, db2top will honor the DB2DBDFT registry variable content as the default database.EDITORif EDITOR is set, results of explain or native snapshots will be displayed using this command, otherwise, it will default to vi(1).db2toprc structureSectionsThe various sections of $DB2TOPRC are described here after.cpu=commandThis entry allows the user to specify a comÂ- mand which result will be displayed on the 2nd line at the right of the screen, for example:cpu=vmstat 2 2 | tail −1 | awk’{printf("%d(usr+sys)",$14+$15);}’will display ’Cpu=2(usr+sys)’ on the right ofthe screen.io=commandThis entry allows the user to specify a comÂ-mand which result will be displayed on the 2ndline at the left of the screen, for example:io=vmstat 2 2 | tail −1 | awk’{printf("%d(bi+bo)",$10+$11);}’will display ’Disk=76(bi+bo)’ on the right ofthe screen.Both commands are run in a background process andthe fields on the screen are updated asynÂ-chronously.shell alias=commandThe shell entry allows to specify a userdefined command, for example:shell M=topwill spawn top from a db2top session whenentering M. It will return to the currentscreen upon exit.function alias=commandThe function entry allows to specify a userdefined command, for example:function N=netstatwill create a new function called N that willdisplay repeteadly the output of netstat.Sample.db2toprc file## db2top configuration file# On unix, should be located in $HOME/.db2toprc# File generated by db2top−1.0h#node= # [−n] nodenamedatabase=sample # [−d] databasenameuser= # [−u] database userpassword= # [−p] user password (crypted )schema= # [−V] default schema for exp lainsinterval=2 # [−i] sampling intervalactive=OFF # [−a] display active session s only (on/off)reset=OFF # [−R] Reset snapshot at star tup (on/off)delta=ON # [−k] Toggle display of delt a/cumulative values (on/off)graphic=ON # True if terminal suppo rts semi graphical characterscolors=ON # True if terminal suppo rts colorsgraph=ON # display graph on sessi ons list (on/off)port= # Port for network colle ctionstreamsize=size # Max collection size pe r hour (eg. 1024 or 1K : K, M or G)# Command to get cpu usage information from OScpu=vmstat 2 2 | tail −1 | awk ’{printf("%d(usr+sys)0,$14+$15 );}’# Command to get IO usage information from OSio=vmstat 2 2 | tail −1 | awk ’{printf("%d(bi+bo)0,$10+$11);}’# Ordering of information in sessions screensessions=0,1,18,2,3,4,5,6,7,8,9,10,11,12,13,14,15,16,17,19,20 ,21,22,23tables=0,1,2,4,3,5,6,7tablespaces=0,1,18,2,3,4,5,6,7,8bufferpools=0,1,18,2,3,4,5,6,7,8,9,10dynsql=0,1,18,2,3,4,5,6,7,8,9statements=0,1locks=0,1utilities=0federation=0,2,4# User defined commandsshell P=topfunction N=date && netstat −t tcpThe columns order screenAfter pressing c, a screen will be shown specifying theorder of the columns displayed on screen. The left partof the sceen displays the default order and column numberswhereas the right part displays the current ordering. Tochange the order of the columns, enter in the text fieldat the bottom of the screen the new column order : enterthe relative column positions as displayed on the leftseperated by comma. Not all columns need to be specified.This column ordering can be saved in $DB2TOPRC for subseÂ-quent db2top sessions by pressing w. It is possibile todefine the default sort order for this function by usingthe sort=num<a|d> syntax, where num is the column numberand <a|d> means ascending or descending.Example : tablespaces=0,1,18,2,3,4,5,6,7,8,sort=22aValid keywords for column ordering in db2toprc.sessions=tablespaces=tables=bufferpools=dynsql=statements=locks=utilities=federation=BUGSOccasionally strange information may appear when the snapÂ-shot API returns unexpected very large values. db2top willtry to display * instead of these values.COPYRIGHT Licensed Materials − Property of IBM Copyright IBM Corp. 2005 All Rights Reserved. US Government Users Restricted Rights Use, duplication or disclosure restricted by GSA ADP Schedule Contract wi th IBM Corp.IBM/DB2 JANUARY 2005 DB2TOP(1)Nov 10, 06 22:48Page 7/7db2top Printed by db2inst2。
db2常用命令(详解)大全

db2常⽤命令(详解)⼤全近⼀年来在项⽬开发中使⽤到了IBM的DB2 9.1的数据库产品,跟Oracle相⽐⼀些命令有很⼤的区别,⽽它最⼤的功能是⽀持xml存储、检索机制,通过XPath进⾏解析操作,使开发⼈员免于对xml⽂件在应⽤进⾏解析处理,先对其常⽤命令进⾏⼀下汇总,以免遗忘。
注意:在执⾏如下命令时,需要⾸先安装db2客户端并通过在运⾏中输⼊db2cmd进⾏初始化⼀、基础篇1、db2 connect to <数据库名> --连接到本地数据库名db2 connect to <数据库名> user <⽤户名> using <密码> --连接到远端数据库2、 db2 force application all --强迫所有应⽤断开数据库连接3、db2 backup db db2name<数据库名称> --备份整个数据库数据db2 restore db <db2name> --还原数据库4、db2 list application --查看所有连接(需要连接到具体数据库才能查看)5、db2start --启动数据库db2stop --停⽌数据库6、create database <数据库名> using codeset utf-8 territory CN--创建数据库使⽤utf-8编码7、db2 catalog 命令db2 catalog tcpip node <接点名称> remote <远程数据库地址> server <端⼝号>--把远程数据库映射到本地接点⼀般为50000db2 catalog db <远程数据库名称> as <接点名称> at node PUB11--远程数据库名称到本地接点db2 CONNECT TO <接点名称> user <⽤户名> using <密码>--连接本地接点访问远程数据库8、数据库导出db2look -d <数据库名> -u <⽤户> -e -o <脚本名称>.sql--导出数据库的表结构,其中⽤户空间⼀般为db2admin/db2inst1db2look -d <数据库名> -u <⽤户> -t <表1> <表2> -e -o <脚本名称>.sql--导出数据库中表1和表2的表结构db2move <数据库名> export --导出数据库数据db2move <数据库名> export -tn <表1>,<表2> --导出数据库中表和表数据 db2move dbname export;db2move dbname import db2move bipdbrun export -sn app -u app -p app9、数据库导⼊db2 -tvf <脚本名称>.sql --把上述导出的表结构导⼊到数据库表结构db2move <数据库名> load -lo replace --把上述“db2move <数据库名> export“导出的数据导⼊到数据库中并把相同的数据替换掉在实际使⽤过程中,如果⽤到db2⾃增主键,需要使⽤by default,⽽不是always,功能是⼀样的,但这样在数据移植时候会很⽅便!10、db2 connect reset 或 db2 terminate --断开与数据库的连接11、db2set db2codepage=1208 --修改页编码为120812、db2 describe table <表名> --查看表结构13、db2 list tables --查看数据库中所有表结构list tables for system --列出所有系统表14、db2 list tablespaces --列出表空间⼆、⾼级篇15、fetch first 10 rows only --列出表中前10条数据例如:select * from <表名> fetch first 10 rows only16、coalesce(字段名,转换后的值) --对是null的字段进⾏值转换例如:select coalesce(id,1) from <表名> --对表中id如果为null转换成117、dayofweek(⽇期) --计算出⽇期中是周⼏(1是周⽇,2是周⼀.......7是周六)dayofweek_iso --计算出⽇期中是周⼏(1是周⼀.......7是周⽇)例如:dayofweek(date(2008-01-16)) --它会返回是4,代表星期三dayofweek_iso(date(2008-01-16)) --它会返回是3,代表星期三18、dayofyear(⽇期) --⼀年中的第⼏天,范围在1-366范围之内注意:参数中⽇期的格式是YYYY-MM-DD的形式,如果不是需要进⾏转换,否则函数不能使⽤例如:⽇期是20080116必须要进⾏转换dayofweek(concat(concat(concat(substr(openDate,1,4),'-'),concat(substr(openDate,5,2),'-')),substr(openDate,7,2)))as week)这样格式正确的。
(转)Db2数据库性能优化中,十个共性问题及难点的处理经验
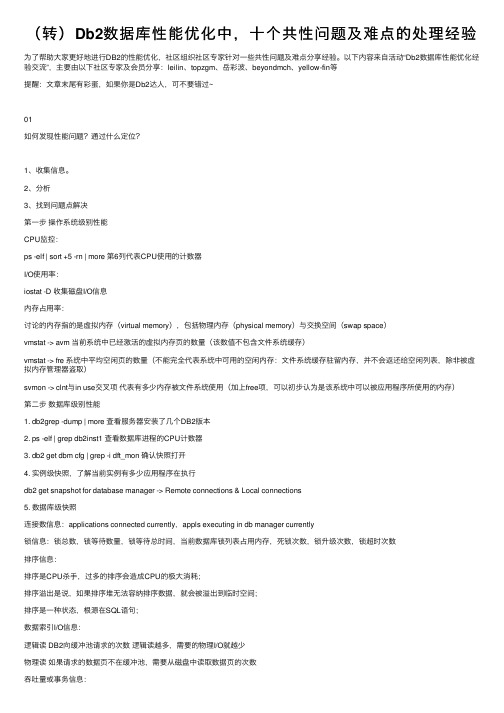
(转)Db2数据库性能优化中,⼗个共性问题及难点的处理经验为了帮助⼤家更好地进⾏DB2的性能优化,社区组织社区专家针对⼀些共性问题及难点分享经验。
以下内容来⾃活动“Db2数据库性能优化经验交流”,主要由以下社区专家及会员分享:leilin、topzgm、岳彩波、beyondmch、yellow-fin等提醒:⽂章末尾有彩蛋,如果你是Db2达⼈,可不要错过~01如何发现性能问题?通过什么定位?1、收集信息。
2、分析3、找到问题点解决第⼀步操作系统级别性能CPU监控:ps -elf | sort +5 -rn | more 第6列代表CPU使⽤的计数器I/O使⽤率:iostat -D 收集磁盘I/O信息内存占⽤率:讨论的内存指的是虚拟内存(virtual memory),包括物理内存(physical memory)与交换空间(swap space)vmstat -> avm 当前系统中已经激活的虚拟内存页的数量(该数值不包含⽂件系统缓存)vmstat -> fre 系统中平均空闲页的数量(不能完全代表系统中可⽤的空闲内存:⽂件系统缓存驻留内存,并不会返还给空闲列表,除⾮被虚拟内存管理器盗取)svmon -> clnt与in use交叉项代表有多少内存被⽂件系统使⽤(加上free项,可以初步认为是该系统中可以被应⽤程序所使⽤的内存)第⼆步数据库级别性能1. db2grep -dump | more 查看服务器安装了⼏个DB2版本2. ps -elf | grep db2inst1 查看数据库进程的CPU计数器3. db2 get dbm cfg | grep -i dft_mon 确认快照打开4. 实例级快照,了解当前实例有多少应⽤程序在执⾏db2 get snapshot for database manager -> Remote connections & Local connections5. 数据库级快照连接数信息:applications connected currently,appls executing in db manager currently锁信息:锁总数,锁等待数量,锁等待总时间,当前数据库锁列表占⽤内存,死锁次数,锁升级次数,锁超时次数排序信息:排序是CPU杀⼿,过多的排序会造成CPU的极⼤消耗;排序溢出是说,如果排序堆⽆法容纳排序数据,就会被溢出到临时空间;排序是⼀种状态,根源在SQL语句;数据索引I/O信息:逻辑读 DB2向缓冲池请求的次数逻辑读越多,需要的物理I/O就越少物理读如果请求的数据页不在缓冲池,需要从磁盘中读取数据页的次数吞吐量或事务信息:提交/回滚事务数,执⾏动态和静态语句次数,增删改查次数( rows read / rows selected ) 是⼀个⾮常重要的性能指标,它表⽰为了检索⼀⾏数据需要读取多少⾏,该值越⼤,表⽰代价越⾼,需要的I/O 越多,可调优的余地越⼤事务⽇志信息:⽇志I/O在很⼤程度上会影响数据库整体的性能6. 应⽤程序快照在数据库快照中发现存在⼤量的逻辑读,通过应⽤程序快照可以细化到某条特定的语句7. 表空间快照在数据库快照中发现存在⼤量的逻辑读,通过表空间快照可以轻松地定位哪个表空间被频繁使⽤8. 表快照如果发现⼀个表的页数很少,但是读的⾏数⾮常多,那么可以合理地猜测该表在某些查询语句中可能处于NLJOIN的内部⼦节点9. 动态SQL快照:SQL执⾏次数,总共读的⾏数,消耗的CPU,逻辑物理读数量,排序数量等第三步内存使⽤监控1. db2pd -osinfo系统内存使⽤情况2. db2pd -dbptnmem整个实例的内存使⽤情况3. db2pd -memsets内存段使⽤情况在实例中会有多个不同的内存段,每⼀个内存段中可能有⼀个或者多个内存池ipcs -a | grep 578814120 内存段映射到操作系统共享内存IPC段FMP与trace内存段很少造成性能问题4. db2pd -mempool深⼊内存池信息5. db2pd -db <dbname> -memsets / -mempool数据库级别内存段和内存池信息02优化过程中的优先级问题?在Db2优化过程中,我已知的有如下⼿段1.索引2.sql语句优化(分析执⾏语句后重写sql)3.runstats信息收集请问优化过程中,⼊⼿的优先级顺序是什么呢,还有其他⼿段吗?这“三板斧”已经可以解决很多问题了,DB2的优化⼿段很多,如果想深⼊了解,上传⼏个⽂件供参考。
- 1、下载文档前请自行甄别文档内容的完整性,平台不提供额外的编辑、内容补充、找答案等附加服务。
- 2、"仅部分预览"的文档,不可在线预览部分如存在完整性等问题,可反馈申请退款(可完整预览的文档不适用该条件!)。
- 3、如文档侵犯您的权益,请联系客服反馈,我们会尽快为您处理(人工客服工作时间:9:00-18:30)。
Database (d)Figure 2. Database screen在数据库屏幕,db2top提供了一组对整个数据库的性能监控单元。
用户可以监视活动会话(MaxActSess),排序内存(SortMemory)和日志空间(LogUsed)。
这些监测元素可以帮助用户确定这些元素的当前使用百分比。
如果这些因素中的一个开始达到很高甚至100%时,用户应该开始调查发生了什么事。
当前时间和数据库开始时间(Start Time)相比能让我们了解数据库运行了多久。
这个值结合其他检测元素去调查那些已存在一段时间的问题是非常有用的。
锁的使用(LockUsed)和升级(LockEscals)对缩小锁定问题非常有帮助。
如果LockEscals 数量很大时,则增加LOCKLIST和MAXLOCKS数据库参数是一个好主意或者寻找那些引起这个问题的不良查询语句。
L_Reads,P_Reads和A_Reads代表逻辑读,物理读和异步读取。
结合的命中率(HitRatio)值,这些变量对于评估大多数的读取发生在存储器中还是磁盘I / O里是非常重要的。
因为磁盘的I / O比存储器存取慢得多,用户更喜欢访问在内存中的数据。
当用户看到HitRatio 下降低则可以查看缓冲池(bufferpools)是不是不够大了,或是不是有查询进行了太多的全白扫描而导致页面数据从内存洗冲到磁盘。
和读类似,A_Writes代表异步写入,这表明数据页是由异步页清洁剂之前写的缓冲池空间是必需的。
通过db2top 刷新频率这段时间内的写数量我们还能知道有多少写请求发生了。
还能计算每次写入的平均花费时间这对分析I/O瓶颈引起的一些性能问题有所帮助。
当A_Writes/Writes的比值越高则写I/O性能越高。
SortOvf代表排序溢出。
如果用户发现这个数字变为非常高,就需要寻找查询了。
排序溢出发生在SORTHEAP不足够大,导致排序(Sort)或HashJoin操作可能会溢出数据到临时空间。
有时该值随着SORTHEAP增加而降低,但在其他情况下,可能没有多大帮助,如果进行排序的数据集比可分配给SORTHEAP内存大得多。
如果请求的数据量超过缓冲池可容纳的临时空间大小那么就可能需要物理I/O来进行SORT或哈希链接在这种情况下排序溢出将是很大的瓶颈。
因此优化查询来减少排序溢出的数量能显著提高系统的性能。
在数据库屏幕的最后四个条目显示的平均物理读取时间(AvgPRdTime),平均直接读取时间(AvgDRdTime),物理平均写入时间(AvgPWrTime)和平均直接写入时间(AvgDWrTime)。
这四个项目直接反映I/ O子系统性能。
如果用户发现一个意想不到的大量的时间花费在每个读或写操作,进一步的调查应到I/ O子系统。
正常情况下,DB2 排序发生在内存中,这块内存叫做排序堆,即 SORTHEAP。
当需要排序的数据超出 SORTHEAP 大小限制时,就会发生排序溢出。
溢出的数据会写到临时表中,这会产生更多的I/O,因此对性能会有较大影响。
Tablespace (t)Figure 3. Tablespace screen表空间屏幕提供每个表空间的详细信息。
Hit Ratio%和Async Reads%列对用户来说是非常重要的。
在数据库级别仅仅监视缓冲池命中率,你可能无法获得足够精确的信息。
在包含多个表空间的环境中,在一个表空间中发生了不良查询现象会被所有表空间平均命中率遮蔽。
在每个表空间级别上监测Hit Ratio%和Async Reads%对于分析系统工作细节很有帮助。
Delta逻辑读取(写)和Delta物理读取(写)(Delta 逻辑读(写入)和Delta 物理读(写入))说明这些表空间如何“忙”的。
一些不太活跃的表空间可能不具有非常高的缓冲命中率。
在大多数情况下最好使用活动性更大的表空间。
想要左右滚动屏幕可以使用键盘上的左,右箭头键。
所有的列信息不能在一个屏幕上显示可以通过按下左或右箭头键来查看。
Space Used,Total Size和% full能够很方便的查看各表空间的使用率情况,还能从其他列信息中查看表空间类型是DMS还是SMS。
Dynamic SQL (D)Figure 4. Dynamic SQL screen动态SQL屏幕提供缓存的SQL语句的详细信息。
用户可以再此屏幕对特定SQL语句产生执行计划(DB2EXPLN)和(db2exfmt)。
执行数量(Num Execution)和平均执行时间(Avg ExecTime)可以用来了解查询语句执行了多少次和平均运行时间。
通过平均CPU时间(Avg CpuTime)与平均执行时间(Avg ExecTime)比较能看出执行时间花费在CPU上还是花在了等待锁或I/O上。
行读取(Row read)和行写入(Row written)能够明白查询的行为。
例如,如果用户看到一个SELECT查询语句关联了大量的写,这可能表明该查询可能会有排序(哈希联接)溢出而且需要进一步调整来以避免数据溢出临时空间。
数据,索引的Hit ratio(命中率%)和临时l_reads来帮助用户轻松解决缓冲池大小是否需要调整。
(AvgSort PerExec)和排序时间能计算出在一次执行期间进行了多少排序。
db2top实用程序还提供了产生DB2EXPLN或db2exfmt报告功能而无需手动运行该命令。
通过动态SQL屏幕上输入一个大写L,它会提示你输入一个SQL字符串哈希。
SQL散列字符串位于表中的第一列,例如“00000005429283.”用户可以复制该字符串并将其粘贴到光标提示处,按下Enter键,如图5:Figure 5. Dynamic SQL screen -- Query text然后,选择e选项生成DB2EXPLN输出,或者选择x选项生成db2exfmt输出如果已经导入到数据库中。
Session (l)Figure 6. Session screen会话屏幕提供每个应用程序会话的详细信息。
第一列显示了应用句柄,下面三列:CPU%总计,IO%总计,MEM%总计表示本应用消耗资源的百分比。
在大多数情况下,每个会话表示一个连接。
在这些列之后还显示了应用状态,以及一些统计数据读写的列。
用户还可以看到LocksHeld,Sort(sec),LogUsed信息在此屏幕上。
当事务日志耗尽空间时LogUsed信息就很有帮助了。
通过使用这种显示器的个监控元素,用户可以得到一些想法那些应用程序消耗大部分日志空间。
虽然会话屏幕上的信息和数据库屏幕上的信息差不多,但是会话屏幕上的信息为每个应用程序的。
做性能分析要结合不同的屏幕。
例如,当一些读问题显示在数据库屏幕上时可以进一步通过查看会话屏和动态SQL画面上以缩小它的特定应用程序或SQL。
在session屏幕按i查找哪些正在等待Lock的应用Bufferpool (b)Figure 7. Bufferpool screen在此屏幕上,db2top提供了每个缓冲池的信息。
用户可以看到的一些缓冲池的基本信息,如读,写,和大小,还可以看到其他信息,如缓冲池命中率%和异步读取%率。
Lock (U)Figure 8. Lock screen一个锁定的问题是应用程序诊断中最常见的问题之一。
通过db2top,用户可以很容易地列出了应用程序持有的锁。
使用db2top也更容易分析锁等待的问题。
下面图9,10和11显示其中一个db2bp应用程序正在等待另一db2bp会话。
Figure 9. Lock waiting -- Application status在图9中,两代理(代理24和代理9)处于第一列:Agent Id(state)。
你可以看到,在第三列(应用状态)其中一个代理(代理24)被卡在锁等待状态。
Figure 10. Lock waiting -- Lock status如果用户希望看到更多信息,请按键盘上的左箭头,如图10。
Figure 11. Lock waiting -- Table name在这个特殊的例子中,如图11看到的那样,代理24试图去请求表上的S锁,但是它被拥有T1表IX锁的代理9锁定。
db2to在此屏幕提供了另一个非常有用的功能:锁链分析。
并不总是容易弄清楚锁等待的关系,如果有多个应用程序涉及。
db2top实用程序提供了一个有用的特性来动态绘制锁链,使其更容易为用户了解应用程序之间的锁定关系。
通过输入大写L,显示锁链。
就像图12显示的这样:Figure 12. Lock waiting -- Lock chainTable (T)Figure 13. Table screen表屏幕显示数据库中的表的信息。
一段时间中没有访问的表显示为白色。
正在存取(活跃)表显示绿色。
有关于表本身的信息。
列中的数据页(Data pages)和索引页(Index pages)代表多少页在表中。
表类型和表大小也是表的很重要的属性。
另一个重要的列是行溢出/秒(Rows Overflows/s),这表明每秒行溢出的数量。
溢出的行表明发生数据碎片。
如果这个数字很高,用户应该使用REORG实用程序,清理这种碎片重组表提高表的性能。
Bottlenecks (B)Figure 14. Bottlenecks瓶颈分析对于一个DBA来说是不能忽视。
他们想知道哪个代理(应用)严重地限制了整个系统的性能。
标题“瓶颈”右下角的方框是关于各种数据库操作的时序分析:The elapsed time used to calculate the percentage of each operation = (wait_lock_time + sort_time + bp_read_time + bp_write_time + async_read_time + async_write_time + prefetch_waite_time + direct_read_time + direct_write_time).以下为每个操作所估计的百分比:wait lock ms: (wait lock time)/(elapsed time) = 80%sort ms : (sort time)/(elapsed time) = 0bp r/w ms: (buffer pool read and write time)/(elapsed time) = 10%async r/w ms: (async read and write)/(elapsed time) = 6%pref wait ms: (prefetch_waite_time)/(elapsed time) = 2%dir r/w ms: (direct read and write time)/(elapsed time) = 2%这个屏幕的主要显示部分为对于每一种系统资源哪个agent(应用)占用最大屏幕上显示的服务器资源显示db2top所监控的服务器资源:Cpu: Which agent consumes the most CPU time.SessionCpu: Which application session consumes the most CPU time.IO r/w: Which agent consumes the most I/O read and write.Memory: Which agent consumes the most memory.Lock: Which agent is holding the most locks.Sorts: Which agent has executed the biggest number of sorting.Sort Times: Which agent consumes the longest sorting time.Log Used: Which agent consumes the most log space in the most recent unit of work.Overflows: Which agent has the most number of sort overflows.RowsRead: Which agent has read the most number of rows of records.RowsWritten: Which agent has written the most number of rows of records.TQ r/w: Which agent has sent and received most number of rows on table queues.MaxQueryCost: Which agent has the max SQL execution time estimated by the compiler.XDAPages: Which agent has the most number of pages for XDA data (available in and after releases).例如:图14示出了代理683表明db2bp(DB2 back end process)是很明显的瓶颈。