SuperTestV7.2软件使用说明书资料
superbiclust软件说明书
Package‘superbiclust’October14,2022Type PackageTitle Generating Robust Biclusters from a Bicluster Set(Ensemble Biclustering)Version1.2Date2021-05-26Author Tatsiana KhamiakovaMaintainer Tatsiana Khamiakova<******************>Depends biclust,fabiaImports methods,Matrix,graphics,statsDescription Biclusters are submatrices in the data matrix which satisfy certain conditions of homogeneity.Package containsfunctions for generating robust biclusters with respect to theinitialization parameters for a given bicluster solutioncontained in a bicluster set in data,the procedure is alsoknown as ensemble biclustering.The set of biclusters isevaluated based on the similarity of its elements(theoverlap),and afterwards the hierarchical tree is constructedto obtain cut-off points for the classes of robust biclusters.The result is a number of robust(or super)biclusters withnone or low overlap.License GPL(>=2)LazyLoad yesNeedsCompilation noRepository CRANDate/Publication2021-05-2806:00:02UTCRepository/R-Forge/Project superbiclustRepository/R-Forge/Revision14Repository/R-Forge/DateTimeStamp2014-11-2715:39:2912superbiclust-package R topics documented:superbiclust-package (2)BiclustSet-class (3)BiclustSet-methods (4)combine (4)getStats (5)HCLtree (6)jaccardMat (7)kulczynskiMat (8)ochiaiMat (9)plotProfilesAcrossAllSamples (10)plotProfilesWithinBicluster (11)plotSuper (12)plotSuperAll (13)sensitivityMat (13)similarity (14)sorensenMat (15)specificityMat (16)Index18 superbiclust-package generating robust biclusters form the set of biclustersDescriptionThe package contains a number of functions for computing similarity matrix of the biclusters ob-tained by a variety of methods,initialization seeds or various parameter settings.It uses biclustering output as generated by biclust or fabia.isa2package can be used to generate the biclusters as well, however,a prior conversion is needed to a biclust object by using isa2.biclust()function.The matrix is used for the construction of hierarchical tree based on overall similarity,row similarity or column similarity to obtain cut-off points for the similarity metric of choice.Various statistics are output per bicluster set:a number of a given gene(compound)or gene(compound)set has been present in any bicluster of output or per run.After the tree is cut,the robiust or super biclusters are obtained in a form of biclust object,which can further be used for plotting of biclusters.Biclusters are sub-matrices in the data which satisfy certain conditions of homogeneity.For more details on biclusters and biclustering see Madeira and Oliveira(2004).DetailsPackage:superbiclustType:PackageVersion:0.99Date:2012-08-23License:GPLLazyLoad:yesBiclustSet-class3Author(s)Tatsiana Khamiakova<*******************************>ReferencesMadeira and Oliveira(2004)Biclustering algorithms for biological data analysis:a survey.IEEE/ACM Trans Comput Biol Bioinform.2004Jan-Mar;1(1):24-45.Shi et al.(2010)A bi-ordering approach to linking gene expression with clinical annotations in gastric cancer.BMC Bioinformatics.11.pages477.BiclustSet-class Class BiclustSetDescriptionBiclustSet Class contains the biclustering result in a form:bicluster rows and bicluster columnsObjects from the ClassObjects can be created by calls of the form new("BiclustSet",...).The variety of inputs variety of inputs(isa2,fabia,biclust,...)can be used.SlotsGenesMembership:logical,object of class"matrix",with row membership within a biclusterColumnMembership:logical,object of class"matrix",with column membership within a bicluster Number:code"numeric",number of biclusters in the setAuthor(s)Tatsiana Khamiakova4combine BiclustSet-methods Constructor of BiclustSet objectDescriptionThe method extract relevant information from a variety of biclustering input and constructs a Bi-clustSet objectMethodssignature(x="ANY")signature(x="Biclust")Converts Biclust objects into BiclustSet objectsignature(x="Factorization")Converts FABIA Factorization object into BiClustSetsignature(x="list")Converts a list with biclustering results into BiClustSetSee AlsoBiclustSetExamplestest<-matrix(rnorm(5000),100,50)test[11:20,11:20]<-rnorm(100,3,0.1)test[17:26,21:30]<-rnorm(100,3,0.1)#Run FABIAset.seed(1)FabiaRes1<-fabia(test)#construct BiclustSet object from FABIA outputFabiabiclustSet<-BiclustSet(FabiaRes1)FabiabiclustSetcombine Combine two Biclust objects into oneDescriptionCombine two Biclust objects into oneUsagecombine(x,y)Argumentsx1st Biclust object containing bicluster resultsy2nd Biclust object containing bicluster resultsgetStats5DetailsIf a biclust function returns empty set,joined result contains only results of non-empty and Parameters slots of a"Biclust"object contain information about both biclustering runs. Valueobject of a class BiclustAuthor(s)Tatsiana KhamiakovaSee AlsoBiclustSetExamples#combine output of two biclust objectstest<-matrix(rnorm(5000),100,50)test[11:20,11:20]<-rnorm(100,3,0.1)test[17:26,21:30]<-rnorm(100,3,0.1)set.seed(1)PlaidRes1<-biclust(x=test,method=BCPlaid())set.seed(2)PlaidRes2<-biclust(x=test,method=BCPlaid())combinedRes<-combine(PlaidRes1,PlaidRes2)summary(combinedRes)getStats Get frequency statistic for the columns and rows membershipDescriptionFor a given Bicluster set,for each row and column in data,compute frequency of apperance withina biclusterUsagegetStats(x)Argumentsx Biclust object containing bicluster resultsValuea list of column and row frequencies6HCLtreeAuthor(s)Tatsiana KhamiakovaHCLtree Hierarchical structure of bicluster outputDescriptionConstructs and plots hierarchical tree of biclusters output based on the similarity matrixUsageHCLtree(x)Argumentsx Similarity object containing pairwise similarity indices for all biclusters in the outputDetailsThis function operates on a similarity matrix,which is converted to the distance between biclusters according to dist(a,b)=1−sim(a,b),where the smaller the distance,the higher is overlap in terms of rows and columns.The tree is constructed using complete method and plotted.Further,the structure must be explored and robust or super-biclusters obtained after cutting the tree.identify function can be applied to the hierarchical tree to see the partition and get the plots of biclusters. ValuetreeAuthor(s)Tatsiana KhamiakovaSee Alsosimilarity,plotSuperExamples#compute sensitivity for BiMAX biclusterstest<-matrix(rnorm(5000),100,50)test[11:20,11:20]<-rnorm(100,3,0.1)test[17:26,21:30]<-rnorm(100,3,0.1)testBin<-binarize(test,2)res<-biclust(x=testBin,method=BCBimax(),minr=4,minc=4,number=10)BiMaxBiclustSet<-BiclustSet(res)jaccardMat7 SensitivityMatr<-similarity(BiMaxBiclustSet,index="sensitivity")#construct hierarchical clustering based on the sensitivitiesHCLsensitivity<-HCLtree(SensitivityMatr)plot(HCLsensitivity,main="structure of bicluster solution")jaccardMat Jaccard similarity Matrix for bicluster outputDescriptioncomputes jaccard similarity matrix for biclusters in two bicluster setsUsagejaccardMat(x,y,type=c("rows","cols","both"))Argumentsx BiclustSet object containing row and column indicators of bicluster member-ship,number of biclustersy BiclustSet object containing row and column indicators of bicluster member-ship,number of biclusterstype whether to compute Jaccard index in two dimensions,row dimension or column dimensionDetailsThis function operates on BiclustSet objects and computes pairwise similarity based on the common elements between biclusters.The Jaccard similarity score ja for two biclusters A and B is computedasja=|A∩B| |A∪B|Valuematrix of pairwise Jaccard indicesAuthor(s)Tatsiana KhamiakovaSee Alsosimilarity,kulczynskiMat,ochiaiMat,sensitivityMat,specificityMat,sorensenMat8kulczynskiMat kulczynskiMat Kulczynski similarity Matrix for bicluster outputDescriptioncomputes Kulczynski similarity matrix for biclusters in two bicluster setsUsagekulczynskiMat(x,y,type=c("rows","cols","both"))Argumentsx BiclustSet object containing row and column indicators of bicluster member-ship,number of biclustersy BiclustSet object containing row and column indicators of bicluster member-ship,number of biclusterstype whether to compute Kulczynski index in two dimensions,row dimension or column dimensionDetailsThis function operates on BiclustSet objects and computes pairwise similarity based on the common elements between biclusters.Kulczynski similarity score ku for two biclusters A and B is computedasku=2|A∩B|1|A|+1|B|Valuematrix of pairwise Kulczynski indicesAuthor(s)Tatsiana KhamiakovaSee Alsosimilarity,jaccardMat,ochiaiMat,sensitivityMat,specificityMat,sorensenMatochiaiMat9 ochiaiMat Ochiai similarity Matrix for bicluster outputDescriptionComputes Ochiai similarity matrix for biclusters in two bicluster setsUsageochiaiMat(x,y,type=c("rows","cols","both"))Argumentsx BiclustSet object containing row and column indicators of bicluster member-ship,number of biclustersy BiclustSet object containing row and column indicators of bicluster member-ship,number of biclusterstype whether to compute Ochiai index in two dimensions,row dimension or column dimensionDetailsThis function operates on BiclustSet objects and computes pairwise similarity based on the common elements between biclusters.The Ochiai similarity score ja for two biclusters A and B is computed asoc=|A∩B||A||B|Valuematrix of pairwise Ochiai indicesAuthor(s)Tatsiana KhamiakovaSee Alsosimilarity,jaccardMat,ochiaiMat,sensitivityMat,specificityMat,sorensenMat10plotProfilesAcrossAllSamplesplotProfilesAcrossAllSamplesPlot Gene Expression Profiles Across All Samples of the Original DataDescriptionPlot Gene Expression Profiles Across All Samples of the Original DataUsageplotProfilesAcrossAllSamples(x,coreBiclusterGenes,coreBiclusterSamples)Argumentsx datacoreBiclusterGenesvector of genes belonging to biclustercoreBiclusterSamplesvector of samples belonging to biclusterDetailsThe plot re-sorts the samples by bicluster membership and highlights them in red.Only the genes of a bicluster are plotted.Valueno return value;a plot is drawn to the current deviceAuthor(s)Tatsiana KhamiakovaSee AlsoBiclustSet,plotSuperAllplotProfilesWithinBicluster11plotProfilesWithinBiclusterPlot Gene Expression Profiles within a(Core)BiclusterDescriptionPlot Gene Expression Profiles within a(Core)BiclusterUsageplotProfilesWithinBicluster(x,main="",sampleNames,geneNames=NULL)Argumentsx expression matrix(of class’matrix’)for the subset of genes and samples corre-sponding to the bicluster under studymain main title for the graphsampleNames names of the samples to be used for annotating the x axis(character vector of length equal to the number of columns of the expression matrix’x’(representingthe bicluster)geneNames names of the genes to be plotted in a legend(character vector of length equal to the number of rows of the expression matrix’x’);only suitable for biclusterscontaining a small number of genesValueno return value;a plot is drawn to the current deviceAuthor(s)Tatsiana KhamiakovaSee AlsoplotSuper12plotSuper plotSuper Plot gene profiles within biclustersDescriptionFunction for plotting gene profiles for compounds within constructed super-biclusterUsageplotSuper(x,data,BiclustSet)Argumentsx a vector,containing indices of biclusters,to be joined for obtaining the robust biclusterdata matrix,dataset,from which the bicluster results are obtainedBiclustSet a BiclustSet object containing bicluster outputDetailsThis function constructs a robust bicluster from a set of biclusters identified in a hierarchical tree and plots gene profiles for columns in a robust bicluster.Each line represents a gene from a bicluster.The bicluster is saved as Biclust object which can be further plotetd by available functions from biclust package.The information about the number of biclusters used to generate the resulting robust bicluster is saved in Call slot of the object.This information is important to see how often the bicluster has been discovered under different parameter settings(e.g.initialization seeds)Indices used as an input can be obtained by identify function or by cutting the tree.Valuebiclust object containing bicluster and the information about bicluster subset used to generate itAuthor(s)Tatsiana KhamiakovaSee AlsoHCLtree,plotSuperAll,plotProfilesWithinBiclusterplotSuperAll13 plotSuperAll Plot gene profiles for all samples in the dataDescriptionFunction for plotting bicluster gene profiles for all samples in the dataUsageplotSuperAll(x,data,BiclustSet)Argumentsx a vector,containing indices of biclusters,to be joined for obtaining the robust biclusterdata matrix,dataset,from which the bicluster results are obtainedBiclustSet a BiclustSet object containing bicluster outputDetailsThis function constructs a robust bicluster from a subset of biclusters specified in x argument and plots the expression profilesValuebiclust objectAuthor(s)Tatsiana KhamiakovaSee AlsoHCLtree,plotProfilesAcrossAllSamplessensitivityMat Sensitivity Matrix for bicluster outputDescriptionComputes sensitivity matrix for biclusters in two bicluster setsUsagesensitivityMat(x,y,type=c("rows","cols","both"))14similarityArgumentsx BiclustSet object containing row and column indicators of bicluster member-ship,number of biclustersy BiclustSet object containing row and column indicators of bicluster member-ship,number of biclusterstype whether to compute sensitivity in two dimensions,row dimension or column dimensionDetailsThis function operates on BiclustSet objects and computes pairwise similarity based on the common elements between biclusters.Sensitivity inclusion score sen of biclusters A and B is computed assen=|A∩B| |A|Valuematrix of pairwise sensitivitiesAuthor(s)Tatsiana KhamiakovaSee Alsosimilarity,jaccardMat,ochiaiMat,kulczynskiMat,specificityMat,sorensenMatsimilarity Similarity Matrix for bicluster outputDescriptioncomputes similarity matrix for the biclustering output based on one of the pairwise similarity indices of biclusters in a given bicluster setUsagesimilarity(x,index="jaccard",type="rows")Argumentsx BiclustSet object containing row and column indicators of bicluster member-ship,number of biclustersindex similarity index for the biclusters in outputtype whether to perform similarity in two dimensions,"both"(recommended for bi-clustering),row dimension,"rows"(default,requires less computations)or col-umn dimension"cols"sorensenMat15DetailsThis function operates on BiclustSet object and computes pairwise similarity based on the commonelements between biclusters.type variable controls whether similarity index is constructed for allelements,or in one dimension(rows or columns)only.In general,similarity indices for one dimen-sion(row or column)are higher than for two-dimensions.Several options for similarity indices areoffered:jaccard(default),kulczynski,sensitivity,specificity,sorensen and ochiai indices.Valuea"similarity"object containing similarity matrixAuthor(s)Tatsiana KhamiakovaSee AlsoHCLtree,plotSuper,jaccardMat,kulczynskiMat,ochiaiMat,sensitivityMat,specificityMat,sorensenMat Examples#compute sensitivity for BiMAX biclusterstest<-matrix(rnorm(5000),100,50)test[11:20,11:20]<-rnorm(100,3,0.1)test[17:26,21:30]<-rnorm(100,3,0.1)testBin<-binarize(test,2)res<-biclust(x=testBin,method=BCBimax(),minr=4,minc=4,number=10)BiMaxBiclustSet<-BiclustSet(res)SensitivityMatr<-similarity(BiMaxBiclustSet,index="sensitivity",type="rows")SensitivityMatrsorensenMat Sorensen similarity Matrix for bicluster outputDescriptionComputes Sorensen similarity matrix for biclusters in two bicluster setsUsagesorensenMat(x,y,type=c("rows","cols","both"))Argumentsx BiclustSet object containing row and column indicators of bicluster member-ship,number of biclustersy BiclustSet object containing row and column indicators of bicluster member-ship,number of biclusterstype whether to compute Sorensen index in two dimensions,row dimension or col-umn dimensionDetailsThis function operates on BiclustSet objects and computes pairwise similarity based on the common elements between biclusters.Sorensen similarity score so for two biclusters A and B is computedasso=2|A∩B| |A|+|B|Valuematrix of pairwise Sorensen indicesAuthor(s)Tatsiana KhamiakovaSee Alsosimilarity,jaccardMat,ochiaiMat,sensitivityMat,specificityMat,kulczynskiMat specificityMat Specificity Matrix for bicluster outputDescriptionComputes specificity matrix for biclusters in two bicluster setsUsagespecificityMat(x,y,type=c("rows","cols","both"))Argumentsx BiclustSet object containing row and column indicators of bicluster member-ship,number of biclustersy BiclustSet object containing row and column indicators of bicluster member-ship,number of biclusterstype whether to compute specificity in two dimensions,row dimension or column dimensionDetailsThis function operates on BiclustSet objects and computes pairwise similarity based on the common elements between biclusters.Sensitivity inclusion score spe of biclusters A and B is computed asspe=|A∩B| |B|Valuematrix of pairwise specificitiesAuthor(s)Tatsiana KhamiakovaSee Alsosimilarity,jaccardMat,ochiaiMat,kulczynskiMat,sensitivityMat,sorensenMatIndex∗biclusteringsuperbiclust-package,2∗similaritysuperbiclust-package,2 BiclustSet,4,5,10BiclustSet(BiclustSet-class),3 BiclustSet,ANY-method(BiclustSet-methods),4 BiclustSet,Biclust-method(BiclustSet-methods),4 BiclustSet,Factorization-method(BiclustSet-methods),4 BiclustSet,list-method(BiclustSet-methods),4 BiclustSet-class,3BiclustSet-methods,4combine,4getStats,5HCLtree,6,12,13,15jaccardMat,7,8,9,14–17 kulczynskiMat,7,8,14–17 ochiaiMat,7–9,9,14–17 plotProfilesAcrossAllSamples,10,13 plotProfilesWithinBicluster,11,12 plotSuper,6,11,12,15 plotSuperAll,10,12,13 sensitivityMat,7–9,13,15–17 show,BiclustSet-method(BiclustSet-class),3 similarity,6–9,14,14,16,17 sorensenMat,7–9,14,15,15,17 specificityMat,7–9,14–16,16summary,BiclustSet-method(BiclustSet-class),3superbiclust(superbiclust-package),2superbiclust-package,218。
测试软件详细操作说明书指南.doc
基于测试软件详细操作说明书指南本公司发展此套软件时,便以功能完整及使用简单两方向为出发点作研发,希望能以最少的操作程序完成所有的测试动作,因此我们运用大量数据库记录所有测试的条件,并包装成模块使得使用者在测试过程中不须输入大量的测试条件,此点将可达成三项优点 :降低测试者所须具备的测试知识,一但使用者设定完成测试资料后,往后的测试只须叫用,不必重新输入。
增加测试的重现性,测试不会因为不同的测试者而有所不同。
测试时间缩短,增加工作效率。
多国语言随机切换,满足不同国别客户需求。
基于以上几点,以下几章将就资料模块使用方法作一介绍。
建议电脑硬盘空间划分比例:盘占以上。
Chapter 2 如何安装、删除程序执行\,安装程序便会自动引导使用者完成所有安装动作.以下就各画面做一说明:自动安装相关信息到系统.步骤二:程序开始安装,当此画面出现后则程序安装完成,按下[]键,便完成所有安装动作。
程序的默认安装路径为:\下面就对:\里的文件作一一说明:文件夹:为力值校正档案存放之文件夹.文件夹:为测试结果数据档案存放之文件夹.文件夹:为测试结果图形档案存放之文件夹.文件夹:为演示所用测试数据档案存放之文件夹。
文件夹:为所有编辑的测试方法档案存放之文件夹。
文件夹:为所有编辑的报表格式档案存放之文件夹。
文件:为测试系统参数设定档案(严禁非专业人员修改)。
其他:\下面的文件客户可无须了解。
程序删除:重启电脑进入盘直接删除:\ 无须进控制面板卸载Chapter 3 如何完成测试如何进入测试程序在桌面上将鼠标移至右图上连续点击两次(双击)进入程序。
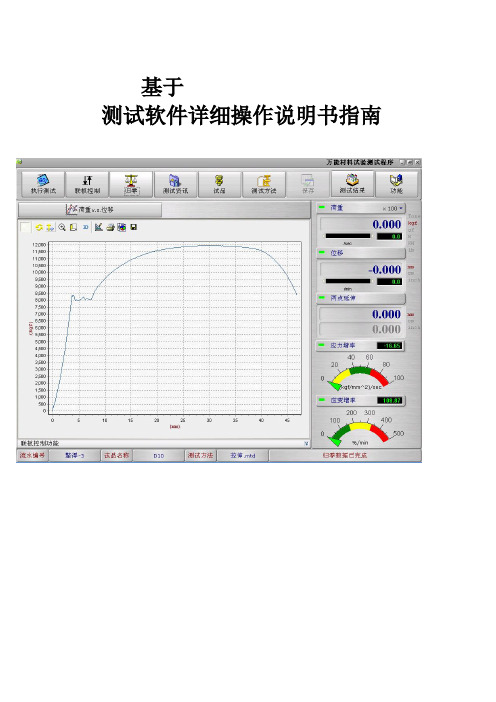
如何操作测试程序图测试程序主画面注。
将鼠标移至荷重绿灯处会显示此机台现用荷重元的容量。
注。
本套控制系统将荷重容量分为、、、、、、七档,程序默认从开始测试者也可根据需要点选从七档中的任何一档开始。
注.将鼠标悬停于右图之上单击鼠标左键数字增大,单击鼠标右键数字减小如何完成测试可依下列步骤进行:。
计算机速录技能测试软件使用说明
计算机速录技能测试软件使用说明第一篇:计算机速录技能测试软件使用说明计算机速录技能测试软件使用说明1、启动:双击桌面上名称为速录技能测试的JSFY图标,进入考试窗口;2、输入本人信息:在姓名、身份证号、核对身份证号栏目中输入对应信息,两次输入的身份证号必须一致。
3、登陆:信息输入完毕后,点击登陆按钮,系统会自动在在D盘速录技能测试文件夹中新建3个文本文件,名称分别是姓名_身份证号_120_001.txt、姓名_身份证号_120_002.txt、姓名_身份证号_160_001.txt。
如果这些文件已经存在,系统会保留原有文件。
登陆成功后,会弹出登陆成功提示窗口,按确定后开始考试,考试窗口将移至窗口顶部。
考试没有结束之前,请不要关闭该窗口,否则无法提交作业。
如果提示网络连接超时,可能是网络问题,请再次点击登陆按钮、重新尝试,直至登陆成功。
4、听打作业:不论使用何种输入法,务必确保作业文稿保存在系统自动建立的对应文本文件中。
点击考试窗口中绿色的三个按钮将分别用记事本打开对应的文件。
使用亚伟速录的,可进入亚伟界面,点击工具栏第二个按钮,打开指定文本文件,录入文稿,结束后直接保存。
也可在亚伟界面录入完毕后,复印、粘贴听打文稿至指定文件。
5、提交作业:每一段音频听打结束后,在规定的三分钟时间内提交作业文稿。
点击窗口中蓝色按钮将提交相应的作业文稿。
系统将在提交前检查作业文档是否为空文件,同时检查记事本是否关闭,请根据对应的提示操作,直至文档不为空,且关闭了对应的记事本程序,方可提交。
提交成功后系统会弹出提交成功提示窗口,看到此窗口,表示已经成功提交作业文件到服务器。
考试窗口左侧的窗口也会记录你的操作信息。
如果弹出网络连接超时窗口,可能是网络繁忙,请重新点击提交按钮,直到提交成功。
6、所有作业提交成功后,即可自行离开座位,考试程序不需要关闭。
7、帮助:单击帮助按钮,可弹出本程序使用说明。
第二篇:职工计算机速录技能比赛规则首届职工计算机速录技能比赛规则1、比赛分为初赛和复赛二部分2、参赛选手必须提前10分钟进入赛场,比赛开始后15分钟未到者按弃权处理。
GL's Voice Quality Testing (VQT) Software说明书

818 West Diamond Avenue - Third Floor, Gaithersburg, MD 20878, U.S.A Voice Quality Testing (VQT)(PESQ, POLQA v2.4, POLQA v3.0) OverviewGL's Voice Quality Testing (VQT) software supports the next -generation voice quality testing standard for fixed, mobile and IP -based networks using POLQA v2.4 and v3 (ITU -T P.863), PESQ (ITU -T P.862), PESQ LQ / LQO (P.862.1), and PESQ WB (P.862.2).The VQT fully supports analysis using POLQA ITU version 2.4 algorithm for NB (8000 sampling), WB (16000 sampling), and SWB (Super Wideband) (48000 sampling) in both manual and automated testing. It also supports analysis using latest PESQ ITU release including ITU -T P.862, 862.1 and 862.2 (supports PESQ, PESQ LQ, PESQ LQO, PESQ WB). The optional POLQA v3 (latest version of the POLQA algorithm) supports Full Band Audio Analysis which provides improved scoring for mobile based VoLTE, 5G and OTT applications using EVS and OPUS codecs. This latest POLQA v3 includes analysis which is more sensitive to distortions across the entire audio spectrum. In addition, POLQA v3 supports less harsh analysis of micropauses within the speech, reacts with less sensitivity to linear frequency distortions, and includes a significantly improved and streamlined perceptual model.The VQT software can work either independently, or in conjunction with VQuad ™- Dual UTA HD , or in conjunction with VQuad ™ Probe HD.VQT performs PESQ LQ/LQO/WB, and POLQA (NB, WB, SWB) simultaneously, using two voice files (Reference File and Degraded File) and provides the algorithm results in both a graphical and tabular format. Additional analytical results are displayed as part of the assessment such as MOS, E -Model, Signal Level, SNR, jitter, clipping, noise level, and delay (end to end as well as per speech utterance). All results are saved to file and database for post processing viewing along with sophisticated searching on the results within the VQT application and using the WebViewer ™ (remote and local access).For more details, visit Voice Quality Testing (VQT) Software webpage.POLQA® is a registered trademark of OPTICOM. GL is one of the Test & Measurement manufacturers that has adopted POLQA/P.863 in its Voice Quali-ty Test solution, by obtaining the essential rights to use POLQA® standard, and hereby acknowledge that the images or text references to POLQA used in this document originally copyrights with Opticom.Features• Voice Quality Testing (VQT) using POLQA ver 2.4 (ITU-T P.863), upgraded POLQA ver 3 (ITU-T P.863), and PESQ (ITU-T P.862)• Updates associated with POLQA v3 include redesign perceptual model for Full Band Audio analysis which is validated for VoLTE, 5G and OTT apps (supporting EVS and OPUS codecs)• Provides Active Speech and Noise Levels, Latency, Jitter, Clipping, and Power measurements• Manual or Auto modes of operations with centralized data access• Testing the voice quality over all types of telecom networks - Wireless, VoIP, TDM, and PSTN• Measure the effect of Packet Jitter in VoIP Network• Analyze the Effects of Codec Compression in Wireless Networks• Automatic mode allows the GL’s VQT to execute on a network system• VQT CLI or API is enhanced to fully support both Windows® and Linux for remote operations• Support for Central DB Primary & Secondary IP addresses configuration for backup and redundancy• Remote monitoring with result query and real-time statistics using web based WebViewer™• Real-time mapping of results with GPS option used in conjunction with VQuad™• Full support for IPv6 as well as IPv4 (includes VQT, GL Listener, and VQTCLI)• Enhanced to support Python scripting for Automation and Remote Access of Voice Quality Testing• Playback and display of audio from within VQT software using Goldwave softwarePOLQA v3 Upgrade Enhancements• POLQA v3 Super Wideband (SWB) supports 14kHz to full audio bandwidth up to 24kHz.• Full band analysis improves accuracy in assessment of codecs such as EVS, OPUS, AAC and LC3, as these codecs are used in many OTT applications• With Full band support the discriminative power of POLQA at the upper high quality range of the MOS scale is increased • Current OTT voice services using VoLTE/5G include highly dynamic delay jitter which leads to variations of the duration of very short pauses during speech. POLQA v3 handles these variations with increased precision• POLQA v3 reacts with less sensitivity to linear frequency distortions than POLQA v2.4. This makes measurements less dependent on the frequency characteristics of headsets• Perceptual model of POLQA v3 is significantly improved and streamlinedModes of OperationManual MeasurementThe GL VQT software provides a user-friendly interface to perform manual voice quality assessments using Reference File and Degraded File. The results of the VQT algorithms, POLQA, PESQ LQ/LQO/WB are displayed both in tabular format as well as graphically. All results may be saved to file for post processing viewing along with sophisticated searching on the results within the VQT application.Auto MeasurementVQT can be executed in Auto Mode, which is used when VQT resides on a network computer and point to a single or multiple user-specified network drives/directories. Voice files are recorded to this network drive/directory and GL VQT automatically performs the voice quality algorithms and displays the results. Multiple GL VQT Auto-Measurement sessions may be configured, each session with a unique set of requirements and a unique reference voice file. In addition, it includes an option to analyze 12-bit degraded files in comparison with 16-bit reference files (NB, WB, SWB POLQA). Along with the standard sampling rates, POLQA also supports user-specified Sampling Rate (between 8K to 48K).The user may configure a Rating Criteria for all VQT algorithms as well as the additional analytical results. The rating criteria may be configured for Excellent, Good, Fair, and Poor and the results of the rating criteria may be saved to file for post processing viewing.VQT System statistics provides Algorithm and Rating statistics available for all measurement results.VQT Results Analytical results are displayed as part of the assessment such as POLQA/PESQ MOS, E -Model, Signal Level, SNR, jitter, clipping, noise level, and delay (end -to -end as well as per speech utterance).Voice Quality Testing (PESQ)PESQ provides an objective measure that predicts the results of subjective listening tests on telephony systems. PESQ incorporates many new developments that distinguish it from earlier models for assessing codecs. These innovations allow PESQ to be used with confidence to assess end-to-end speech quality as well as the effect of such individual elements as codecs. The below figure shows VQT PESQ Measurement Results.• VQT PESQ supports analysis of 16-bit uncompressed PCM and WAV files, including NB (8000 sampling) and WB (16000 sampling)• VQT PESQ supports analysis of 8-bit compressed a-Law and mu-Law files• PESQ analysis results include PESQ, PESQ LQ, PESQ LQO, PESQ WB, PESQ Ie, and PESQ per Utterance• PESQ Results also include Signal Level, Noise Level, Delay, Delay per Utterance, and Jitter• Playback and display of audio from within VQT software using Goldwave SoftwarePerceptual Objective Listening Quality Analysis (POLQA), the successor of PESQ (ITU-T P.862) analysis, is the next generation voice quality testing standard for fixed, mobile and IP-based networks. Based on ITU-T P.863 standard, POLQA supports the HD-quality speech coding and network transport technology, with higher accuracy for 3G, 4G/LTE and VoIP networks. Upgrading to 3rd edition of ITU-T P.863, POLQA extends its scope and applicability towards 5G telephony and OTT codecs. The below figure shows VQT POLQA Measurement Results.• VQT POLQA supports analysis of 16-bit uncompressed PCM and WAV files, including NB (8000 sampling), WB (16000 sampling), SWB (48000 sampling)• POLQA supports user-specified Sampling Rate (specify any rate between 8K to 48K)• VQT POLQA supports analysis of 8-bit compressed a-Law and mu-Law files• VQT POLQA supports 12-bit Raw PCM Degraded voice files (NB, WB, SWB)• POLQA analysis results include POLQA MOS, E-Model R-Factor, Signal Level, Noise Level, Delay, and Jitter• VQT optionally supports POLQA v3 for VoLTE, 5G and OTT analysis• Playback and display of audio from within VQT software using Goldwave softwareGL's Voice Quality Test (VQT) POLQA Auto™ is an advanced, automated solution that analyzes thousands of voice files in mere minutes, effectively evaluating the quality of voice communications across various networks, including VoIP, Mobile, and PSTN. This solution utilizes the Perceptual Objective Listening Quality Assessment (POLQA per ITU-T P.863 version 2.4) algorithm, which is widely acknowledged as the industry benchmark for assessing voice quality. The GL VQT POLQA Auto™ application works in conjunction with GL's VQuad™, vMobile™, Voice Analysis Tool (VAT™), Message Automation and Protocol Simulation (MAPS™), orT1/E1 Analysis platforms reducing analysis time and increasing efficiency.The VQT POLQA Auto™ fully supports analysis using POLQA ITU version 2.4 algorithm for Narrowband (NB 8000 sampling), Wideband (WB 16000 sampling), and Super Wideband (SWB 48000 sampling) in automated testing. The tool offers a user friendly interface for automatic operation and generates comprehensive reports that provide detailed information on voice quality metrics such as Mean Opinion Score (MOS), Delay, Jitter, Packet Loss and more. These reports help user to identify issues to improve voice quality. The tool supports a wide range of codecs, including G.711, G.722, AMR, and EVS, making it suitable for testing various types of voice communication.• Analyze thousands of bulk PCM voice files in mere minutes• The Auto Test feature allows immediate analysis of files according to the configured settings upon invocation of the application • Uses POLQA version 2.4 (ITU-T P.863) algorithm for voice quality testing supporting NB 8000 samples, WB (16000 samples) and SWB (8000 samples)• Supports the installation of server software on Windows® PC and the client software on Windows®/Linux® platforms• VQT POLQA Auto™ analysis results include:− POLQA MOS− E-Model R-Factor− Signal Level− Noise Level− Delay (requires simultaneous Send and Record of the voice files)− Jitter− ClippingVQT WebViewer™The results/events associated with VQT (PESQ, POLQA) analysis is sent to the central database and can be queried using the GL VQT WebViewer™ (web browser). Outputs of the query can be displayed in tabular or graphical format while also output to Excel or Text. Results can also be plotted on Google Maps (GPS connectivity is required). For details, visit https:///web-based-client-for-voice-and-data-quality-testing.html webpage. The below figure shows VQT Results plotted on Google Map.• Real-time mapping of results with GPS option used in conjunction with VQuad™• The results can be accessed remotely from a database, queried and displayed in web browser using WebViewer™ either in tabular or graphic formatVQuad™ POLQA EventsAs an option, POLQA can be added directly to VQuad™ software with support for automated testing within the VQuad™ script. In this scenario the degraded voice files remain at the VQuad™ node for analysis and display within the VQuad™ software. The below figure shows VQuad™ POLQA Events.VQT Command Line InterfaceThe VQT Command Line Interface (CLI) is designed to remotely access various application functionalities and thus controlling VQT nodes located at various destinations. The supporting commands helps the VQT users to run the application installed on remote PC, get the connection status, run the analysis, load Auto Measurement configuration, start/stop Auto Measurement, save events captured to file, transfer the events captured to client, get any file from server or even get latest log, and other operations. The VQT CLI is supported on Windows® and Linux systems .VQT with Python APIThe VQT Python libraries provide a range of Python functions which can be used to remotely or locally control these two applications. The VQT library can be used to run automatic and manual VQT tests with custom settings.Python for VQT works by connecting to the existing VQT CLI and using a portion of the CLI commands to run manual and automated VQT tests. Class variables are linked to the settings for each test and can be changed easily.Main Features• Python scripts support accessing and VQT functionalities remotely• Controls VQT nodes located at various destinations• Automation with enhanced Python scripting and remote operation includes traffic generation, call control, and automated scheduling of operationFor complete details, refer to Command Line Interface for remote access webpage.Page 11Buyer’s GuideFor more details, visit Voice Quality Testing (VQT) Software webpage.818 West Diamond Avenue - Third Floor, Gaithersburg, MD 20878, U.S.A---01。
TestDirector7_6简易使用手册
TestDirector7.6简易使用手册1:序言:版本:V0.9版本文是在《TestDirector7.2简易使用手册》的基础上编写的,旨在读者通过对本文的阅读,可以大致了解TestDirector7.6中新增功能的使用方法。
如果你目前对TestDirector7.2并不十分了解,请先阅读《TestDirector7.2简易使用手册》,然后再阅读此文。
由于作者本人也对TestDirector 了解不够深入,如有错误的地方,还请阅读此文的朋友多批评指正。
2:阅读向导:本文包括四个部分:1.TestDirector7.6(简称TD7.6)系统管理员新增功能操作说明2.TD7.6用户新增功能操作说明3.TD7.6常见问题说明4.TD7.6高级功能说明3:系统管理员新增功能操作说明3.1系统安装3.1.1系统配置服务端配置:服务端配置除了硬盘空间要求提高之外,操作系统还要求必须打WIN2000 SP2。
不过可喜的是对数据库的支持更好了(支持Oracle9i是个好消息)。
平台An IBM-PC or compatible with a Pentium® II or III /266 MHz orhigher microprocessor.内存At least 128 MB of RAM memory. For improved performance, 256 MB isrecommended.硬盘大小At least 320 MB of free disk space is required for installing TestDirector on aWeb server (135 MB of free disk space on the system drive, and 185 MB offree disk space for the physical location). Note that if you store yourTestDirector projects on the same Web server, at least another 60 MB of diskspace is required.For Windows NT 4.0, at least another 140 MB of disk spacerequired for virtual memory.For Windows 2000, at least another 190 MB of disk space is required forvirtual memory.操作系统Windows NT 4.0 Server with Service Pack 6aWindows 2000 Server/Professional (with Service Pack 2)web服务Windows NT 4.0 Server with Service Pack 6a: Internet Information Server(IIS) 4.0Windows 2000 Advanced Server/Server/Professional: Internet InformationServer (IIS) 5.0数据库Microsoft AccessOracle: 7.3.4, 8.0.5, 8.1.6, 8.1.7, or 9.0.1.Microsoft SQL Server: 6.5 (requires SQL Service Pack 5a), 7.0, or 2000.Sybase: 11.9 or 12.0 (both work with Sybase 12.0 database client only)客户端配置:最大的变化应该是支持XP做为客户端,TD7.2的时候可是不支持。
SuperTestV软件使用说明书
微机控制全自动压力试验机软件说明书软件名称:SuperTest版本号:目录1.简介 ............................................................系统简介..................................................................软件简介..................................................................软件安装.................................................................2.界面功能.........................................................菜单.....................................................................用户操作.............................................用户注销.............................................高级参数.............................................软件激活.............................................硬件测试.............................................报表设置.............................................控制方式..............................................工具栏...................................................................试验类型选择.........................................试验选择.............................................报告.................................................力值校准.............................................力值检定.............................................定荷.................................................结束一组..............................................示值显示栏...............................................................载荷.................................................强度.................................................速度................................................. .试验参数区...............................................................试验(件)编号.......................................应力速率(加载速率) .................................试样(件)块数.......................................是否连续试验.........................................延时时间..............................................试验结果区............................................................... .控制按钮区............................................................... .加载曲线图............................................................... .状态栏...................................................................3.试验 ........................................................... .启动系统................................................................. .选择试验类型............................................................. .选择试验................................................................. .填写参数................................................................. .运行试验................................................................. .观察试验过程............................................................. .完成试验................................................................. .查询与打印...............................................................查询.................................................表头设置.............................................打印设置.............................................查看试验详细结果 .....................................打印及预览...........................................4.校准及检定...................................................... .校准主界面简介...........................................................示值显示栏...........................................校准结果.............................................加载曲线.............................................检测参数..............................................校准流程.................................................................开始校准.............................................校准.................................................设定校准结果.........................................打印校准结果.........................................5.高级参数.........................................................界面说明..................................................................基本参数..................................................................阀参数....................................................................PID控制参数 ..............................................................传感器校准值.............................................................6.常规问题解答....................................................1.简介1.1.系统简介系统包括数字伺服阀,高精度传感器,控制器及软件,控制精度高,可靠性好。
SuperTestV7.2软件使用使用说明

微机控制全自动压力试验机软件说明书软件名称:SuperTest版本号:7.2目录1.简介 (4)1.1.系统简介 (4)1.2.软件简介 (4)1.3.软件安装 (4)2.界面功能 (6)2.1.菜单 (6)2.1.1.用户操作 (6)2.1.2.用户注销 (7)2.1.3.高级参数 (8)2.1.4.软件激活 (8)2.1.5.硬件测试................................................................................................. 错误!未定义书签。
2.1.6.报表设置 (8)2.1.7.控制方式 (11)2.2.工具栏 (11)2.2.1.试验类型选择 (11)2.2.2.试验选择 (12)2.2.3.报告 (13)2.2.4.力值校准 (15)2.2.5.力值检定 (16)2.2.6.定荷 (16)2.2.7.结束一组 (17)2.2.8.退出 (17)2.3.示值显示栏 (17)2.3.1.载荷 (17)2.3.2.强度 (18)2.3.3.速度 (18)2.4.试验参数区 (18)2.4.1.试验(件)编号 (18)2.4.2.应力速率(加载速率) (18)2.4.3.试样(件)块数 (19)2.4.4.是否连续试验 (19)2.4.5.延时时间 (19)2.5.试验结果区 (19)2.6.控制按钮区 (19)2.7.加载曲线图 (20)2.8.状态栏 (20)3.试验 (21)3.1.启动系统 (21)3.2.选择试验类型 (25)3.3.选择试验 (25)3.4.填写参数 (25)3.5.运行试验 (25)3.6.观察试验过程 (26)3.7.完成试验 (26)3.8.查询与打印 (26)3.8.1.查询 (26)3.8.2.表头设置 (26)3.8.3.打印设置 (26)3.8.4.查看试验详细结果 (26)3.8.5.打印及预览 (26)4.校准及检定 (27)4.1.校准主界面简介 (27)4.1.1.工具栏 (27)4.1.2.示值显示栏 (29)4.1.3.校准结果 (29)4.1.4.加载曲线 (29)4.1.5.检测参数 (29)4.2.校准流程 (30)4.2.1.开始校准 (30)4.2.2.校准 (30)4.2.3.设定校准结果 (31)4.2.4.打印校准结果 (31)5.高级参数 (32)5.1.界面说明 (32)5.2.基本参数 (33)5.3.阀参数 (33)5.4.PID控制参数 (34)5.5.传感器校准值 (34)6.常规问题解答 (47)1.简介1.1. 系统简介系统包括数字伺服阀,高精度传感器,控制器及软件,控制精度高,可靠性好。
TestXpertII中文操作说明书

Zwick 软件操作说明一启动testXpertII程序二设置机器参数三设置测试参数——向导四 ZWICK万能材料试验机操作步骤(拉伸测试)五安全措施说明六修整七维护保养说明一、启动testXpertII程序1、打开计算机及控制箱上的电源2、双击图标3、单击“打开”将会出现如下图所示,显示所有程序4、双击所选程序5、单击“确定”,进入测试界面打开控制面板上的电源on二、设置机器参数1、单击“试验机”图标,将出现“标准仪器设置”框。
如图所示:上软限位(在程序控制下,横梁所能到达的最高位置,可根据实际情况设定)下软限位(在程序控制下,横梁所能到达的最低位置,可根据实际情况设定)当前工具间距/当前夹具间距(每次更换夹具时,都要将实测的夹具间距离值输入这里)载荷上限(设置载荷的上限位保护,一般为满负荷的120%)载荷下限(设置载荷的下限位保护,一般为满负荷的-120%)标准引伸计(当采用横梁做为位移测量时,选择横梁WN:******,当采用引伸计传感器做为位移测量时,请选择长量程引伸计WN:******)2、点击“扩展”如图所示:2.5N1S WN:170862 (机器编号)和试验机(机器)相连横梁 WN :170862(横梁编号)和横梁相连长量程引伸计(引伸计的名称)和标准引伸计相连当不使用长量程引伸计时,请将标准引伸计和横梁相连,如下图所示力传感器0.5KN(传感器的负荷)和标准传感器相连。
2、在“测试环境”中取一个名称,保存机器设置结果,不同的设置请保存为不同的“测试环境”名。
3、点击“确定”退出。
三、设置测试参数——Wizard(向导)用户所有的测试参数都在“向导”里设定和执行1、进入向导,单击“预测试”,进入如下文本框可根据需要设定文本框中的内容应注意:预载力一般为0.1---2N,预载测试速度一般为10mm/min,可根据实际情况设定。
在参数前口里打x 的为选择所需的测试参数,参数前口里没有打 x的未选。
- 1、下载文档前请自行甄别文档内容的完整性,平台不提供额外的编辑、内容补充、找答案等附加服务。
- 2、"仅部分预览"的文档,不可在线预览部分如存在完整性等问题,可反馈申请退款(可完整预览的文档不适用该条件!)。
- 3、如文档侵犯您的权益,请联系客服反馈,我们会尽快为您处理(人工客服工作时间:9:00-18:30)。
微机控制全自动压力试验机软件说明书软件名称:SuperTest版本号:7.2目录1.简介 (4)1.1.系统简介 (4)1.2.软件简介 (4)1.3.软件安装 (4)2.界面功能 (6)2.1.菜单 (6)2.1.1.用户操作 (6)2.1.2.用户注销 (7)2.1.3.高级参数 (8)2.1.4.软件激活 (8)2.1.5.硬件测试............................................................................................... 错误!未定义书签。
2.1.6.报表设置 (8)2.1.7.控制方式 (11)2.2.工具栏 (11)2.2.1.试验类型选择 (11)2.2.2.试验选择 (12)2.2.3.报告 (13)2.2.4.力值校准 (15)2.2.5.力值检定 (16)2.2.6.定荷 (16)2.2.7.结束一组 (16)2.2.8.退出 (17)2.3.示值显示栏 (17)2.3.1.载荷 (17)2.3.2.强度 (17)2.3.3.速度 (17)2.4.试验参数区 (18)2.4.1.试验(件)编号 (18)2.4.2.应力速率(加载速率) (18)2.4.3.试样(件)块数 (18)2.4.4.是否连续试验 (18)2.4.5.延时时间 (18)2.5.试验结果区 (19)2.6.控制按钮区 (19)2.7.加载曲线图 (20)2.8.状态栏 (20)3.试验 (21)3.1.启动系统 (21)3.2.选择试验类型 (23)3.3.选择试验 (23)3.4.填写参数 (23)3.5.运行试验 (24)3.6.观察试验过程 (24)3.7.完成试验 (24)3.8.查询与打印 (24)3.8.1.查询 (24)3.8.2.表头设置 (24)3.8.3.打印设置 (24)3.8.4.查看试验详细结果 (24)3.8.5.打印及预览 (24)4.校准及检定 (25)4.1.校准主界面简介 (25)4.1.1.工具栏 (25)4.1.2.示值显示栏 (27)4.1.3.校准结果 (27)4.1.4.加载曲线 (27)4.1.5.检测参数 (27)4.2.校准流程 (28)4.2.1.开始校准 (28)4.2.2.校准 (28)4.2.3.设定校准结果 (29)4.2.4.打印校准结果 (29)5.高级参数 (30)5.1.界面说明 (30)5.2.基本参数 (31)5.3.阀参数 (31)5.4.PID控制参数 (32)5.5.传感器校准值 (32)6.常规问题解答 (45)1.简介1.1. 系统简介系统包括数字伺服阀,高精度传感器,控制器及软件,控制精度高,可靠性好。
满足GB、ISO、ASTM等标准对水泥、砂浆、混凝土等材料的试验要求,适用于一路通道或两路通道的微机控制全自动液压式压力试验机或手动液压式压力试验机改造升级为微机控制全自动压力试验机。
系统具有以下功能:●具有力闭环控制功能;●能实现等载荷速率加载或等应力速率加载;●采用微机实现电子测量、自动完成试验;●计算机自动计算结果并打印报告;●同时支持串口或以太网的通讯方式。
1.2. 软件简介测控软件采用WINDOWS风格,界面友好,功能齐全,运行稳定,用户操作简单。
软件主要包括以下功能:●试验选择;●力值标定;●力值检定;●设定力值保载;●设定并打印试验报告;●载荷、强度、速度、载荷峰值、强度速度、加载曲线实时显示。
1.3. 软件安装插入随机附带软件光盘,打开光盘,按以下步骤操作即可完成软件安装。
1.双击打开光盘中setup.exe文件,程序就会自动开始安装;2.在接下来的出现的窗口中,点击“下一步”,出现安装路径选择窗口;3.在安装路径选择窗口设置路径,点击“下一步”。
程序缺省安装路径为“C:\ProgramFiles\Xingao\SuperTestV7.0\”除非必要,请不要更改安装路径,直接点击“下一步”;4.在接下来的界面中点击“安装”既开始程序自动安装;5.点击完成,既完成程序的安装,安装完成后桌面会出现图标,双击即可启动程序。
2.界面功能2.1. 菜单包括四部分:系统功能、系统设定、试验操作、关于。
2.1.1. 用户操作功能:管理系统操作用户,可以新增,删除“Tester”权限用户,修改“Admin”用户密码。
说明:此功能只对“Admin”权限开放。
方法:1单击菜单下的按钮,打开用户操作对话框;2新增用户:2.1单击按钮,打开新增用户对话框;2.2在对话框中输入用户名、密码和密码确认,单击完成新用户的增加;说明:新增加用户只能增加“Tester”权限用户。
3删除用户:3.1在系统用户框中选中需要删除的用户名;3.2单击完成用户删除;说明:删除用户只能删除“Tester”权限用户。
4修改密码:4.1在系统用户框中选中需要修改密码的用户名;4.2单击按钮,打开密码修改对话框;4.3在密码修改对话框中输入对应用户名的原密码、需要设置的新密码、新密码确认,单击完成用户密码修改。
2.1.2. 用户注销功能:在程序使用过程中完成不同用户间的切换工作。
方法:1单击菜单下的按钮,打开用户注销对话框;2在用户名下拉框选择需要重新登录的用户名,并输入相应的密码,单击完成。
2.1.3. 联机设置功能:在进入程序后可以重新选择联机参数进行联机。
方法:1. 单击菜单下的按钮,打开联机参数对话框;2. 选择好参数点确定即可进行重新联机。
说明:具体参数说明见启动系统。
2.1.4. 高级参数功能:1.设置系统的控制参数,包括控制参数、其他控制参数、PID参数、传感器校准值、破碎判断;2.读取控制器参数,系统软件和控制器控制参数上下校正;3.对参数按需要进行备份和还原。
说明:1.此功能只对“Admin”开放。
2.详细的参数介绍及方法见说明书高级参数部分;2.1.5. 软件激活功能:设置控制器的编号;激活软件,以保证软件能长期使用。
说明:此功能只对“Admin”开放。
方法:1设置控制器编号:1.1单击菜单下的按钮,打开软件激活对话框;1.2输入需要设置的控制器编号和设置控制器的密码,单击按钮完成控制器编号设置;2激活软件:2.1单击菜单下的按钮,打开软件激活对话框;2.2输入与控制器编号相应的软件激活密码,单击按钮完成软件激活。
2.1.6. 报表设置功能:添加、删除和编辑用户自定义报告格式(包括单打和多打)。
说明:此功能需要计算机安装Excel程序。
单打设置方法:1添加Excel报表:选中试验选择区试验,单击按钮,在打开的对话窗口中选择Excel模板路径,添加完成。
2删除Excel报表选中试验选择区中试验需要删除的报表,单击按钮,在弹出的确认对话框中选择“是”删除该报表。
3编辑报表3.1如果试验选择区中的试验前面有“+”符号,说明该试验存在Excel报表,点击“+”显示该试验存在的Excel报表,双击需要编辑的报表,打开报表编辑窗口;3.2窗口左边的为试验参数区,右边的为试验的报表模板。
在模板上单击需要输出数据的单元格,在试验参数区中选择需要输出到选中数据单元格的参数,在参数位置框中双击或按取得模板报表的地址。
参数名称: 试验拥有的所有可输出参数;参数位置: 试验参数输出到模板报表中的位置,;排列方式: 试验结果为多个数据时的排列方向;间隔: 试验结果为多个数据时数据输出的排列间隔;本组个数: 试验报表可输出的最多试验数量。
说明:参数名称中有个表头参数,该参数输出的是表头信息,共4列,是从指定格子分别往右偏移1,2,3列,具体几行根据表头设置。
4默认报表设计选中试验选择区试验,单击按钮或右键单击选择默认报表设计弹出singoreport报表。
(SingoReport设计见:SingoReport 报表)多打设置方法:1添加Excel报表:选中试验选择区试验,单击按钮或单击右键选择,在打开的对话窗口中选择Excel 模板路径,添加完成。
2删除Excel报表选中试验选择区中试验需要删除的报表,单击按钮或点右键选择,在弹出的确认对话框中选择“是”删除该报表。
3编辑报表3.3如果试验选择区中的试验前面有“+”符号,说明该试验存在Excel报表,点击“+”显示该试验存在的Excel报表,双击需要编辑的报表,打开报表编辑窗口;3.4窗口左边的为试验参数区,右边的为试验的报表模板。
在模板上单击需要输出数据的单元格,在试验参数区中选择需要输出到选中数据单元格的参数,在参数位置框中双击或按取得模板报表的地址。
参数名称: 试验拥有的所有可输出参数;参数位置: 试验参数输出到模板报表中的位置,;排列方式: 试验结果为多个数据时的排列方向;间隔: 试验结果为多个数据时数据输出的排列间隔;本组个数: 试验报表可输出的最多试验数量。
试样间隔:2个试验结果间的间隔。
排列方式:多组试验结果的排列方向。
3.3 单击保存,完成编辑,。
说明:1.报表编辑过程中不得退出Excel报表程序;2.参数位置允许空白,表示此参数不需输出至报表;2.1.7. 控制方式功能:设置系统的控制方式:自动和手动;方法:1.打开软件,点击菜单栏中的“系统设定”,如无“控制方式”选项,则先打开高级参数.设置“是否具备手动功能”为是,再点击“系统设定”进入控制方式选择窗口;;2.选择按钮完成切换。
说明:1.此功能需在系统高级参数设置系统支持手动控制功能;2.功能需要“Admin”权限进行更改。
2.1.8. 废除上一块数据功能:废除上一块试验数据;方法:在做完一块试验时,发现试验结果不对或其它原因可以点击该按钮进行该次试验结果的删除,删除完可以继续进行试验。
说明:该操作删除的是做完试验的最后一组数据,可以进行多次操作,即一块一块往前删除试验数据;2.2. 工具栏2.2.1. 试验类型选择功能:在抗折抗压试验机中使用,切换水泥抗折和抗压试验。
显示下陷按钮即为当前选中的试验状态。
方法:1抗压切换到抗折试验:1.1单击工具栏上的按钮,软件读取并核对控制器和软件控制参数;1.2如参数一致,切换完成;核对参数不一致,出现更改高级参数对话框提示;1.3根据需要选择单击上控制器更改模式,切换完成;●软件参数准确:以软件参数为准,更改控制器与软件不一致参数,更改后软件与控制器参数一致;●控制器参数准确:以控制器参数为准,更改软件与控制器不一致参数,更改后软件与控制器参数一致;●不更改:不更改软件及控制器不一致参数参数;●详细信息:查看软件及控制器中所有高级参数值,其中不一致参数以不同颜色区分;说明:1.软件与控制器参数不一致时,程序不能正常运行!2.高级参数的更改会影响到试验的准确性及机器的控制,需慎重更改.选择更改后会出现提示选“是”更改参数,选“否”不作更改。