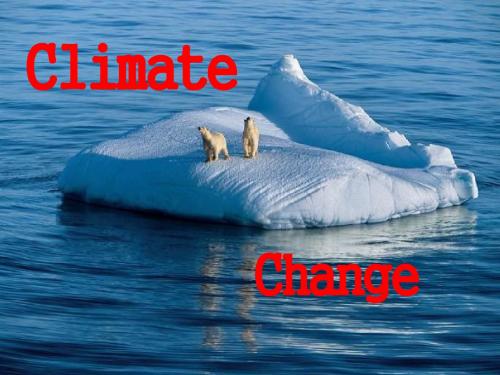
气候变化全英文climate-change讲义版共29页文档
中国应对全球气候变化英语演讲
中国应对全球气候变化英语演讲Professor Corbridge,Ladies and Gentlemen,I am honoured to talk to you on such an important subject as climate change. It’s a special honour, because the LSE is well-known for its scholarship on climate change and its crucial contribution to this global debate.China is a huge country with a population of 1.3 billion. It has diverse climatic conditions and a fragile environment. The effect of climate change is a very real threat which we face everyday.According to Chinese scientists, the average temperature in China has risen by 1.1 degrees centigrade in the last 5 decades. It is higher than the reported global average. We are seeing more frequent bouts of extreme weather in many parts of the country. Last spring, for example, the most severe drought in 50 years hit northern China affecting the livelihood of 4 million people.Environmental damage and climate change is a reality for us. Out of the world’s most polluted 20 cities, half are in China. 70% of Chinese rivers are polluted to some degree. China has become the largest carbon emitter of the world.How have we got here? China has reached this stage when it is making great endeavours to lift people out of poverty. Unlike you here,we have condensed 2 centuries of industrialization into only 30 years.Now, the Chinese people have woken to the threat and, with the same zeal that we have embraced industrialization, we are embracing cleaner development. In China, climate change is not just a topic for discussion; It’s backed up with policy an d action throughout the country. Let me share some examples with you.First, on the legal and policy front.China set forward a voluntary reduction program for 2006 to 2010 period, including 20% reduction in energy intensity per unit of GDP.To achieve this, we amended the Law on Energy Saving and the Law on Renewable Energy. We’ve also set up a strict evaluation system for energy efficiency. This enables the central government to hold provincial leaders accountable for meeting energy efficiency targets.Last month, the evaluation result for 2008 was released on the web for all to access. Out of 31 provinces and regions, 26 fulfilled emission reduction targets. One can’t underscore enough the importance of having such transparency as it places great pressure on those who are not meeting the target.Beijing is doing better, over-fulfilling its target for 2008, with over 7%.I am sure the Olympics helped. It has already achieved over 17% for the 20% target of 2010. At the bottom, you can see Xinjiang. It is lagging far behind and looks unlikely to meet the target and would need a lot of help.Secondly, now the industries have to take very tough decisions to achieve clean development.Projects with high emission can no longer go ahead and some existing high emitters are being phased out. It is understandably difficult to push through such reforms and there is, inevitably, resistance. Being a developing country, shutting down factories means job losses for many who need them.For example, we have achieved cutting down the average consumption of coal per unit of power by 20%, by demolishing the high-polluting and inefficient power plants. But it led to the loss of 400,000 jobs.So the third point is that we have increased and will continue to increase the percentage of cleaner alternative energy sources.Low-carbon and energy conservation have become new growth sectors in China. Many British companies are actively involved in clean development projects in China. In the first 9 months of this year, clean energy contrib uted a third of China’s newly added power capacity.China now ranks as first in the world for solar heating and photovoltaic generation, as well as installed hydro power capacity. You may be surprised to know, 1 in 10 families in China already use solar energy. That includes my family. Many new buildings in Chinese cities are equipped with solar energy. The fact that the Chinese people are so keento adopt clean energy is an excellent indicator of our dedication to a better future.Next, let’s talk about tr ees and reforestation. We all know how trees can absorb CO2 from the atmosphere. Chinese people have really taken tree-planting to heart. It has even become fashionable for young couples to plant trees to mark their wedding. China has planted more trees than any other country in the world, with 2.6 billion trees planted. That is 2 trees per individual, an incredible number.Last but not least, the only means for China to really achieve its ambitious plan is through science and technology. This is why China is investing heavily in research and development. The country has become a giant laboratory for testing all kinds of clean energy technologies.In the latest stimulus package worth 400 billion pound, 15% was invested in addressing climate change. I am sure you will agree that it is a huge amount by any standard, especially during the financial crisis.Thanks to all these efforts, China is well on track to reach our targets set for 2010. That would mean a reduction in CO2 emissions of 1.5 billion tons in five years by 2010. This is an achievement that compares well with the efforts of other countries.At the UN climate change summit last September, President Hu Jintao stated that China would take even further steps to counter climate change. To follow up, the Chinese government has announced its targetsfor 2020 based on 2005 levels.They include:- bringing down CO2 per unit of GDP by 40-45%,- increasing the ratio of non-fossil energy to 15%,- expanding forest coverage by 40 million hectares, that is bigger than one and half times the size of United Kingdom.We will make all these into compulsory and verifiable targets, within the framework of our domestic development program.I hope you will appreciate that achieving these targets and further reducing emission will get increasingly harder. Let me elaborate on that point.We have already closed down many of the old and high energy consuming factories, That is to say, the easier part is done. Between 1990 to 2005, the per unit GDP energy consumption came down by 47% and between 2005 to 2010 it will again come down by 20%. The next will be raising the energy efficiency of the remaining plants. It’s going to cost more and involve more sacrifice to reduce further.This is why investing in research and development is so critical for us, as only innovation can help China to make that leap. And this is why we are looking to developed countries for technology transfer and capacity building.According to the International Energy Agency, if China fulfils itstarget for 2020, it will have reduced its emissions of CO2 by 1 billion tons. That will be a great achievement, given that we are a developing country and we have equally pressing survival priorities.If you would allow me, I’d like to expand on this point; China may soon become the 2nd largest economy in the world. Yet it remains a developing country. This is something that many people often forget.China’s per capita GDP has just passed 3,000 US dollars. UK and US are 15 to 20 times that of China. China is behind Jamaica and Namibia.Now, let me ask you all a question: In which year in history do you think Britain was at the same income level China now is at? According to British economist Angus Maddison, the answer is the year 1913.In per capita GDP terms, China only ranks at 104th place in the world. It might be a surprise to some of you that China has 135 million people living under one dollar a day. Sometimes even the most basic things that we take for granted, like water, are beyond the reach of some Chinese people.Take for example, in China’s northwest, water is so scarce that farmers in a village in Gansu province only take three baths in their entire life, at birth, at marriage and at death.When discussing climate change, we tend to talk mostly about facts and figures, but we should not forget that, there is also the human dimension.Imagine when electricity reaches this Gansu village, which is what China has been doing, bringing electricity to every village, not only are the farmers able to drill deeper for water, but also their children would be able to watch TV for the first time and see the wonderful outside world. They of course will dream about a better life and all the things that come with it.Who are we to tell them, that they have no right to have what we have? Who are we to tell them that they can’t live like the people in Shanghai or London they see on TV? Why can’t they have ipods, laptops and refrigerators, or even cars?This is the human dimension, and this is the challenge.China’s difficult miss ion is to enable all of its 1.3 billion people to have the opportunity to realize their dreams, but to achieve it in a environmentally responsible way.Now let’s come back to the point about China being the world’s biggest CO2 emitter. If you look at the figures in per capita terms, an average Chinese person’s emission is 4.6 tons. An average American emits 20 tons, in the yellow colour and Britain 10 tons in the blue colour. You can hardly call China energy greedy, can you?Yet, according to an FT survey, 63% of Americans believe that China is not doing enough and that it should undertake more emission reduction. It feels like a person taking 4 pieces of bread asking the personwho got the first piece of bread to go on diet.Between 1750 and 2005, developed countries accounted for 80% of the world’s CO2 emissions. Even today, with only 20% of the world’s population, developed countries pump more than 55% of the total emissions into the atmosphere. So when it comes to emissions, developed and developing count ries can’t be compared like for like, not to be painted in the same brush.This is why we attach so much importance to the UN Framework Convention on Climate Change, which set out the principle of common but differentiated responsibilities. This is ultimately about fairness and equal right to development.The Copenhagen conference will commence in 5 days’ time. It will be a major milestone in the global effort to tackle climate change and the people of the world have high hopes on its outcome. For Copenhagen to be successful, China believes several things need to happen.First, developed countries should undertake to achieve substantial emission reduction targets for the second commitment period under the Kyoto Protocol. Countries that have not signed up to the Kyoto Protocol should formulate similar reduction targets.Second, effective mechanisms should be set up to ensure that developed countries provide financial and technological support to developing countries.Third, developing country should also adopt mitigation measures according to their national conditions, within the framework of sustainable development and with financial and technological support from the developed countries.Chinese Premier Wen Jiabao will attend the conference. China is willing to play a constructive role in bringing the negotiations to a successful conclusion. We look forward to close cooperation with the UK and the rest of the world in this process.All in all, climate change is a global challenge, which can only be resolved through global cooperation. As a mother, I do hope my daughter and the future generations will breathe clean air and live in a good environment. So countries should work together as partners to make sure that our children inherit a better world.Thank you.。
世界气候变化Climate Change(温室效应Green House Effect)英文介绍
into space; the rest is absorbed by Earth’s system 3. Because of greenhouse gases in the atmosphere, only some of the sun’s energy is allowed to escape immediately—instead, the gases stay within the atmosphere, bouncing in all directions 4. The atmosphere is heated up as less and less gases are let out into space and more energy is absorbed by Earth
CO2 emissions Every ton of coal actually releases 2.86 tons of CO2—how is this possible?
Because coal is compressed carbon—when the carbon gets released,
Definitions according to
Global Warming process
1. The sun emits energy towards the Earth 2. The Earth reflects around 30% of the energy back
Process
Causes
What human-related causes are there? Deforestation Agriculture Fossil fuel burning Aerosol gases
全球气候变化Global temperature change
Global temperature changeJames Hansen*†‡,Makiko Sato*†,Reto Ruedy*§,Ken Lo*§,David W.Lea ¶,and Martin Medina-Elizade ¶*National Aeronautics and Space Administration Goddard Institute for Space Studies,†Columbia University Earth Institute,and §Sigma Space Partners,Inc.,2880Broadway,New York,NY 10025;and ¶Department of Earth Science,University of California,Santa Barbara,CA 93106Contributed by James Hansen,July 31,2006Global surface temperature has increased Ϸ0.2°C per decade in the past 30years,similar to the warming rate predicted in the 1980s in initial global climate model simulations with transient greenhouse gas changes.Warming is larger in the Western Equatorial Pacific than in the Eastern Equatorial Pacific over the past century,and we suggest that the increased West–East temperature gradient may have increased the likelihood of strong El Niños,such as those of 1983and parison of measured sea surface temperatures in the Western Pacific with paleoclimate data suggests that this critical ocean region,and probably the planet as a whole,is approximately as warm now as at the Holocene maximum and within Ϸ1°C of the maximum temperature of the past million years.We conclude that global warming of more than Ϸ1°C,relative to 2000,will constitute ‘‘dangerous’’climate change as judged from likely effects on sea level and extermination of species.climate change ͉El Niños ͉global warming ͉sea level ͉species extinctionsGlobal temperature is a popular metric for summarizing the state of global climate.Climate effects are felt locally,but the global distribution of climate response to many global climate forcings is reasonably congruent in climate models (1),suggesting that the global metric is surprisingly useful.We will argue further,consistent with earlier discussion (2,3),that measurements in the Western Pacific and Indian Oceans provide a good indication of global temperature change.We first update our analysis of surface temperature change based on instrumental data and compare observed temperature change with predictions of global climate change made in the 1980s.We then examine current temperature anomalies in the tropical Pacific Ocean and discuss their possible significance.Finally,we compare paleoclimate and recent data,using the Earth’s history to estimate the magnitude of global warming that is likely to constitute dan-gerous human-made climate change.Modern Global Temperature ChangeGlobal surface temperature in more than a century of instrumental data is recorded in the Goddard Institute for Space Studies analysis for 2005.Our analysis,summarized in Fig.1,uses documented procedures for data over land (4),satellite measurements of sea surface temperature (SST)since 1982(5),and a ship-based analysis for earlier years (6).Estimated 2error (95%confidence)in comparing nearby years of global temperature (Fig.1A ),such as 1998and 2005,decreases from 0.1°C at the beginning of the 20th century to 0.05°C in recent decades (4).Error sources include incomplete station coverage,quantified by sampling a model-generated data set with realistic variability at actual station loca-tions (7),and partly subjective estimates of data quality problems (8).The estimated uncertainty of global mean temperature implies that we can only state that 2005was probably the warmest year.The map of temperature anomalies for the first half-decade of the 21st century (Fig.1B ),relative to 1951–1980climatology,shows that current warmth is nearly ubiquitous,generally larger over land than over ocean,and largest at high latitudes in the Northern Hemi-sphere.Our ranking of 2005as the warmest year depends on the positive polar anomalies,especially the unusual Arctic warmth.In calculating the global mean,we give full weight to all regions based on area.Meteorological stations are sparse in the Arctic,but the estimated strong warm anomaly there in 2005is consistent withrecord low sea ice concentration and Arctic temperature anomalies inferred from infrared satellite data (9).Our analysis includes estimated temperature anomalies up to 1,200km from the nearest measurement station (7).Resulting spatial extrapolations and interpolations of temperature anomalies usually are meaningful for seasonal and longer time scales at middle and high latitudes,where the spatial scale of anomalies is set by Rossby waves (7).Thus,we believe that the unusual Arctic warmth of 2005is real.Other characteristics of our analysis method are summarized in Supporting Text ,which is published as supporting information on the PNAS web site.Independent analysis by the National Climate Data Center ( ͞oa ͞climate ͞research ͞2005͞ann ͞global.html),using a ‘‘teleconnection’’approach to fill in data sparse regions,also finds 2005to be the warmest year.The joint analysis of the University of East Anglia and the Hadley Centre ( ͞research ͞hadleycentre ͞obsdata ͞globaltemperature.html)also yields high global tem-perature for 2005,but a few hundredths of a degree cooler than in 1998.Record,or near record,warmth in 2005is notable,because global temperature did not receive a boost from an El Niño in 2005.The temperature in 1998,on the contrary,was lifted 0.2°C above the trend line by a ‘‘super El Niño’’(see below),the strongest El Niño of the past century.Global warming is now 0.6°C in the past three decades and 0.8°C in the past century.It is no longer correct to say ‘‘most global warming occurred before 1940.’’A better summary is:slow global warming,with large fluctuations,over the century up to 1975,followed by rapid warming at a rate Ϸ0.2°C per decade.Global warming was Ϸ0.7°C between the late 19th century (the earliest time at which global mean temperature can be accurately defined)and 2000,and continued warming in the first half decade of the 21st century is consistent with the recent rate of ϩ0.2°C per decade.The conclusion that global warming is a real climate change,not an artifact due to measurements in urban areas,is confirmed by surface temperature change inferred from borehole temperature profiles at remote locations,the rate of retreat of alpine glaciers around the world,and progressively earlier breakup of ice on rivers and lakes (10).The geographical distribution of warming (Fig.1B )provides further proof of real climate rgest warming is in remote regions including high latitudes.Warming occurs over ocean areas,far from direct human effects,with warming over ocean less than over land,an expected result for a forced climate change because of the ocean’s great thermal inertia.Early Climate Change Predictions.Manabe and Wetherald (11)madethe first global climate model (GCM)calculations of warming dueAuthor contributions:D.W.L.and M.M.-E.contributed data;J.H.,M.S.,R.R.,K.L.,D.W.L.,and M.M.-E.analyzed data;and J.H.wrote the paper.The authors declare no conflict of interest.Freely available online through the PNAS open access option.Abbreviations:SST,sea surface temperature;GHG,greenhouse gas;EEP,Eastern Equatorial Pacific;WEP,Western Equatorial Pacific;DAI,dangerous antrhopogenic interference;BAU,business as usual;AS,alternative scenario;BC,black carbon.‡Towhom correspondence should be addressed:E-mail:jhansen@.©2006by The National Academy of Sciences of the USA14288–14293͉PNAS ͉September 26,2006͉vol.103͉no.39 ͞cgi ͞doi ͞10.1073͞pnas.0606291103to instant doubling of atmospheric CO 2.The first GCM calculations with transient greenhouse gas (GHG)amounts,allowing compar-ison with observations,were those of Hansen et al.(12).It has been asserted that these calculations,presented in congressional testi-mony in 1988(13),turned out to be ‘‘wrong by 300%’’(14).That assertion,posited in a popular novel,warrants assessment because the author’s views on global warming have been welcomed in testimony to the United States Senate (15)and in a meeting with the President of the United States (16),at a time when the Earth may be nearing a point of dangerous human-made interference with climate (17).The congressional testimony in 1988(13)included a graph (Fig.2)of simulated global temperature for three scenarios (A,B,and C)and maps of simulated temperature change for scenario B.The three scenarios were used to bracket likely possibilities.Scenario A was described as ‘‘on the high side of reality,’’because it assumed rapid exponential growth of GHGs and it included no large volcanic eruptions during the next half century.Scenario C was described as ‘‘a more drastic curtailment of emissions than has generally been imagined,’’specifically GHGs were assumed to stop increasing after 2000.Intermediate scenario B was described as ‘‘the most plausi-ble.’’Scenario B has continued moderate increase in the rate of GHG emissions and includes three large volcanic eruptions sprin-kled through the 50-year period after 1988,one of them in the 1990s.Real-world GHG climate forcing (17)so far has followed a course closest to scenario B.The real world even had one large volcanic eruption in the 1990s,Mount Pinatubo in 1991,whereas scenario B placed a volcano in 1995.Fig.2compares simulations and observations.The red curve,as in ref.12,is the updated Goddard Institute for Space Studies observational analysis based on meteorological stations.The black curve is the land–ocean global temperature index from Fig.1,which uses SST changes for ocean areas (5,6).The land–ocean temper-ature has more complete coverage of ocean areas and yields slightly smaller long-term temperature change,because warming on aver-age is less over ocean than over land (Fig.1B ).Temperature change from climate models,including that re-ported in 1988(12),usually refers to temperature of surface air over both land and ocean.Surface air temperature change in a warming climate is slightly larger than the SST change (4),especially in regions of sea ice.Therefore,the best temperature observation for comparison with climate models probably falls between the mete-orological station surface air analysis and the land–ocean temper-ature index.Observed warming (Fig.2)is comparable to that simulated for scenarios B and C,and smaller than that for scenario A.Following refs.18and 14,let us assess ‘‘predictions’’by comparing simulated and observed temperature change from 1988to the most recent year.Modeled 1988–2005temperature changes are 0.59,0.33,and 0.40°C,respectively,for scenarios A,B,and C.Observed temper-ature change is 0.32°C and 0.36°C for the land–ocean index and meteorological station analyses,respectively.Warming rates in the model are 0.35,0.19,and 0.24°C per decade for scenarios A,B.and C,and 0.19and 0.21°C per decade for the observational analyses.Forcings in scenarios B and C are nearly the same up to 2000,so the different responses provide one measure of unforced variability in the model.Because of this chaotic variability,a 17-year period is too brief for precise assessment of model predictions,but distinction among scenarios and comparison with the real world will become clearer within a decade.Close agreement of observed temperature change with simula-tions for the most realistic climate forcing (scenario B)is accidental,given the large unforced variability in both model and real world.Indeed,moderate overestimate of global warming is likely because the sensitivity of the model used (12),4.2°C for doubled CO 2,is larger than our current estimate for actual climate sensitivity,which is 3Ϯ1°C for doubled CO 2,based mainly on paleoclimate data (17).More complete analyses should include other climate forcingsandFig.1.Surface temperature anomalies relative to 1951–1980from surface air measurements at meteorological stations and ship and satellite SST measurements.(A )Global annual mean anomalies.(B )Temperature anomaly for the first half decade of the 21stcentury.Annual Mean Global Temperature Change: ΔT s (°C)Fig.2.Global surface temperature computed for scenarios A,B,and C (12),compared with two analyses of observational data.The 0.5°C and 1°C tempera-ture levels,relative to 1951–1980,were estimated (12)to be maximum global temperatures in the Holocene and the prior interglacial period,respectively.Hansen et al.PNAS ͉September 26,2006͉vol.103͉no.39͉14289E N V I R O N M E N T A L S C I E N C EScover longer periods.Nevertheless,it is apparent that the first transient climate simulations (12)proved to be quite accurate,certainly not ‘‘wrong by 300%’’(14).The assertion of 300%error may have been based on an earlier arbitrary comparison of 1988–1997observed temperature change with only scenario A (18).Observed warming was slight in that 9-year period,which is too brief for meaningful comparison.Super El Niños.The 1983and 1998El Niños were successivelylabeled ‘‘El Niño of the century,’’because the warming in the Eastern Equatorial Pacific (EEP)was unprecedented in 100years (Fig.3).We suggest that warming of the Western Equatorial Pacific (WEP),and the absence of comparable warming in the EEP,has increased the likelihood of such ‘‘super El Niños.’’In the ‘‘normal’’(La Niña)phase of El Niño Southern Oscillation the east-to-west trade winds push warm equatorial surface water to the west such that the warmest SSTs are located in the WEP near Indonesia.In this normal state,the thermocline is shallow in the EEP,where upwelling of cold deep water occurs,and deep in the WEP (figure 2of ref.20).Associated with this tropical SST gradient is a longitudinal circulation pattern in the atmosphere,the Walker cell,with rising air and heavy rainfall in the WEP and sinking air and drier conditions in the EEP.The Walker circulation enhances upwelling of cold water in the East Pacific,causing a powerful positive feedback,the Bjerknes (21)feedback,which tends to maintain the La Niña phase,as the SST gradient and resulting higher pressure in the EEP support east-to-west trade winds.This normal state is occasionally upset when,by chance,the east-to-west trade winds slacken,allowing warm water piled up in the west to slosh back toward South America.If the fluctuation is large enough,the Walker circulation breaks down and the Bjerknes feedback loses power.As the east-to-west winds weaken,the Bjerknes feedback works in reverse,and warm waters move more strongly toward South America,reducing the thermocline tilt and cutting off upwelling of cold water along the South American coast.In this way,a classical El Niño is born.Theory does not provide a clear answer about the effect of global warming on El Niños (19,20).Most climate models yield either a tendency toward a more El Niño-like state or no clear change (22).It has been hypothesized that,during the early Pliocene,when the Earth was 3°C warmer than today,a permanent El Niño condition existed (23).We suggest,on empirical grounds,that a near-term global warming effect is an increased likelihood of strong El Niños.Fig.1B shows an absence of warming in recent years relative to 1951–1980in the equatorial upwelling region off the coast of South America.This is also true relative to the earliest period of SST data,1870–1900(Fig.3A ).Fig.7,which is published as supporting information on the PNAS web site,finds a similar result for lineartrends of SSTs.The trend of temperature minima in the East Pacific,more relevant for our purpose,also shows no equatorial warming in the East Pacific.The absence of warming in the EEP suggests that upwelling water there is not yet affected much by global warming.Warming in the WEP,on the other hand,is 0.5–1°C (Fig.3).We suggest that increased temperature difference between the near-equatorial WEP and EEP allows the possibility of increased temperature swing from a La Niña phase to El Niño,and that this is a consequence of global warming affecting the WEP surface sooner than it affects the deeper ocean.Fig.3B compares SST anomalies (12-month running means)in the WEP and EEP at sites (marked by circles in Fig.3A )of paleoclimate data discussed below.Absolute temperatures at these sites are provided in Fig.8,which is published as supporting information on the PNAS web site.Even though these sites do not have the largest warming in the WEP or largest cooling in the EEP,Fig.3B reveals warming of the WEP relative to the EEP [135-year changes,based on linear trends,are ϩ0.27°C (WEP)and Ϫ0.01°C (EEP)].The 1983and 1998El Niños in Fig.3B are notably stronger than earlier El Niños.This may be partly an artifact of sparse early data or the location of data sites,e.g.,the late 1870s El Niño is relatively stronger if averages are taken over Niño 3or a 5°ϫ10°box.Nevertheless,‘‘super El Niños’’clearly were more abundant in the last quarter of the 20th century than earlier in the century.Global warming is expected to slow the mean tropical circulation (24–26),including the Walker cell.Sea level pressure data suggest a slowdown of the longitudinal wind by Ϸ3.5%in the past century (26).A relaxed longitudinal wind should reduce the WEP–EEP temperature difference on the broad latitudinal scale (Ϸ10°N to 15°S)of the atmospheric Walker cell.Observed SST anomalies are consistent with this expectation,because the cooling in the EEP relative to WEP decreases at latitudes away from the narrower region strongly affected by upwelling off the coast of Peru (Fig.3A ).Averaged over 10°N to 15°S,observed warming is as great in the EEP as in the WEP (see also Fig.7).We make no suggestion about changes of El Niño frequency,and we note that an abnormally warm WEP does not assure a strong El Niño.The origin and nature of El Niños is affected by chaotic ocean and atmosphere variations,the season of the driving anomaly,the state of the thermocline,and other factors,assuring that there will always be great variability of strength among El Niños.Will increased contrast between near-equatorial WEP and EEP SSTs be maintained or even increase with more global warming?The WEP should respond relatively rapidly to increasing GHGs.In the EEP,to the extent that upwelling water has not been exposed to the surface in recent decades,little warming is expected,andtheBSST Change (°C) from 1870-1900 to 2001-2005Western and Eastern Pacific Temperature Anomalies (°C)parison of SST in West and East Equatorial Pacific Ocean.(A )SST in 2001–2005relative to 1870–1900,from concatenation of two data sets (5,6),as described in the text.(B )SSTs (12-month running means)in WEP and EEP relative to 1870–1900means.14290͉ ͞cgi ͞doi ͞10.1073͞pnas.0606291103Hansen etal.contrast between WEP and EEP may remain large or increase in coming decades.Thus,we suggest that the global warming effect on El Niños is analogous to an inferred global warming effect on tropical storms (27).The effect on frequency of either phenomenon is unclear,depending on many factors,but the intensity of the most powerful events is likely to increase as GHGs increase.In this case,slowing the growth rate of GHGs should diminish the probability of both super El Niños and the most intense tropical storms.Estimating Dangerous Climate ChangeModern vs.Paleo Temperatures.Modern SST measurements (5,6)are compared with proxy paleoclimate temperature (28)in the WEP (Ocean Drilling Program Hole 806B,0°19ЈN,159°22ЈE;site circled in Fig.3A )in Fig.4A .Modern data are from ships and buoys for 1870–1981(6)and later from satellites (5).In concatenation of satellite and ship data,as shown in Fig.8A ,the satellite data are adjusted down slightly so that the 1982–1992mean matches the mean ship data for that period.The paleoclimate SST,based on Mg content of foraminifera shells,provides accuracy to Ϸ1°C (29).Thus we cannot be sure that we have precisely aligned the paleo and modern temperature scales.Accepting paleo and modern temperatures at face value implies a WEP 1870SST in the middle of its Holocene range.Shifting the scale to align the 1870SST with the lowest Holocene value raises the paleo curve by Ϸ0.5°C.Even in that case,the 2001–2005WEPSST is at least as great as any Holocene proxy temperature at that location.Coarse temporal resolution of the Holocene data,Ϸ1,000years,may mask brief warmer excursions,but cores with higher resolution (29)suggest that peak Holocene WEP SSTs were not more than Ϸ1°C warmer than in the late Holocene,before modern warming.It seems safe to assume that the SST will not decline this century,given continued increases of GHGs,so in a practical sense the WEP temperature is at or near its highest level in the Holocene.Fig.5,including WEP data for the past 1.35million years,shows that the current WEP SST is within Ϸ1°C of the warmest intergla-cials in that period.The Tropical Pacific is a primary driver of the global atmosphere and ocean.The tropical Pacific atmosphere–ocean system is the main source of heat transported by both the Pacific and Atlantic Oceans (2).Heat and water vapor fluxes to the atmosphere in the Pacific also have a profound effect on the global atmosphere,as demonstrated by El Niño Southern Oscillation climate variations.As a result,warming of the Pacific has worldwide repercussions.Even distant local effects,such as thinning of ice shelves,are affected on decade-to-century time scales by subtropical Pacific waters that are subducted and mixed with Antarctic Intermediate Water and thus with the Antarctic Circumpolar Current.The WEP exhibits little seasonal or interannual variability of SST,typically Ͻ1°C,so its temperature changes are likely to reflect large scale processes,such as GHG warming,as opposed to small scale processes,such as local upwelling.Thus,record Holocene WEP temperature suggests that global temperature may also be at its highest level.Correlation of local and global temperature change for 1880–2005(Fig.9,which is published as supporting information on the PNAS web site)confirms strong positive correlation of global and WEP temperatures,and an even stronger correlation of global and Indian Ocean temperatures.The Indian Ocean,due to rapid warming in the past 3–4decades,is now warmer than at any time in the Holocene,independent of any plausible shift of the modern temperature scale relative to the paleoclimate data (Fig.4C ).In contrast,the EEP (Fig.4B )and perhaps Central Antarctica (Vostok,Fig.4D )warmed less in the past century and are probably cooler than their Holocene peak values.However,as shown in Figs.1B and 3A ,those are exceptional regions.Most of the world and the global mean have warmed as much as the WEP and Indian Oceans.We infer that global temperature today is probably at or near its highest level in the Holocene.Fig.5shows that recent warming of the WEP has brought its temperature within Ͻ1°C of its maximum in the past million years.There is strong evidence that the WEP SST during the penultimate interglacial period,marine isotope stage (MIS)5e,exceeded the WEP SST in the Holocene by 1–2°C (30,31).This evidence is consistent with data in Figs.4and 5and with our conclusion that the Earth is now within Ϸ1°C of its maximum temperature in the past million years,because recent warming has lifted the current temperature out of the prior Holocenerange.parison of modern surface temperature measurements with paleoclimate proxy data in the WEP (28)(A ),EEP (3,30,31)(B ),Indian Ocean (40)(C ),and Vostok Antarctica (41)(D).Fig.5.Modern sea surface temperatures (5,6)in the WEP compared with paleoclimate proxy data (28).Modern data are the 5-year running mean,while the paleoclimate data has a resolution of the order of 1,000years.Hansen et al.PNAS ͉September 26,2006͉vol.103͉no.39͉14291E N V I R O N M E N T A L S C I E N C ESCriteria for Dangerous Warming.The United Nations FrameworkConvention on Climate Change (www.unfccc.int)has the objective ‘‘to achieve stabilization of GHG concentrations’’at a level pre-venting ‘‘dangerous anthropogenic interference’’(DAI)with cli-mate,but climate change constituting DAI is undefined.We suggest that global temperature is a useful metric to assess proximity to DAI,because,with knowledge of the Earth’s history,global tem-perature can be related to principal dangers that the Earth faces.We propose that two foci in defining DAI should be sea level and extinction of species,because of their potential tragic consequences and practical irreversibility on human time scales.In considering these topics,we find it useful to contrast two distinct scenarios abbreviated as ‘‘business-as-usual’’(BAU)and the ‘‘alternative scenario’’(AS).BAU has growth of climate forcings as in intermediate or strong Intergovernmental Panel on Climate Change scenarios,such as A1B or A2(10).CO 2emissions in BAU scenarios continue to grow at Ϸ2%per year in the first half of this century,and non-CO 2positive forcings such as CH 4,N 2O,O 3,and black carbon (BC)aerosols also continue to grow (10).BAU,with nominal climate sensitivity (3Ϯ1°C for doubled CO 2),yields global warming (above year 2000level)of at least 2–3°C by 2100(10,17).AS has declining CO 2emissions and an absolute decrease of non-CO 2climate forcings,chosen such that,with nominal climate sensitivity,global warming (above year 2000)remains Ͻ1°C.For example,one specific combination of forcings has CO 2peaking at 475ppm in 2100and a decrease of CH 4,O 3,and BC sufficient to balance positive forcing from increase of N 2O and decrease of sulfate aerosols.If CH 4,O 3,and BC do not decrease,the CO 2cap in AS must be lower.Sea level implications of BAU and AS scenarios can be consid-ered in two parts:equilibrium (long-term)sea level change and ice sheet response time.Global warming Ͻ1°C in AS keeps tempera-tures near the peak of the warmest interglacial periods of the past million years.Sea level may have been a few meters higher than today in some of those periods (10).In contrast,sea level was 25–35m higher the last time that the Earth was 2–3°C warmer than today,i.e.,during the Middle Pliocene about three million years ago (32).Ice sheet response time can be investigated from paleoclimate evidence,but inferences are limited by imprecise dating of climate and sea level changes and by the slow pace of weak paleoclimate forcings compared with stronger rapidly increasing human-made forcings.Sea level rise lagged tropical temperature by a few thousand years in some cases (28),but in others,such as Meltwater Pulse 1A Ϸ14,000years ago (33),sea level rise and tropical temperature increase were nearly synchronous.Intergovernmental Panel on Climate Change (10)assumes negligible contribution to 2100sea level change from loss of Greenland and Antarctic ice,but that conclusion is implausible (17,34).BAU warming of 2–3°C would bathe most of Greenland and West Antarctic in melt-water during lengthened melt seasons.Multiple positive feedbacks,in-cluding reduced surface albedo,loss of buttressing ice shelves,dynamical response of ice streams to increased melt-water,and lowered ice surface altitude would assure a large fraction of the equilibrium ice sheet response within a few centuries,at most (34).Sea level rise could be substantial even in the AS,Ϸ1m per century,and cause problems for humanity due to high population in coastal areas (10).However,AS problems would be dwarfed by the disastrous BAU,which could yield sea level rise of several meters per century with eventual rise of tens of meters,enough to transform global coastlines.Extinction of animal and plant species presents a picture anal-ogous to that for sea level.Extinctions are already occurring as a result of various stresses,mostly human-made,including climate change (35).Plant and animal distributions are a reflection of the regional climates to which they are adapted.Thus,plants and animals attempt to migrate in response to climate change,but theirpaths may be blocked by human-constructed obstacles or natural barriers such as coastlines.A study of 1,700biological species (36)found poleward migration of 6km per decade and vertical migration in alpine regions of 6m per decade in the second half of the 20th century,within a factor of two of the average poleward migration rate of surface isotherms (Fig.6A )during 1950–1995.More rapid warming in 1975–2005yields an average isotherm migration rate of 40km per decade in the Northern Hemisphere (Fig.6B ),exceeding known paleoclimate rates of change.Some species are less mobile than others,and ecosystems involve interactions among species,so such rates of climate change,along with habitat loss and fragmentation,new invasive species,and other stresses are expected to have severe impact on species survival (37).The total distance of isotherm migration,as well as migration rate,affects species survival.Extinction is likely if the migration distance exceeds the size of the natural habitat or remaining habitat fragment.Fig.6shows that the 21st century migration distance for a BAU scenario (Ϸ600km)greatly exceeds the average migration distance for the AS (Ϸ100km).It has been estimated (38)that a BAU global warming of 3°C over the 21st century could eliminate a majority (Ϸ60%)of species on the planet.That projection is not inconsistent with mid-century BAU effects in another study (37)or scenario sensitivity of stress effects (35).Moreover,in the Earth’s history several mass extinc-tions of 50–90%of species have accompanied global temperature changes of Ϸ5°C (39).We infer that even AS climate change,which would slow warming to Ͻ0.1°C per decade over the century,would contribute to species loss that is already occurring due to a variety of stresses.However,species loss under BAU has the potential to be truly disastrous,conceivably with a majority of today’s plants and animals headed toward extermination.DiscussionThe pattern of global warming (Fig.1B )has assumed expected characteristics,with high latitude amplification and larger warming over land than over ocean,as GHGs have become the dominant climate forcing in recent decades.This pattern results mainly from the ice–snow albedo feedback and the response times of ocean andland.Fig.6.Poleward migration rate of isotherms in surface observations (A and B )and in climate model simulations (17)for 2000–2100for Intergovernmental Panel on Climate Change scenario A2(10)and an alternative scenario of forcings that keeps global warming after 2000less than 1°C (17)(C and D ).Numbers in upper right are global means excluding the tropical band.14292͉ ͞cgi ͞doi ͞10.1073͞pnas.0606291103Hansen etal.。
climate_change_全球变暖
Carbon Dioxide
• Carbon dioxide is the most important anthropogenic greenhouse gas.The global atmospheric concentration of carbon dioxide has increased from a pre-industrial value of about 280 ppm to 379 ppm in Radiative Forcing
Method
• Changes in the atmospheric abundance of greenhouse gases and aerosols, in solar radiation and in land surface properties alter the energy balance of the climate system. These changes are expressed in terms of radiative forcing, which is used to compare how a range of human and natural factors drive warming or cooling influences on global climate.
• The combined radiative forcing due to increases in carbon dioxide, methane, and nitrous oxide is +2.30[+2.07 to +2.53]wm-2.
Solar Irradiance
• Changes in solar irradiance since 1750 are estimated to cause a radiative forcing of +0.12 [+0.06 to +0.30]wm-2
气候变化climate_change
(2)Volcanic eruption: when the volcano erupt, it product a lot of sulfide ,like SO2 ,SO3 .These gas cause the acid rain. (3)the influence of Cosmic: It changes the way of making cloud. If the cosmic rays change the routine, the cloud will become less.
human impact and to find ways to adapt to change that has already occurred. Of most concern in these anthropogenic factors is the increase in CO2 levels due to emissions from fossil fuel combustion, followed by aerosols (particulate matter in the atmosphere) and cement manufacture. Other factors, including land use, ozone depletion, animal agriculture and deforestation, are also of concern in the roles they play - both separately and in conjunction with other factors - in affecting climate, microclimate, and measures of climate variables. The mainly greenhouse gas is carbon dioxide.
气候变化英文ppt

Glacier retreat
1875
2004
02
Glaciers and frozen ground are receding
Increased Glacier retreat since the early 1990s
Area of seasonally frozen ground in NH has decreased by 7% from 1901 to 2002
Direct Observations of Recent Climate Change
Some aspects of climate have not been observed to change:
• Tornadoes
• Dust-storms
• Hail
• Lightning • Antarctic sea ice
Observed surface temperature trend
Trends significant at the 5% level indicated with a ‘+’. Grey: insufficient data
Other evidence of Climate Change
01
Observations of climate change
what can you see from the chart?
① Global mean temperatures are rising faster with time ② Warmest 12 years: 1998,2005,2003,2002 ,2004,2006, 2001,1997,1995,1999 ,1990,2000
气候变化climatechange

(2)Volcanic eruption: when the volcano erupt, it product a lot of sulfide ,like SO2 ,SO3 .These gas cause the acid rain.
(3)the influence of Cosmic: It changes the way of making cloud. If the cosmic rays change the routine, the cloud will become less.
(1)Cut trees ,destroy many forest and many grasslands become desert: as many trees were cut, the carbon dioxide can’t be absorbed and the global will become warmer: (2)Freon using and Ozone Depletion: the Freon destroys the ozonosphere. The ozonosphere can reduce solar radiation enter the atmosphere. Now as the ozonosphere is broken, more solar radiation reach earth. (3)The water reducing: water can absorb carbon dioxide. (4)The factory release poison gas to the air: (5)The car release waste gas, like CO2, CO, CH4:
climate_change_全球变暖
2 Human and Natural Drivers of Climate Change
• The understanding of anthropogenic warming and cooling influences on climate has improved since the Third Assessment Report (TAR), leading to very high confidence that the globally averaged net effect of human activities since 1750 has been one of warming, with a radiative forcing of +1.6 [+0.6 to +2.4]wm-2.
Carbon Dioxide
• Carbon dioxide is the most important anthropogenic greenhouse gas.The global atmospheric concentration of carbon dioxide has increased from a pre-industrial value of about 280 ppm to 379 ppm in 2005.
• The combined radiative forcing due to increases in carbon dioxide, methane, and nitrous oxide is +2.30[+2.07 to +2.53]wm-2.
- 1、下载文档前请自行甄别文档内容的完整性,平台不提供额外的编辑、内容补充、找答案等附加服务。
- 2、"仅部分预览"的文档,不可在线预览部分如存在完整性等问题,可反馈申请退款(可完整预览的文档不适用该条件!)。
- 3、如文档侵犯您的权益,请联系客服反馈,我们会尽快为您处理(人工客服工作时间:9:00-18:30)。
55、 为 中 华 之 崛起而 读书。 ——周 恩来
•
29、在一切能够接受法律支配的人类 的状态 中,哪 里没有 法律, 那里就 没有自 由。— —洛克
•
30、风俗可以造就法律,也可以废除 法律。 ——塞·约翰逊
版
ห้องสมุดไป่ตู้ 谢谢!
51、 天 下 之 事 常成 于困约 ,而败 于奢靡 。——陆 游 52、 生 命 不 等 于是呼 吸,生 命是活 动。——卢 梭
气候变化全英文climate-change讲义
•
26、我们像鹰一样,生来就是自由的 ,但是 为了生 存,我 们不得 不为自 己编织 一个笼 子,然 后把自 己关在 里面。 ——博 莱索
•
27、法律如果不讲道理,即使延续时 间再长 ,也还 是没有 制约力 的。— —爱·科 克
•
28、好法律是由坏风俗创造出来的。 ——马 克罗维 乌斯