BeamGage光束质量分析仪使用说明
质量分析仪的详细使用说明书

质量分析仪的详细使用说明书使用说明书一、产品介绍质量分析仪是一种用于检测和分析物质成分及质量的先进仪器。
本使用说明书将详细介绍质量分析仪的操作步骤、注意事项和维护方法,以帮助用户正确、安全地使用该仪器。
二、安全须知1. 在使用质量分析仪前,请仔细阅读并理解本使用说明书,确保了解正确操作方法。
2. 在操作质量分析仪时,请佩戴防护眼镜和手套,确保人身安全。
3. 请不要随意拆卸或修改质量分析仪,以免造成损坏或意外伤害。
4. 在使用质量分析仪时,请注意防止电器短路和火灾等安全风险。
5. 定期检查质量分析仪的电源线,确保其无损坏,以免发生电击或其他安全问题。
三、使用步骤1. 准备工作a. 将质量分析仪放置于平稳的台面上,并确保四周无杂物阻挡。
b. 检查电源线是否完好,正确接入电源插座。
c. 打开质量分析仪,待其预热至工作状态后方可进行下一步操作。
2. 样品准备a. 根据质量分析仪的要求,准备待测试的样品,并确保其质量符合测试标准。
b. 注意避免样品受到外界污染或干扰,可以使用密封容器保存样品。
3. 样品投放a. 打开质量分析仪的样品投放仓门,将待测试样品放入仓内,并确保仓门完全关闭。
b. 按照仪器要求设置相关参数,如样品数量、测试时间等。
4. 开始测试a. 确认样品投放无误后,点击仪器上的开始按钮,启动质量分析仪的测试程序。
b. 观察仪器显示屏上的测试进度和结果,耐心等待测试完成。
5. 测试结果a. 测试完成后,质量分析仪将显示样品的分析结果,可记录或打印该结果。
b. 对于不符合要求的样品,可以进行再次测试或进行进一步的质量调整。
四、维护方法1. 定期进行仪器的清洁和维护,保持仪器的正常运行状态。
2. 避免仪器受到振动或剧烈冲击,防止损坏仪器内部元件。
3. 注意保持质量分析仪的存放环境干燥、通风,并避免灰尘和水分进入仪器。
4. 如发现仪器出现故障或异常情况,请及时关闭电源,并联系售后服务人员进行维修。
五、注意事项1. 请确保在使用质量分析仪前进行必要的培训和学习,了解相关操作要点。
质量光束分析仪的使用
光束质量分析仪的使用一、实验目的1、学会使用光束质量分析仪 BeamScope-P7探头测量激光光束M 22、学会使用激光质量分析仪WinCamD 探头观察和测量激光光斑。
二、实验原理2M 是一个描述激光光束的不完善程度的无量纲参数。
2M 值越小(即光束越接近衍射极限的00TEM 的理想光束),光束就越能够紧聚焦成一个小光斑。
没有激光光束是完全理想的。
由于光学谐振腔、激光介质和输出/辅助光学元件的影响,大多数光束都不是书本上介绍的“理想的”、衍射极限的、高斯截面的单一的00TEM 模式。
复杂的光束可能包含多个xy TEM 模式的贡献,导致了较大的2M 因子,即使是较好的实验室用的He-Ne 激光也有1.1到1.2左右的值,而不是具有理想的00TEM 模式下的1.0的2M 值。
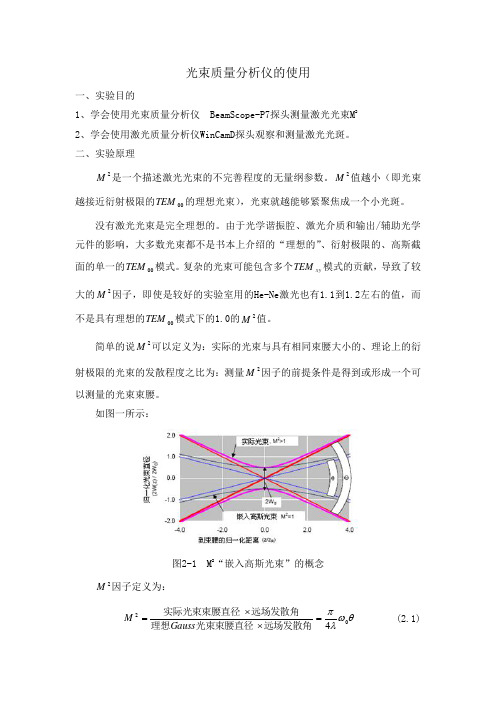
简单的说2M 可以定义为:实际的光束与具有相同束腰大小的、理论上的衍射极限的光束的发散程度之比为:测量2M 因子的前提条件是得到或形成一个可以测量的光束束腰。
如图一所示:图2-1 M 2“嵌入高斯光束”的概念2M 因子定义为:θωλπ024=⨯⨯=远场发散角光束束腰直径理想远场发散角实际光束束腰直径Gauss M (2.1)式中—0W 为实际光束的光腰宽度;—θ为实际光束的远场发散角。
光束质量2M 因子是表征激光束亮度高、空间相干性好的本质参数。
它将光场在空域及频域的分布来表示光束质量2M 因子,即S M σπσ024=,便可知道2M 因子能够反映光场的强度分布与相位分布的特性。
用2M 因子作为评价标准对激光器系统进行质量监控及辅助设计等具有十分重要的意义:(1)2M 因子表示实际光束偏离基模高斯(00TEM ) 光束(衍射极限) 的程度。
(2)2M 因子综合描述了光束的质量,包括光束远场和近场特性。
(3)光束通过理想光学系统后2M 因子不变。
尽管利用2M 因子来评价激光束的质量也有其局限性, 2M 因子仍不失为一种较为完善、合理的光束质量的评价标准。
光束质量分析仪2篇

光束质量分析仪2篇一、光束质量分析仪的原理与应用光束质量分析仪是一种用于测量激光束质量的仪器。
其主要利用了激光束光学传输中的特性,通过对激光束的径迹、焦点大小、峰值功率、模式等进行测量分析,来评估激光束的质量。
光束质量指激光束的横向和纵向斑点大小、斑点大小比、横向和纵向辐射角以及相干度等参数。
光束质量的好坏对激光束在光学系统中的传输效果和加工质量有很大的影响。
因此,光束质量分析仪在激光系统的应用中具有重要的意义。
光束质量分析仪的应用领域非常广泛。
例如,对于激光切割、激光打标和激光熔覆等工艺,光束质量的要求非常高。
使用光束质量分析仪可以有效地检测激光束质量是否满足要求,并对激光系统进行优化,提高工艺精度和质量。
光束质量分析仪的原理是通过将激光束通过透镜组成束线,然后在屏幕上形成一张横向和纵向扫描的光斑,通过测量光斑的大小、焦距和辐射角等参数来推算出光束的质量参数。
光束质量分析仪通过对激光束进行精准的测量和分析,可以提高激光切割、激光打标、激光熔覆等工艺的质量,可以在精确处理材料的同时,提高加工效率和降低成本。
二、光束质量分析仪的分类和特点光束质量分析仪的分类主要有两种:一种是基于CCD相机的光束质量分析仪,另一种是基于夏普-Hartmann传感器的光束质量分析仪。
基于CCD相机的光束质量分析仪主要通过对激光束成像,然后利用CCD相机对成像图像进行处理分析得到光束的质量特性。
具有测量范围大,测量精度高,操作简单等特点。
而基于夏普-Hartmann传感器的光束质量分析仪则是通过对光束的强度分布进行处理,利用夏普-Hartmann传感器实现光束质量参数的测量,具有响应速度快,测量精度高等特点。
光束质量分析仪的特点是具有高精度、高灵敏度、高速度等特点。
使用光束质量分析仪对激光系统进行检测和优化,可以提高工艺精度和加工效率,降低成本。
同时,光束质量分析仪还可以对激光器进行排查和维护,保证激光系统的正常运行。
BeamOn HR Manual
Laser Beam ProfilerUser’s ManualFebruary 2008Rev. 1.2Duma Optronics Ltd.1st Hazait Street, POB 3370Nesher 20306 IsraelTel: 972-4-8200577 Fax: 972-4-8204190www.duma.co.ilContents Page1.0 Introduction (4)2.0 Overview (5)3.0 Theory of Operation (8)4.0 Specifications (9)5.0 Quick Reference (12)6.0 Installation (19)6.1 Hardware Requirements (19)6.2 Software Installation – BeamOn HR USB 2.0 (20)6.3 Hardware Installation – BeamOn HR USB 2.0 Camera (23)6.3.1 Windows XP (23)6.3.2 Windows Vista (28)6.4 Running the Software (32)7.0 Setting Up the BeamOn HR (33)7.1 Configuring the Hardware (33)7.2 Configuring the Software (38)8.0 General description of Software (52)8.1 Viewing Beam Profiles and Width (53)8.2 Viewing the Centroid (54)8.3 Beam Finding Module – Target (55)8.4 Viewing the 2D/3D Presentations (56)8.5 Viewing Power (57)8.6 Viewing Position (58)8.7 Viewing the Beam Peak (60)8.8 Viewing Measurement Data (60)8.9 Saving / Viewing numerical data of profiles (61)8.10 Viewing the Statistics (61)8.11 Freezing Screen Graphics (63)8.12 Printing Screen Displays (63)8.13 Saving Screen Graphics (63)8.14 Working with saved files (64)9.0 Analysis Functions (65)9.1 Test (65)9.2 Calculating a Beam Footprint (66)9.3 Measuring Distances (68)10.0 Saving Data Log files (69)10.1 Setting up the Data Log Function (69)10.2 Start Data Logging (71)10.3 Stop Data Logging (71)10.4 Viewing Data Log Files (71)11.0 Creating / Viewing a video (73)11.1 Initializing the Video parameters (73)11.2 Record a Video file (74)11.3 Stop the Video Recording (74)11.4 Play a Video File (75)12.0 Saving / Viewing Still Images (76)12.1 Capturing a Still Image (76)12.2 Viewing a Still Image (76)12.3 Tile Images (77)12.4 Saving / Closing Still Images (77)13.0 Creating / Viewing Snapshot Files (78)13.1 Creating a Snapshot File (78)13.2 Viewing a Snapshot File (78)13.3 Closing a Snapshot File (78)14.0 RS232 Communication (79)14.1 Setting up for RS232 (79)14.2 Making a Null Modem cable (81)14.3 Starting an RS-232 link Transmission (82)14.4 Terminating an RS232 link Transmission (82)15.0 Troubleshooting (83)15.1 Common operating Problems (83)16.0 Customer Support (85)17.0 Appendix- NG Filters transmission & curves (86)Appendix- ActiveX Software (96)1.0 IntroductionThis manual describes briefly the main capabilities of the BeamOn HR – high resolution Laser Beam Profiler System with 12 bit resolution.The BeamOn HR system is a beam diagnostics measurement system for real-time measurement of CW or Pulsed laser beams. It provides an extensive range of graphical presentations and analysis capabilities of laser beam parameters, such as: beam width, shape, position, power, and intensity profiles.The BeamOn HR is based on a USB 2.0 CCD Camera, software driven device, which can be connected to a Notebook (or Desktop) computer via the High Speed USB 2.0 port.Software version is user-friendly systems that present graphical and numerical information for intuitive interpretation of data in real-time.Some applications for the BeamOn HR system, include:•Laser beam optimization•Quality control•Gaussian fit analysis•Beam alignmentMain Software FeaturesThe BeamOn HR system software features include:•Customer set pass/fail criteria•Zooming•Average•User set threshold levels•Data logging to a text file (up to 99 hours)•Shutter and gain software controllable•Trigger level software controllable for pulsed lasers•Video with playback for future analysis•Tile images in matrix format•Printing of text and pictures•Full on line Help routine2.0 OverviewA basic BeamOn HR system includes the following items:A CCD detector head:BeamOnHR - a camera head for the 350-1310 nm wavelength range. The system comes with a camera, a standard USB 2.0 cable, a post, a set of 3xND-FILT in housing and 1xNG10 filter in housing, power supply 6V DC,software on CD disk, carrying case.Accessories:SAM1 - Beam sampler (ration 3x10(-3))SAM2 - Beam sampler (ration 1x10(-6))RDC - Beam Reducer (ration 2.5x1)MountB - Mounting baseND-FILT - 1/8ND filter, M37x0.75NG-Filters - 1.6mmthick Schott colored filter in mount with adaptor, type: NG10 (optional)Acc-Set – Full set of accessoriesWindows SoftwareThe installation and application software comes on a CD disk. OS supported are Windows XP/Vista.User ManualThe user manual contains the same information as the On-line Help in the software. A README.TXT in the installation disk may have corrections to the manual and the on-line help. The user manual is saved as a PDF file on the software CD.Mounting PostThe post is 105 mm long with 8-32 thread and is used for mounting the detectorhead.QC test and calibration certificate.2.1 Copyright & Manual noticeThis manual describes the operation of the BeamOn HR system. Duma Optronics reserves the right to make changes to this manual and to the equipment described herein without notice. Duma Optronics has made considerable efforts to ensure that the information in this manual is accurate and complete, however will not be liable for any technical or editorial errors or omissions made herein or for any consequential damages of any nature resulting from the furnishing of this manual or operation of equipment in connection with this manual.2.2 Revision HistoryAny new editions of this manual will incorporate all material updated since the previous edition. Update packages issued between editions contain replacement and/or additional pages to be appended to the current edition. A “ReadMe.TXT” file is provided during the installation and may contain additions or corrections to the manual or the help file.The manual printing date indicates its current edition. Updates and corrections to the current edition will be indicated.-May 2007 – Revision 1.0-November 2007 – Revision 1.1-February 2008 – Revision 1.22.3 Warranty StatementDuma Optronics makes no expressed or implied warranties that functions and features of the BeamOn HR will meet the purchaser’s requirements for automated testing and beam diagnostics, or any other application. Duma Optronics does warrant that the hardware be free of defects in materials and workmanship under normal use for a period of 18 months from the date of delivery to the customer and evidenced by a copy of the invoice.2.4 PrecautionsThe BeamOn HR system is a precision instrument and in normal usage will provide years of trouble free operation. However, several precautions must be taken to ensure proper function of the devices.•The instrument must not be subjected to physical abuse. If the detector head is dropped it might be damaged.•Temperature and moisture extremes can also damage the instruments. Make sure there is adequate ventilation for the host computer.•Make sure you have a backup copy for the system CD disk, and that the software CD is protected from long term, direct exposure to sunlight and heat.•When not in use, keep the Detector head and filter wheel inside the carrying case to prevent dust from accumulating on the sensor and the filters.•Filters are provided with each BeamOn HR head. Dust, scratches and other types of contamination will degrade the accuracy of the system. Please keep unused filters in a storage case. Please be gentle when handling these fragile items.•Laser Safety Rules:Please comply with all relevant laser safety procedures and precautions when using this device. The instrument will reflect a portion of the laser light. The resulting diffuse and specular reflections may be dangerous.3.0 Theory of OperationThe main technologies available for laser beam diagnostics are:•Using spatial cameras as the beam characterization system.•Using moving mechanical slit, or knife-edges to scan across the incoming beam. The main advantage of the mechanical scanning devices over a camera type laser beam profiler is the large dynamic range that allows accurate measurements of beams with both high and low intensities. On the other hand, camera type laser beam profilers are excellent for fast and detailed analysis of laser beam intensity profiles, but are limited in their accuracy due to a relatively low dynamic range.The BeamOn HR SolutionThe BeamOn HR overcomes the limited dynamic range of a camera type beam profiler and accurately measures faint laser beam structures by sampling the beam several times. Each measurement is performed at a different attenuation or electronic shutter speed.The BeamOn HR analyzes both continuous wave (CW) and pulsed lasers, and accepts a wide range of input powers.The video beam images are digitized with a 12 or 8-bit resolution (1024 or 256 digital levels) video capture. The digitized beam images are then stored in memory where a variety of analysis can be performed on the stored images. The images are then displayed on the VGA monitor according to the user-selected format.Additional functions provide the ability to print information, transmit data via an RS-232 link to another computer, and control numerous video and calibration functions including shutter speed and camera gain.TechnologyThe BeamOn HR uses a USB 2.0 video camera to image, capture, store, and perform two-dimensional intensity distribution analysis on laser beams.CCD camera laser beam profilers are based on a mosaic of two-dimensional detectors called pixels. The two-dimensional mosaic-like detector instantly records the amount of energy impending on its surface, thus recording the optical pattern of the laser beam. The intensity distribution of the laser beam is recorded pixel-by-pixel and displayed as a two-dimensional topographic map or a three-dimensional isometric view.The advantages of a CCD based laser beam profiler is fully utilized by powerful software that displays any structure larger than one pixel in vivid colors, calculates the beam distribution and profile as well as total beam intensity distribution, in order to allow full analysis of the laser beam’s characteristics.4.0 SpecificationsThis section describes the technical and system performance specifications.Item SpecificationCamera type Monochrome interline transfer 1.4 Megapixel CCD ½” formatSensor active area: 7.6mm wide x 6.2mm high.Pixel size 4.65 µm (H) X 4.65 µm (V)Spectral Response: 350 - 1310nmWeight: 165 gr.Power consumption: 6V, 4 WattsAccessories included: 3X ND 1/8 filter in housing and 1xNG10 in housing, adaptor ring forfilters.One X 8/32 threaded mounting holeTrigger in: Female RCA connector jack 4.5V square wave TTL outputPC interface: High Speed USB 2.0 (480Mbits/sec)RS232: Data outOperating temperature: 0ºc to 50ºcPentium IV, 2.4GHz 512MB RAMMinimum host systemrequirements100MB HDD free64MB 24bit color VGA card, resolution 1024X768One free High Speed USB 2.0 portOne CD ROM any typeWindows XP/VistaCE complianceSystem Performance withSoftware:Dynamic Range: Up to 60dB not including filters.Shutter speeds: 1µs to 0.6 secSoftware controlled gain 1dB to 23dBMaximum frame rate 25HzSensitivity: ~5nW/cm² at 633nm~60µW/mm² at 1310nmSaturation intensity: ~2mW/cm²Damage threshold 50W/cm² with all filters installed.Operation with pulsed laser Ability to capture and replay pictures and statistics from a slowlypulsing laser (1-100Hz) while filtering out frames with no laser pulse. Hardware Triggering In pulsed mode, sliding bar control allows setting of threshold so as todisplay only frames with captured pulses.Figure 1 Camera DimensionsFigure 2 Accessories combinationFigure 3 Full accessories set1-BeamOn HR, 2-MountB, 4-SAM1, 5-SAM2 6-ND-FILT, 7-Adaptor ring, 8-11 – NG filters and adapter, 14-RDC5.0 Quick ReferenceThis chapter provides brief instructions for operating your BeamOn HR. Full explanations of these various operations can be found throughout this manual.To install the BeamOn HR USB 2.0 version:1. Check Hardware Requirements2. Follow Software installation3. Connect the BeamOn HR CCD camera into a Hi-Speed USB 2.0 -compliant port..4. Connect the power supply cable to the BeamOn HR USB 2.0 camera via the 6V jackand plug the power supply into the surge-protector outlet.6. Follow Hardware installation – USB 2.0 CameraTo configure the BeamOn HR hardware and software:1.Open the Settings menu and select Hardware Setup.2.Click each tab and enter your hardware information in each window.3.Repeat steps 1 and 2 for Software Setup.To set up the laser beam mode:1.From Hardware Setup, select either CW or Pulsed.2.If Pulsed is selected, then the icon is displayed at the Control ToolBar. Select ashutter speed that enables an acceptable saturation level.3.If the image is still saturated at the fastest shutter speed, attach ND filters to the CCDcamera until an acceptable saturation level is reached.4.Further adjust the intensity level using the gain control5. Adjust the trigger level using the icon until you get a steady reading.It is best to move to the right until triggering stops, and then move back a little.To measure the beam width:1.Open the Settings menu and select System Setup.2.Select the Profiles tab.3.Set the three clip levels values.4.Read the beam width values from the Meaurement Data box or from Statisticswindow.5.To view more detailed statistics, click to open the statistics window.To select the profile type:On the Control Toolbar, click for Sum Profiles or for Line Profiles.To view the centroid and/or beam peak:1.Click on the Control Toolbar for a 2D display.2.Click on the Control Toolbar to view the centroid.To freeze the screen graphics:Click on the Control Toolbar.To return to real-time measurement mode, click on the Control Toolbar.To print various screens:1.To print the entire screen, open the File menu and select Print Screen.2.To print the view area only, open the File menu and select Print Frame.To save screen graphics:1.Open the Options menu and select Save image File. A sub-menu displays.2.Select the screen section to be saved: Frame, Statistics or Full Screen. The Saveimage File window displays. Select either a BMP or JPG file type.3.Enter a filename for the saved screen graphic and click OK.To save X-Y profiles:1. Open the Options menu and select Save data in text file. A sub-menu displays.2. Select profiles.3.Enter a filename for the saved file and click Save.To view and print a file:1.Click on the Control Toolbar. The View File window displays.2.In the Files of Type field, select the file type for the file you want to view.3.Select the file and click OK.4.Click on print if you want to print the file.To test a laser beam:1.Click on the Control Toolbar. The Analysis Toolbar displays.2.To run the test, click on the Analysis Toolbar. The Test window displays the testresults.3.To save the current test result in a bitmap or test file, click Save in the Test window.To calculate a beam elliptical footprint:1.From the Control Toolbar, click to freeze the screen.2.From the Control Toolbar, click . The Analysis Toolbar displays.3.From the Analysis Toolbar, click . The BeamOn HR calculates the best-fit ellipseand displays it as a dotted white ellipse just around the edges of the measured ellipse.The best-fit ellipse parameters are displayed below the Analysis Toolbar.To measure the distance between two points on the beam image:1.From the Control Toolbar, click to freeze the screen.2.From the Control Toolbar, click . The Analysis Toolbar displays.3.From the Analysis Toolbar, click .4.Select the first point by placing the cursor on the beam image and click the left mousebutton. Drag the mouse to the second point on the beam image and click the left mouse button. A straight line is drawn between these two points and the line distancecalculation is displayed below the Analysis toolbar.To create a data log:1.From the Control Toolbar, click to setup the data log. The Log Setup windowdisplays.2.Enter the information in the Log Setup window and click OK.3.From the Control Toolbar, click to start the data log function.4.To view the data log file, open the File menu and select View File. Select the data logfile you want to view and click Open.To create a video:1.Open the Settings menu and select Video Properties…. The Video Properties windowdisplays.2.Enter your information and click OK.3.Click on the Control Toolbar.To play a video file:1.Click on the Control Toolbar. The Playback Toolbar displays.2.Click on the Playback Toolbar. The Open Video File dialog displays.3.From the Open Video File dialog, select the video file you want to view and click Open.The video file displays.e the Playback Toolbar buttons to play the video.5. Click to close the video file.To work with still images:1.To capture a still image, click on the Control Toolbar.2.To view a single still image, position the cursor on the still image icon at the Status Barand click the left mouse button.3.To close an opened still image click the close button in the upper right corner of theimage window. If you want to save the still image, click Yes in the Still Image window. To measure two beam’s centroids simultaneously:1. From the Control Toolbar, click to select the first Region of Interest.2. Move the small rectangle marking to the first beam presentation on the screen,magnify or shrink it to the proper size by graphical means (using the mouse).3. From the Control Toolbar, click to select the second Region of Interest.4. Move the small rectangle marking to the second beam presentation on the screen,magnify or shrink it to the proper size by graphical means (using the mouse).To work with snapshot files:1.To create a snapshot file, open the Options menu and select Save Snapshot. TheSave Snapshot File window displays. Enter a filename for the snapshot file and click OK.2.To view a snapshot file, open the View menu and select Snapshot. The LoadSnapshot File window displays. Select a snapshot file and click OK. The snapshot file displays. Analyze the measured results by activating the system tools.3.To close a Snapshot file, open the View menu and select Snapshot. The BeamOn HRrestores real-time measurement displays.To transmit serial data over an RS-232 link:1.Open the File menu and select Link Setup.2.Click the General tab and enter your information.3.Select the Port Settings tab, enter your information and click OK.4.Connect the BeamOn HR computer to another computer using a null-modem cable.5.Enable the receiving program to receive the file/data.6.Open the File menu and select Start Link. If you are transmitting data, the BeamOn HRautomatically starts sending the data. A link-in-progress message displays in the menu bar.7.If you are transmitting a file, the Link File window displays. Select the file you want tosend and click OK. A link-in-progress message displays in the menu bar.5.1Software General LayoutThis section covers the basic layout of the BeamOn HR software.The BeamOn HR window display consists of display and control elements similar to most Windows applications along with elements specific to BeamOn HR interface.5.1.1 Title BarThe title bar displays the name “BeamOn HR USB 2.0”, and followed by the CCD detector SN.5.1.2 Menu BarThe Menu Bar lists menus available for BeamOn HR system. The menus contain commands and other sub-menus or dialog boxes to be displayed which provide controls of various functions: graphics, analysis, setup configurations. All functions can be activated via the menus, some functions can also be activated via the Tool Bar.Figure 4 General software layout5.1.3 Control ToolBarThe Tool Bar consists of various icon buttons, which are small symbols that provide quick access alternatives to using menus or keyboard equivalent keys to perform various functions. To activate a tool button, place the mouse over the button and click the Left mouse button. The button will change both color and shadow to designate the fact that this function is activated. This is an example of ToolBar (buttons activated):To view the function of each icon button, place the mouse cursor on the icon and wait momentarily, a brief function description will appear near the icon.5.1.4 View AreaThe View Area is used to view all the BeamOn HR graphical presentations, such as: beam image, intensity profiles, 2D/3D or Position presentation, as well as summary table of measurement results and statistics table.5.1.5 Status BarThe status bar is located at the bottom of the BeamOn HR window. It indicates the current status of some operational parameters, such as presentation of date and time, average level, zooming level, Null status, Power reading, and up to 12 Still images taken. The Status Bar enables a fast access to system’s setup screens for setting up the average level, the zoom, the null parameter as well as the power calibration: if the mouse cursor is placed at one of these parameters and then double-clicked the appropriate setup screen appears.Also. If the mouse cursor is placed at any one of the Still Image icons and double-clicked the image is then magnified.5.1.6 User AreaThe User Area is used to view beam centroid’s presentation, as well as a summary table of measurement data, including the beam width reading at 3 different clip levels and the Gaussian fit profile at these levels as well as the correlation factor.6.0 InstallationThis chapter provides instructions for installing the hardware and software for the BeamOn HR system.6.1 Hardware RequirementsTo run the BeamOn HR USB 2.0 system, the computer system must meet the following minimum requirements:Item Minimum Requirements Recommended Requirements CPU Pentium 4 Pentium 4, 2.4 GHzSystem RAM 128MB RAM 512 MB RAMHard disk 100MB HD freeCD ROM drive Any typeOperating system Windows XP/VistaMouse Microsoft mouse or equivalentVGA display 1024 x 768 resolution 1600 x 1200 resolutionVGA card 16MB 16 bit color 64MB 16 bit colorUSB Port One free High Speed USB 2.06.2 Software InstallationImportant Note: Please install the USB 2.0 camera driver before connecting the BeamOn HR USB 2.0 camera to yourcomputer!Perform Software Installation. Only after you click “Finish” to complete the software installation procedure, continue with the Hardware Installation.1.Insert the BeamOn HR CD disk in the CD drive.- A Welcome screen appears when beginning the software installation routine. Click Next. - Insert your User Name, Company Name and System S/N (appearing on the system CD). - The following screen is a Registration Confirmation. Click Yes in order to confirm. If you click No, the software will return back to a previous prompt.Now provide the full path for installation of the BeamOn HR USB 2.0 system software: More information about the exact folder for the software and branching in existing folder for BeamOn HR USB 2.0 system software can be done in the Select Program Folder prompt. Click the Next button to proceed.- Copying files routine. Click Next button. At this stage the system copies all files from the CD-ROM to the selected directory in your computer. There is a graphical presentation showing the amount of data copied to the system disk. If the Cancel button is pressed the installation is aborted.- For Windows Vista:Figure 5 Windows UpdateFigure 6 Download and Install Updates Press “I Accept” button for install update.Figure 7 Update installation status- Setup Complete.6.3 Hardware Installation BeamOn HR USB 2.0 CameraPlug the BeamOn HR USB 2.0 camera into a Hi-Speed USB 2.0 port.The USB 2.0 device will be detected and the New Hardware Wizard will launch.6.3.1 Windows XP1.The following message is displayedFigure 9 Found new hardware wizardFigure 10 Welcome screen. Press Nextto continue.Figure 11 Alert, press Continue Anyway.Figure 12 Installing…Figure 13 Complete installation screenFigure 14 Press Next to continue.Figure 15 press Continue Anyway.Figure 16 Installing…Figure 17 Complete installation screenFigure 18 New Hardware ready to useAfter completion of USB device installation, when the device is configured successfully one can check under System Properties, Device Manager Tab and see that under imagingdevices the “DO USB 2.0 HR Camera” is listed.Figure 19 Drivers installed list (DO USB 2.0 HR Camera)6.3.2 Windows VistaThe following message is displayedFigure 20 Installing device driver softwareFigure 21 Windows Vista SecurityFigure 22 Windows Vista SecurityFigure 23 Devices are ready to useAfter completion of USB device installation, when the device is configured successfully one can check under System Properties, Device Manager Tab and see that under imaging devices the “DO USB 2.0 Video Device+” is listed.Figure 24 Drivers installed list (DO USB 2.0 HR Camera)6.4 Running the SoftwareMake sure hardware is installed properly. (See Hardware Installation ).Boot the computer.From the Start Menu, select Programs, then choose BeamOn HR USB 2.0 folder, and then click on the BeamOn HR USB 2.0 program. Alternatively, you can activate thesoftware by placing the mouse cursor at the BeamOn HR USB 2.0 Icon and click the mouse button twice.To end a BeamOn HR session, open the File menu and select Exit.The BeamOn HR saves all current setup parameters when you exit a session.Possible Errors that indicate an interface board conflict:There are a few common symptoms, which point to an interface board conflict:* System Lock-up during software startup.* There is no picture displayed on the screen* Displayed measurements are sporadic and erroneous.If your symptoms match one of those presented above, or if the BeamOn HR System was working at one time and has now stopped working, check for conflicts with other devices in the same computer.If it has no affect and no new software of any kind has been installed since the BeamOn HR System last worked and the computer has not been moved, contact Duma Optronics Ltd. for immediate support.More information about Installation problems in the Troubleshooting section.7.0 Setting Up the BeamOn HRThis chapter provides instructions for setting up the BeamOn HR system. Before you can accurately use the BeamOn HR you must do the following:•Configure the hardware•Configure the software•Configure your continuous or pulsed laser beamThe BeamOn HR installs a configuration file called: “BeamOn HR USB 2.0.ini “ in the BeamOn HR USB 2.0 working directory. All system setup parameters are saved in this file, including all setup modifications introduced during the last session. When you start the system software, the setup parameters in the INI file are automatically loaded.7.1 Configuring the HardwareTo configure the hardware, open the Settings menu and select Hardware Setup. The Hardware Setup window displays.7.1.1 Hardware Setup - SettingsFrom the Settings tab, you can configure the following information:•Input connector•Flip FrameFigure 25 Hardware Setup - Settings Tab SelectedTo configure the hardware settings:1.Click the Settings tab.2.Enter your information according to the descriptions below.3.Click OK.。
现场测量仪器使用方法说明书
现场测量仪器使用方法说明书一、引言现场测量仪器是现代工业生产和科学研究中必不可少的工具,它具备高精度、实时性强、易于操作等诸多优点。
为了更好地使用现场测量仪器,本文将详细介绍现场测量仪器的使用方法,包括仪器的基本构造、操作流程、技巧与注意事项。
二、仪器基本构造现场测量仪器主要由以下部分组成:1. 传感器:用于收集被测量对象的信息,并将其转化为信号。
2. 信号处理器:接收传感器的信号,并进行处理和放大。
3. 显示器:用于显示处理后的测量结果。
4. 操作按钮:通过操作按钮调整和设置仪器的参数和功能。
三、操作流程1. 准备工作在使用现场测量仪器前,需要进行以下准备工作:- 确保仪器和传感器处于正常工作状态。
- 安装电池或连接电源,确保电量充足。
- 校准仪器,确保准确度。
2. 确定测量对象和参数根据实际需求和测量对象,确定需要测量的参数,并在仪器上进行相应设置。
3. 放置传感器将传感器正确放置于测量对象上,并确保与对象充分接触,以获得准确的信号。
4. 启动仪器按下启动按钮,仪器开始采集和处理信号。
5. 监测和记录观察显示器上的测量结果,根据需要进行记录和保存。
同时,注意监测仪器是否正常工作,如出现异常,及时进行排查和修复。
6. 停止仪器完成测量后,按下停止按钮,停止采集和处理信号。
7. 清理和存储清理仪器和传感器,妥善存储以防损坏。
四、技巧与注意事项1. 选择适当的传感器和测量范围。
不同的测量对象和参数需要选择不同的传感器和测量范围,确保测量结果的准确性。
2. 注意测量环境和条件。
环境和条件的变化可能会影响测量结果,需注意调整和校准仪器。
3. 阅读和理解仪器说明书。
仔细阅读和理解仪器的说明书,了解仪器的使用限制和操作要点。
4. 定期保养和维护仪器。
定期对仪器进行清洁和检查,及时更换磨损的零部件,以保证仪器的正常工作和延长使用寿命。
5. 遵循操作规程。
严格按照操作规程进行测量,避免操作不当导致的误差和故障。
激光光束分析仪

激光光束分析仪Beam View 激光光束质量诊断系统使⽤⼿册济南福来斯光电技术有限公司Jinan FLS Optoelectronics Technology Co., Ltd.⽬录1 仪器主要功能2 主要技术指标3主要配置4 其它配置5 操作使⽤5.1 设置采集卡5.2 CCD像素尺⼨配置5.3 BEAM VIEW软件功能介绍5.4 练习使⽤5.5菜单5.6、光学暗箱的构成、调节和使⽤6 ⼀般故障处理附录1:⽤Word或Exell格式取出数据附录2:⾼斯拟合附录3:激光光束质量分析概述附录4:衰减部件-固定衰减⽚组和连续衰减器附录5:CCD参数及CCD使⽤注意事项1 仪器主要功能FLBQ红外激光光束质量分析系统能够测量激光光束的⼆维和三维分布(长短轴⼤⼩、光强的空间分布),配合精密刻度导轨能计算出激光光束的1/2发散⾓和1/e2发散⾓。
不仅适⽤于⼩发散⾓(如固体、⽓体激光器等)的测量⽽且适⽤于⼤发散⾓的半导体激光器。
2 主要技术指标a) 测试波长范围:400nm-1550nm;b) 测试激光功率范围:0.01mW~100W (脉冲);c) 最⼤测量光斑直径:60mm;d) 测量暗室采⽤吸光材料,以消除杂光⼲扰;e) 光学元件置于光学精密调节架上,以保证其平稳调节;f) 分辨率:⾼于400万像素;g) 连续模式和脉冲模式;h) 光束⼆维,三维分布图形,伪彩显⽰3主要配置部件名称数量型号或功能描述计算机主机 1 采⽤pc机,P4配置,内置显卡、声卡、预装WinXP操作系统。
显⽰器 1 17吋液晶显⽰器CCD1 1 适合于400-1100nm测试。
暗箱内使⽤。
CCD2 1 适合于1550nm测试。
暗箱内或外使⽤图像采集卡 1 数据采集精密测试道轨 2 ⽤于器件固定与移动⾼级中性滤光⽚ 3 ⽤于衰减⼤功率激光(三⽚,拧到CCD上直接使⽤)。
镜头 1 CCD专⽤(需配合投射屏使⽤)暗室 1 消除杂散光⼲扰1.06um红外激光光源 1 ⽤于系统模拟测量标定⽤1.31um红外激光光源 1 ⽤于系统模拟测量标定⽤1.55um红外激光光源 1 ⽤于系统模拟测量标定⽤4 其它配置部件名称数量型号或功能描述⽯英尖劈分束器及调节架 1 ⽤于激光强度衰减。
多光束干涉仪的操作指南

多光束干涉仪的操作指南干涉现象是光学中的重要现象之一,而多光束干涉仪则是用于研究干涉现象的一种实验设备。
本文将为大家介绍多光束干涉仪的操作指南,帮助读者更好地了解和掌握这一设备的使用。
一、设备介绍多光束干涉仪由多个光源、半透镜、分束器和干涉屏等组成。
其中,光源用于发射光,半透镜用于调整光的角度和形状,分束器可将光分为几束,干涉屏用于观察干涉现象。
二、准备工作在操作多光束干涉仪之前,首先需要对设备进行检查和准备。
1. 确保设备处于稳定的工作环境中,避免外界震动和光线干扰。
2. 检查光源是否正常工作,确保光源亮度和稳定性。
3. 检查干涉屏的清洁度,如有灰尘或污迹应用清洁布轻轻擦拭干净。
三、光束的调整在操作多光束干涉仪时,光束的调整是非常重要的环节,它直接影响到干涉现象的观察和研究结果。
以下是光束调整的步骤:1. 从光源出发,通过半透镜调整光的角度和形状,使其尽可能平行于分束器的表面。
2. 使用适当的装置(如三脚架)使分束器和干涉屏保持固定位置。
3. 使用精密调节器(如移动台)微调分束器和干涉屏的位置,使光束在干涉屏上形成明显的干涉条纹。
4. 如发现干涉条纹不清晰或有偏移,可通过调整半透镜或移动干涉屏等方式进行微调,以获得理想的干涉效果。
四、观察干涉现象当光束调整完成后,即可进行干涉现象的观察。
1. 关闭房间内其他光源,以减少外界光线干扰。
2. 通过干涉屏观察干涉条纹的形状、亮度和间距。
3. 可根据需要调整干涉屏的位置,改变观察角度和距离,以获得更全面的干涉现象观察结果。
4. 使用干涉仪附件和技术装置,如光路延长器、偏振镜、换向器等,可进行更多样化的干涉实验。
五、数据处理和分析在进行干涉实验时,数据处理和分析是必不可少的一步。
以下是常用的数据处理方法:1. 使用适当的测量工具(如游标卡尺、显微镜)测量干涉条纹的间距和亮度值,并记录下来。
2. 根据光程差和干涉条件的理论知识,对实验数据进行分析和计算。
3. 绘制干涉图谱、曲线和图像等,以直观地表达干涉现象和实验结果。
OMEGA DMD-21 单通道可移动 strain gage 测量仪说明书
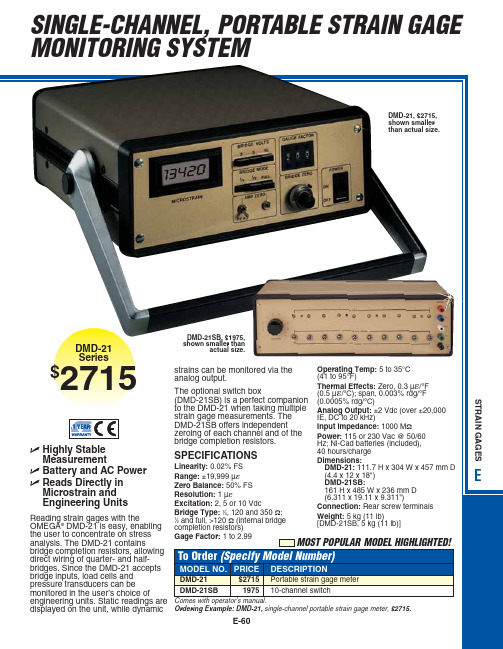
SINGLE-CHANNEL, PORTABLE STRAIN GAGE MONITORING SYSTEMDMD-21SB, $1975,DMD-21, $2715, shown smaller than actual size.CANADA www.omega.ca Laval(Quebec) 1-800-TC-OMEGA UNITED KINGDOM www. Manchester, England0800-488-488GERMANY www.omega.deDeckenpfronn, Germany************FRANCE www.omega.frGuyancourt, France088-466-342BENELUX www.omega.nl Amstelveen, NL 0800-099-33-44UNITED STATES 1-800-TC-OMEGA Stamford, CT.CZECH REPUBLIC www.omegaeng.cz Karviná, Czech Republic596-311-899TemperatureCalibrators, Connectors, General Test and MeasurementInstruments, Glass Bulb Thermometers, Handheld Instruments for Temperature Measurement, Ice Point References,Indicating Labels, Crayons, Cements and Lacquers, Infrared Temperature Measurement Instruments, Recorders Relative Humidity Measurement Instruments, RTD Probes, Elements and Assemblies, Temperature & Process Meters, Timers and Counters, Temperature and Process Controllers and Power Switching Devices, Thermistor Elements, Probes andAssemblies,Thermocouples Thermowells and Head and Well Assemblies, Transmitters, WirePressure, Strain and ForceDisplacement Transducers, Dynamic Measurement Force Sensors, Instrumentation for Pressure and Strain Measurements, Load Cells, Pressure Gauges, PressureReference Section, Pressure Switches, Pressure Transducers, Proximity Transducers, Regulators,Strain Gages, Torque Transducers, ValvespH and ConductivityConductivity Instrumentation, Dissolved OxygenInstrumentation, Environmental Instrumentation, pH Electrodes and Instruments, Water and Soil Analysis InstrumentationHeatersBand Heaters, Cartridge Heaters, Circulation Heaters, Comfort Heaters, Controllers, Meters and SwitchingDevices, Flexible Heaters, General Test and Measurement Instruments, Heater Hook-up Wire, Heating Cable Systems, Immersion Heaters, Process Air and Duct, Heaters, Radiant Heaters, Strip Heaters, Tubular HeatersFlow and LevelAir Velocity Indicators, Doppler Flowmeters, LevelMeasurement, Magnetic Flowmeters, Mass Flowmeters,Pitot Tubes, Pumps, Rotameters, Turbine and Paddle Wheel Flowmeters, Ultrasonic Flowmeters, Valves, Variable Area Flowmeters, Vortex Shedding FlowmetersData AcquisitionAuto-Dialers and Alarm Monitoring Systems, Communication Products and Converters, Data Acquisition and Analysis Software, Data LoggersPlug-in Cards, Signal Conditioners, USB, RS232, RS485 and Parallel Port Data Acquisition Systems, Wireless Transmitters and Receivers。
- 1、下载文档前请自行甄别文档内容的完整性,平台不提供额外的编辑、内容补充、找答案等附加服务。
- 2、"仅部分预览"的文档,不可在线预览部分如存在完整性等问题,可反馈申请退款(可完整预览的文档不适用该条件!)。
- 3、如文档侵犯您的权益,请联系客服反馈,我们会尽快为您处理(人工客服工作时间:9:00-18:30)。
B e a m P r o fi l e3.23.2 Introduction to Camera-Based ProfilersBeam Attenuating AccessoriesA camera-based beam profiler system consists of a camera, profiler software and a beam attenuation accessory. Spiricon offers the broadest range of cameras in the market to cope with wavelengths from 13nm, extreme UV, to 3000 µm, in the long infrared. Both USB and FireWire interfaces are available for most wavelength ranges providing flexibility for either laptop or desktop computers.BeamGage®, the profiling software, comes in three versions: Standard, Professional and Enterprise. Each builds off of the next adding additional capability and flexibility needed for adapting to almost any configuration requirement.Spiricon also has the most extensive array of accessories for beam profiling. There are components for attenuating, filtering, beamsplitting, magnifying, reducing and wavelength conversion. There are components for wavelengths from the deep UV to CO2 wavelengths. Most of the components are modular so they can be mixed and matched with each other to solve almost any beam profiling requirement needed.Acquisition and Analysis SoftwareThe BeamGage software is written specifically for Microsoft Windows operating systems and takes full advantage of the ribbon-base,multi-window environment. The software performs rigorous data analyses on the same parameters, in accordance with the ISO standards, providing quantitative measurement of numerous beam spatial characteristics. Pass/Fail limit analysis for each of these parameters can be also applied.ISO Standard Beam Parameters ֺDslit, Denergy, D4σֺCentroid and Peak location ֺMajor and Minor axes ֺEllipticity, Eccentricity ֺBeam Rotation ֺGaussian FitֺFlat-top analysis / Uniformity ֺDivergence ֺPointing stabilityֺFor data display and visualization, the user can arrange and size multiple windows as required. These may contain, for example, livevideo, 2D Topographic and 3D views, calculated beam parameters and summary statistics in tabular form with Pass/Fail limit analysis, and graphical strip chart time displays with summary statistics and overlays. Custom configured instrument screens with multiple views can be saved as configuration files for repeated use. Data can be exported to spreadsheets, math, process/ instrumentation and statistical analysis programs, and control programs by logging to files or COM ports, or by sharing using LabView or ActiveX Automation.Video Dual Aperture Profiles ֺBeam Statistics ֺ3D Profile Viewֺ2D Topographic View ֺTime Statistics Charts ֺPointing / TargetingֺHide measurements and features not in use for user simplicity ֺNotesֺsoftwarePower Sensor: Optional adjustable ND filters3.2.1.1Measure Your Beam As Never Before:Ultracal: Essential, or no big deal?If you want accurate beam measurements, you want Ultracal.What is Ultracal?Our patented, baseline correction algorithm helped establish the ISO 11146-3 standard for beam measurement accuracy. The problems with cameras used in beam profile measurements are: a) baseline, or zero, of the cameras drift with time temperature, and b) include random noise. Ultracal is the only beam profiler algorithm that sets the baseline to “zero”, and, in the center of the noise. (Competitive products use other less sophisticated algorithms that perform a baseline subtraction, but truncate the noise below the “zero” of the baseline. This leaves only a “positive” component, which adds a net value to all beam measurements).Try the following on any other beam profiler product to see the inherent error if you don’t use Ultracal.Measure a beam with full intensity on the profiler camera.1. Insert a ND2 filter (100X attenuation) into the beam and measure it again.2. Compare the results.3. The Standard Deviation below is about 3%, which is phenomenal compared to the 100% or more of any beam profiler without Ultracal.4. Adding the use of Automatic Aperture improves the accuracy to 1%. (The conditions of this measurement is a camera with a 50dB SNR).You normally don’t make measurements at such a low intensity. But occasionally you may have a drop in intensity of your beam and5. don’t want to have to adjust the attenuation. Or, you may occasionally have a very small beam of only a few tens of pixels. In both ofthese cases, Ultracal becomes essential in obtaining accurate measurements.Beam at full intensity, Width 225µm, Std Dev 0.06µmBeam attenuated 100X (displayed here in 2D at 16X magnitude zoom), Width 231µm, Std Dev 7µmB e a m P r o fi l e3.2.1.1See Your Beam As Never Before:The Graphical User Interface (GUI) of BeamGage is new. Dockable and floatable windows plus concealable ribbon tool bars empowers the BeamGage user to make the most of a small laptop display or a large, multi-monitor desktop PC.Dual or single monitor setup with beam displays on one and results on the other. (Note that results can be magnified large enough to see across the room).3D displays Rotate & Tilt. All displays Pan, Zoom, Translate & Zֺaxis Zoom.Beam only (Note results overlaid on beam profile).Beam plus resultsMultiple beam and results windows.(Note quantified profile results on 3D display & quantified 2D slices).3.2.1.1 3.2.13.2.1.1 BeamGage®-Standard VersionUser selectable for either best “accuracy” or “ease of use” ֺExtensive set of ISO quantitative measurementsֺPatented Ultracal™ algorithm for highest accuracy measurements in the industry ֺAuto-setup and Auto-exposure capabilities for fast set-up and optimized ֺaccuracyStatistical analysis on all calculated results displayed in real time ֺNew BeamMaker® beam simulator for algorithm self-validationֺThe performance of today’s laser systems can strongly affect the success of demanding, modern laser applications.The beam's size, shape, uniformity or approximation to the expected power distribution, as well as its divergence and mode content can make or break an application. Accurate knowledge of these parameters is essential to the success of any laser-based endeavor. As laser applications push the boundaries of laser performance it is becoming more critical to understand the operating criteria.For over thirty years Ophir-Spiricon has developed instruments to accurately measure critical laser parameters. Our LBA and BeamStar software have led the way. Now with the introduction of BeamGage, Ophir-Spiricon offers the first “new from the ground up” beam profile analysis instrument the industry has experienced in over 10 years.BeamGage includes all of the accuracy and ISO approved quantitative results that made our LBA software so successful. BeamGage also brings the ease-of-use that has made our BeamStar software so popular. Our patented UltraCal algorithm, guarantees the data baseline or “zero-reference point” is accurate to 1/10 of a digital count on a pixel-by-pixel basis. ISO 11146 requires that a baseline correction algorithm be used to improve the accuracy of beam width measurements. UltraCal has been enhanced in BeamGage to assure that accurate spatial measurements are now more quickly available.B e a m P r o fi l e3.2.1.1BeamGage Main Display ScreenPass / Fail with Password Protection for Production TestingBeamGage allows the user to configure the displayed calculations; set-up the screen layout and password protect the configurationfrom any changes. This permits secure product testing as well as data collection for Statistical Process Control (SPC), all while assuring the validity of the data.Failures (or successes) can be the impetus for additional actions including a TTL output signal or PC beep and the termination of furtherdata acquisition.File Save/Load ApplicationButtonQuick Access Toolbar for common tasksTabbed ControlAccess2D Beam DisplayTool Windows that dock inside or float outside AppUser Definable Window LayoutIntegrated Help SystemBeam Results With Statistics ISO CompliantResults1D Profiling OptionsEnergy Readouts Processing Status Indicators3D Beam DisplayBuffered Video Scrolling Controls3.2.1.1Multiple Charting OptionsYou can create strip charts for stability observations on practically any of the calculations options available. (See next page for sample listing). Charts enable tracking of short or long term stability of your laser.Beam Pointing StabilityOpen the Pointing Stability Window to collect centroid and peak data from the core system and display it graphically.View a chart recorder and statistical functions in one interface:Strip chart of beam D4sigma width. Note how changing conditions affects the width repeatability.Beam intensity changed over 10db, making noise a significant factor in measurement stability.Peak location scatter plot with histogram color-coding.Set a sample limit, and specify the results items to graph on the strip chart.The radius is referenced from either an Origin established in BeamGage or from the continuously calculated Average Centroid position.A centroid location scatter plot with histogram color-codingA pointing stability strip chart presents data over time for the Centroid X and Y, Peak X and Y and centroid radius from an origin or from the mean centroid.Easy to Use and PowerfulBeamGage is the only beam profiler on the market using modern Windows Vista and Windows 7 navigation tools. The menu system of BeamGage is easy to learn and easy to use with most controls only one mouse click away. Some ribbon toolbar examples:Some of the Beam Display options. (Display access options under the Tools tab on the left).Some of the Beam Capture options.B e a m P r o fi l e3.2.1.1Beam Measurements and StatisticsBeamGage allows you to configure as many measurements as needed to support your work, and comes standard with over 55 separate measurement choices. To distinguish between calculations that are based on ISO standards and those that are not, a graphical ISO logo isdisplayed next to appropriate measurements. You can also choose to perform statistical calculations on any parameter in the list.Small sample of possible measurements out of a list of 55Sample of calculation results with statistics appliedB e a m P r o fi l e3.2.1.1BeamGage Main Display ScreenPass / Fail with Password Protection for Production TestingBeamGage allows the user to configure the displayed calculations; set-up the screen layout and password protect the configurationfrom any changes. This permits secure product testing as well as data collection for Statistical Process Control (SPC), all while assuring the validity of the data.Failures (or successes) can be the impetus for additional actions including a TTL output signal or PC beep and the termination of furtherdata acquisition.File Save/Load ApplicationButtonQuick Access Toolbar for common tasksTabbed ControlAccess2D Beam DisplayTool Windows that dock inside or float outside AppUser Definable Window LayoutIntegrated Help SystemBeam Results With Statistics ISO CompliantResults1D Profiling OptionsEnergy Readouts Processing Status Indicators3D Beam DisplayBuffered Video Scrolling Controls3.2.1.1Multiple Charting OptionsYou can create strip charts for stability observations on practically any of the calculations options available. (See next page for sample listing). Charts enable tracking of short or long term stability of your laser.Beam Pointing StabilityOpen the Pointing Stability Window to collect centroid and peak data from the core system and display it graphically.View a chart recorder and statistical functions in one interface:Strip chart of beam D4sigma width. Note how changing conditions affects the width repeatability.Beam intensity changed over 10db, making noise a significant factor in measurement stability.Peak location scatter plot with histogram color-coding.Set a sample limit, and specify the results items to graph on the strip chart.The radius is referenced from either an Origin established in BeamGage or from the continuously calculated Average Centroid position.A centroid location scatter plot with histogram color-codingA pointing stability strip chart presents data over time for the Centroid X and Y, Peak X and Y and centroid radius from an origin or from the mean centroid.Easy to Use and PowerfulBeamGage is the only beam profiler on the market using modern Windows Vista and Windows 7 navigation tools. The menu system of BeamGage is easy to learn and easy to use with most controls only one mouse click away. Some ribbon toolbar examples:Some of the Beam Display options. (Display access options under the Tools tab on the left).Some of the Beam Capture options.。