张元萍主编投资学课后习题答案
投资学课后习题答案

第一章1. 答:交易机制指市场的交易规则和保证规则实施的技术以及规则和技术对定价机制的影响。
它的主要研究内容包括:从市场微观结构的角度去看,价格是在什么样的规则和程序中形成的,并分析交易机制对资产交易的过程和结果的影响。
2. 答:报价驱动机制与指令驱动机制的区别在于:①价格形成方式不同。
在采用做市商制度的市场上,证券的开盘价格和随后的交易价格是由做市商报出的,而指令驱动制度的开盘价与随后的交易价格都是竞价形成的。
前者从交易系统外部输入价格,后者的成交价格是在交易系统内部生成的。
②信息传递范围与速度不同。
采用做市商机制,投资者买卖指令首先报给做市商,做市商是唯一全面及时知晓买卖信息的交易商,成交量与成交价随后才会传递给整个市场。
在指令驱动机制中,买卖指令、成交量与成交价几乎同步传递给整个市场。
③交易量与价格维护机制不同。
在报价驱动机制中,做市商有义务维护交易量与交易价格。
而指令驱动机制则不存在交易量与交易价格的维护机制。
④处理大额买卖指令的能力不同。
做市商报价驱动机制能够有效处理大额买卖指令。
而在指令驱动机制中,大额买卖指令要等待交易对手的买卖盘,完成交易常常要等待较长时间。
其它交易机制还包括混合交易机制、特殊会员制度等。
3. 答:一般来说,做市商市场的流动性要高于竞价市场,即投资者在竞价市场所面临的执行风险要大于做市商市场。
但是,竞价市场的透明度要好于做市商市场,同时,做市商市场的平均交易成本要高于竞价市场。
竞价市场的优点:①透明度高。
在指令驱动制度中,买卖盘信息、成交量与成交价格信息等及时对整个市场发布,投资者几乎可以同步了解到交易信息。
透明度高,有利于投资者观察市场。
②信息传递速度快、范围广。
指令驱动制度几乎可以实现交易信息同步传递,整个市场可以同时分享交易信息,很难发生交易信息垄断。
③运行费用较低。
投资者买卖指令竞价成交,交易价格在系统内部生成,系统本身表现出自运行特征。
这种指令驱动系统,在处理大量小额交易指令方面,优越性较明显。
投资学(第四版)习题及参考答案

投资学(第四版)习题及参考答案第一章1.询问你身边的人,他们是否有投资的经历?如果有,根据你的理解判断他们的投资行为属于实物投资还是金融投资。
然后,进一步询问他们进行投资的目的是什么,并进行归类。
参考答案:投资是指人们为了得到一定的未来收益或实现一定的预期目标,而将一定的价值或资本投入到经济运动过程中的行为。
按照投入资金所增加的资产种类,投资可以分为实物投资和金融投资。
正如实物资产与金融资产的区别一样,实物投资形成现实的固定资产或流动资产,会直接引起实物资产的增加;而金融投资主要体现为一种财务关系,货币资金转化为金融资产,并没有实物资产的增加。
总体而言,人们进行投资主要考虑以下三个基本需求:(1)获得收入。
希望通过投资,在未来获得一系列收入。
(2)资本保值,即为了保持原始价值而进行的投资。
投资者通过一些保守的投资方式,使资金在未来某一时点上可以获得,并且没有购买力的损失。
保值是指真实购买力的价值被保值,所以名义价值的增长率应该趋同于通货膨胀率。
(3)资本增值。
投资者通过投资可以实现资金升值、价值增长的目标。
为实现这一目标,投资的货币价值增长率应该高于通货膨胀率,在扣除了税收和通货膨胀等因素后,真实的收益率应该为正。
2.查阅相关金融词典和汉语词典,找出这些词典对“投机”一词的解释,再翻看相关的英文词典,查看其对speculation的解释,仔细体会中文词典与英文词典解释的区别。
参考答案:一般认为,“投机”一词具有贬义性质,最常用到的关于投机的词组就是“投机倒把”和“投机分子”。
在这两个词组中,投机很自然地与“违法”“违规”联系起来,这是在我国传统商业背景下投机被赋予的特定含义。
例如,1987年国务院颁布的《投机倒把行政处罚暂行条例》就明确规定:以牟取非法利润为目的,违反国家法规和政策,扰乱社会主义经济秩序的11种行为属于投机倒把行为。
可见,在我国传统商业背景下,投机已不是字面上的“迎合时机”的意思,而成了“市场操纵”“违法违规”的代名词。
投资学第10版课后习题答案
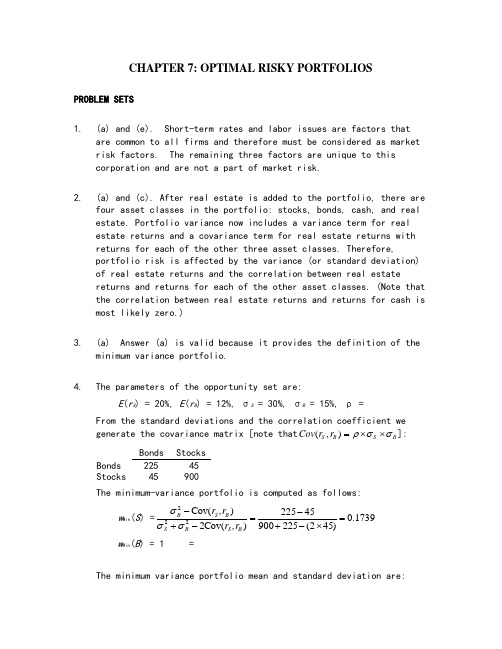
CHAPTER 7: OPTIMAL RISKY PORTFOLIOSPROBLEM SETS1. (a) and (e). Short-term rates and labor issues are factors thatare common to all firms and therefore must be considered as market risk factors. The remaining three factors are unique to this corporation and are not a part of market risk.2. (a) and (c). After real estate is added to the portfolio, there arefour asset classes in the portfolio: stocks, bonds, cash, and real estate. Portfolio variance now includes a variance term for real estate returns and a covariance term for real estate returns with returns for each of the other three asset classes. Therefore,portfolio risk is affected by the variance (or standard deviation) of real estate returns and the correlation between real estatereturns and returns for each of the other asset classes. (Note that the correlation between real estate returns and returns for cash is most likely zero.)3. (a) Answer (a) is valid because it provides the definition of theminimum variance portfolio.4. The parameters of the opportunity set are:E (r S ) = 20%, E (r B ) = 12%, σS = 30%, σB = 15%, ρ =From the standard deviations and the correlation coefficient we generate the covariance matrix [note that (,)S B S B Cov r r ρσσ=⨯⨯]: Bonds Stocks Bonds 225 45 Stocks 45 900The minimum-variance portfolio is computed as follows:w Min (S ) =1739.0)452(22590045225)(Cov 2)(Cov 222=⨯-+-=-+-B S B S B S B ,r r ,r r σσσ w Min (B ) = 1 =The minimum variance portfolio mean and standard deviation are:E (r Min ) = × .20) + × .12) = .1339 = %σMin = 2/12222)],(Cov 2[B S B S B B S Sr r w w w w ++σσ = [ 900) + 225) + (2 45)]1/2= %5.Proportion in Stock Fund Proportionin Bond Fund ExpectedReturnStandard Deviation% % % %minimumtangencyGraph shown below.0.005.0010.0015.0020.0025.000.00 5.00 10.00 15.00 20.00 25.00 30.00Tangency PortfolioMinimum Variance PortfolioEfficient frontier of risky assetsCMLINVESTMENT OPPORTUNITY SETr f = 8.006. The above graph indicates that the optimal portfolio is thetangency portfolio with expected return approximately % andstandard deviation approximately %.7. The proportion of the optimal risky portfolio invested in the stockfund is given by:222[()][()](,)[()][()][()()](,)S f B B f S B S S f B B f SS f B f S B E r r E r r Cov r r w E r r E r r E r r E r r Cov r r σσσ-⨯--⨯=-⨯+-⨯--+-⨯[(.20.08)225][(.12.08)45]0.4516[(.20.08)225][(.12.08)900][(.20.08.12.08)45]-⨯--⨯==-⨯+-⨯--+-⨯10.45160.5484B w =-=The mean and standard deviation of the optimal risky portfolio are:E (r P ) = × .20) + × .12) = .1561 = % σp = [ 900) +225) + (2× 45)]1/2= %8. The reward-to-volatility ratio of the optimal CAL is:().1561.080.4601.1654p fpE r r σ--==9. a. If you require that your portfolio yield an expected return of14%, then you can find the corresponding standard deviation from the optimal CAL. The equation for this CAL is:()().080.4601p fC f C C PE r r E r r σσσ-=+=+If E (r C ) is equal to 14%, then the standard deviation of the portfolio is %.b. To find the proportion invested in the T-bill fund, rememberthat the mean of the complete portfolio ., 14%) is an average of the T-bill rate and the optimal combination of stocks and bonds (P ). Let y be the proportion invested in the portfolio P . The mean of any portfolio along the optimal CAL is:()(1)()[()].08(.1561.08)C f P f P f E r y r y E r r y E r r y =-⨯+⨯=+⨯-=+⨯-Setting E (r C ) = 14% we find: y = and (1 − y ) = (the proportion invested in the T-bill fund).To find the proportions invested in each of the funds, multiply times the respective proportions of stocks and bonds in the optimal risky portfolio:Proportion of stocks in complete portfolio = =Proportion of bonds in complete portfolio = =10. Using only the stock and bond funds to achieve a portfolio expectedreturn of 14%, we must find the appropriate proportion in the stock fund (w S) and the appropriate proportion in the bond fund (w B = 1 −w S) as follows:= × w S + × (1 −w S) = + × w S w S =So the proportions are 25% invested in the stock fund and 75% inthe bond fund. The standard deviation of this portfolio will be:σP = [ 900) + 225) + (2 45)]1/2 = %This is considerably greater than the standard deviation of %achieved using T-bills and the optimal portfolio.11. a.Even though it seems that gold is dominated by stocks, gold mightstill be an attractive asset to hold as a part of a portfolio. Ifthe correlation between gold and stocks is sufficiently low, goldwill be held as a component in a portfolio, specifically, theoptimal tangency portfolio.b.If the correlation between gold and stocks equals +1, then no onewould hold gold. The optimal CAL would be composed of bills andstocks only. Since the set of risk/return combinations of stocksand gold would plot as a straight line with a negative slope (seethe following graph), these combinations would be dominated bythe stock portfolio. Of course, this situation could not persist.If no one desired gold, its price would fall and its expectedrate of return would increase until it became sufficientlyattractive to include in a portfolio.12. Since Stock A and Stock B are perfectly negatively correlated, arisk-free portfolio can be created and the rate of return for thisportfolio, in equilibrium, will be the risk-free rate. To find theproportions of this portfolio [with the proportion w A invested inStock A and w B = (1 –w A) invested in Stock B], set the standarddeviation equal to zero. With perfect negative correlation, theportfolio standard deviation is:σP = Absolute value [w AσA w BσB]0 = 5 × w A− [10 (1 –w A)] w A =The expected rate of return for this risk-free portfolio is:E(r) = × 10) + × 15) = %Therefore, the risk-free rate is: %13. False. If the borrowing and lending rates are not identical, then,depending on the tastes of the individuals (that is, the shape oftheir indifference curves), borrowers and lenders could havedifferent optimal risky portfolios.14. False. The portfolio standard deviation equals the weighted averageof the component-asset standard deviations only in the special case that all assets are perfectly positively correlated. Otherwise, as the formula for portfolio standard deviation shows, the portfoliostandard deviation is less than the weighted average of thecomponent-asset standard deviations. The portfolio variance is aweighted sum of the elements in the covariance matrix, with theproducts of the portfolio proportions as weights.15. The probability distribution is:Probability Rate ofReturn100%−50Mean = [ × 100%] + [ × (-50%)] = 55%Variance = [ × (100 − 55)2] + [ × (-50 − 55)2] = 4725Standard deviation = 47251/2 = %16. σP = 30 = y× σ = 40 × y y =E(r P) = 12 + (30 − 12) = %17. The correct choice is (c). Intuitively, we note that since allstocks have the same expected rate of return and standard deviation, we choose the stock that will result in lowest risk. This is thestock that has the lowest correlation with Stock A.More formally, we note that when all stocks have the same expected rate of return, the optimal portfolio for any risk-averse investor is the global minimum variance portfolio (G). When the portfolio is restricted to Stock A and one additional stock, the objective is to find G for any pair that includes Stock A, and then select thecombination with the lowest variance. With two stocks, I and J, theformula for the weights in G is:)(1)(),(Cov 2),(Cov )(222I w J w r r r r I w Min Min J I J I J I J Min -=-+-=σσσSince all standard deviations are equal to 20%:(,)400and ()()0.5I J I J Min Min Cov r r w I w J ρσσρ====This intuitive result is an implication of a property of any efficient frontier, namely, that the covariances of the global minimum variance portfolio with all other assets on the frontier are identical and equal to its own variance. (Otherwise, additional diversification would further reduce the variance.) In this case, the standard deviation of G(I, J) reduces to:1/2()[200(1)]Min IJ G σρ=⨯+This leads to the intuitive result that the desired addition would be the stock with the lowest correlation with Stock A, which is Stock D. The optimal portfolio is equally invested in Stock A and Stock D, and the standard deviation is %.18. No, the answer to Problem 17 would not change, at least as long asinvestors are not risk lovers. Risk neutral investors would not care which portfolio they held since all portfolios have an expected return of 8%.19. Yes, the answers to Problems 17 and 18 would change. The efficientfrontier of risky assets is horizontal at 8%, so the optimal CAL runs from the risk-free rate through G. This implies risk-averse investors will just hold Treasury bills.20. Rearrange the table (converting rows to columns) and compute serialcorrelation results in the following table:Nominal RatesFor example: to compute serial correlation in decade nominalreturns for large-company stocks, we set up the following twocolumns in an Excel spreadsheet. Then, use the Excel function“CORREL” to calculate the correlation for the data.Decade Previous1930s%%1940s%%1950s%%1960s%%1970s%%1980s%%1990s%%Note that each correlation is based on only seven observations, so we cannot arrive at any statistically significant conclusions.Looking at the results, however, it appears that, with theexception of large-company stocks, there is persistent serialcorrelation. (This conclusion changes when we turn to real rates in the next problem.)21. The table for real rates (using the approximation of subtracting adecade’s average inflation from the decade’s average nominalreturn) is:Real RatesSmall Company StocksLarge Company StocksLong-TermGovernmentBondsIntermed-TermGovernmentBondsTreasuryBills 1920s1930s1940s1950s1960s1970s1980s1990sSerialCorrelationWhile the serial correlation in decade nominal returns seems to be positive, it appears that real rates are serially uncorrelated. The decade time series (although again too short for any definitiveconclusions) suggest that real rates of return are independent from decade to decade.22. The 3-year risk premium for the S&P portfolio is, the 3-year risk premium for thehedge fund portfolio is S&P 3-year standard deviation is 0. The hedge fund 3-year standard deviation is 0. S&P Sharpe ratio is = , and the hedge fund Sharpe ratio is = .23. With a ρ = 0, the optimal asset allocation is,.With these weights,EThe resulting Sharpe ratio is = . Greta has a risk aversion of A=3, Therefore, she will investyof her wealth in this risky portfolio. The resulting investment composition will be S&P: = % and Hedge: = %. The remaining 26% will be invested in the risk-free asset.24. With ρ = , the annual covariance is .25. S&P 3-year standard deviation is . The hedge fund 3-year standard deviation is . Therefore, the 3-year covariance is 0.26. With a ρ=.3, the optimal asset allocation is, .With these weights,E. The resulting Sharpe ratio is = . Notice that the higher covariance results in a poorer Sharpe ratio.Greta will investyof her wealth in this risky portfolio. The resulting investment composition will be S&P: =% and hedge: = %. The remaining % will be invested in the risk-free asset.CFA PROBLEMS1. a. Restricting the portfolio to 20 stocks, rather than 40 to 50stocks, will increase the risk of the portfolio, but it ispossible that the increase in risk will be minimal. Suppose that, for instance, the 50 stocks in a universe have the same standard deviation () and the correlations between each pair areidentical, with correlation coefficient ρ. Then, the covariance between each pair of stocks would be ρσ2, and the variance of an equally weighted portfolio would be:222ρσ1σ1σnn n P -+=The effect of the reduction in n on the second term on theright-hand side would be relatively small (since 49/50 is close to 19/20 and ρσ2 is smaller than σ2), but thedenominator of the first term would be 20 instead of 50. For example, if σ = 45% and ρ = , then the standard deviation with 50 stocks would be %, and would rise to % when only 20 stocks are held. Such an increase might be acceptable if the expected return is increased sufficiently.b. Hennessy could contain the increase in risk by making sure thathe maintains reasonable diversification among the 20 stocks that remain in his portfolio. This entails maintaining a low correlation among the remaining stocks. For example, in part (a), with ρ = , the increase in portfolio risk was minimal. As a practical matter, this means that Hennessy would have to spread his portfolio among many industries; concentrating on just a few industries would result in higher correlations among the included stocks.2. Risk reduction benefits from diversification are not a linearfunction of the number of issues in the portfolio. Rather, the incremental benefits from additional diversification are mostimportant when you are least diversified. Restricting Hennessy to 10 instead of 20 issues would increase the risk of his portfolio by a greater amount than would a reduction in the size of theportfolio from 30 to 20 stocks. In our example, restricting the number of stocks to 10 will increase the standard deviation to %. The % increase in standard deviation resulting from giving up 10 of20 stocks is greater than the % increase that results from givingup 30 of 50 stocks.3. The point is well taken because the committee should be concernedwith the volatility of the entire portfolio. Since Hennessy’sportfolio is only one of six well-diversified portfolios and issmaller than the average, the concentration in fewer issues mighthave a minimal effect on the diversification of the total fund.Hence, unleashing Hennessy to do stock picking may be advantageous.4. d. Portfolio Y cannot be efficient because it is dominated byanother portfolio. For example, Portfolio X has both higherexpected return and lower standard deviation.5. c.6. d.7. b.8. a.9. c.10. Since we do not have any information about expected returns, wefocus exclusively on reducing variability. Stocks A and C have equal standard deviations, but the correlation of Stock B with Stock C is less than that of Stock A with Stock B . Therefore, a portfoliocomposed of Stocks B and C will have lower total risk than aportfolio composed of Stocks A and B.11. Fund D represents the single best addition to complementStephenson's current portfolio, given his selection criteria. Fund D’s expected return percent) has the potential to increase theportfolio’s return somewhat. Fund D’s relatively low correlation with his current portfolio (+ indicates that Fund D will providegreater diversification benefits than any of the other alternativesexcept Fund B. The result of adding Fund D should be a portfolio with approximately the same expected return and somewhat lower volatility compared to the original portfolio.The other three funds have shortcomings in terms of expected return enhancement or volatility reduction through diversification. Fund A offers the potential for increasing the portfolio’s return but is too highly correlated to provide substantial volatility reduction benefits through diversification. Fund B provides substantial volatility reduction through diversification benefits but is expected to generate a return well below the current portfolio’s return. Fund C has the greatest potential to increase the portfolio’s return but is too highly correlated with the current portfolio to provide substantial volatility reduction benefits through diversification.12. a. Subscript OP refers to the original portfolio, ABC to thenew stock, and NP to the new portfolio.i. E(r NP) = w OP E(r OP) + w ABC E(r ABC) = + = %ii. Cov = ρOP ABC = =iii. NP = [w OP2OP2 + w ABC2ABC2 + 2 w OP w ABC(Cov OP , ABC)]1/2= [ 2 + + (2 ]1/2= % %b. Subscript OP refers to the original portfolio, GS to governmentsecurities, and NP to the new portfolio.i. E(r NP) = w OP E(r OP) + w GS E(r GS) = + = %ii. Cov = ρOP GS = 0 0 = 0iii. NP = [w OP2OP2 + w GS2GS2 + 2 w OP w GS (Cov OP , GS)]1/2= [ + 0) + (2 0)]1/2= % %c. Adding the risk-free government securities would result in alower beta for the new portfolio. The new portfolio beta will bea weighted average of the individual security betas in theportfolio; the presence of the risk-free securities would lowerthat weighted average.d. The comment is not correct. Although the respective standarddeviations and expected returns for the two securities underconsideration are equal, the covariances between each security andthe original portfolio are unknown, making it impossible to drawthe conclusion stated. For instance, if the covariances aredifferent, selecting one security over the other may result in alower standard deviation for the portfolio as a whole. In such acase, that security would be the preferred investment, assumingall other factors are equal.e. i. Grace clearly expressed the sentiment that the risk of losswas more important to her than the opportunity for return. Usingvariance (or standard deviation) as a measure of risk in her casehas a serious limitation because standard deviation does notdistinguish between positive and negative price movements.ii. Two alternative risk measures that could be used instead ofvariance are:Range of returns, which considers the highest and lowestexpected returns in the future period, with a larger rangebeing a sign of greater variability and therefore of greaterrisk.Semivariance can be used to measure expected deviations ofreturns below the mean, or some other benchmark, such as zero.Either of these measures would potentially be superior tovariance for Grace. Range of returns would help to highlightthe full spectrum of risk she is assuming, especially thedownside portion of the range about which she is so concerned.Semivariance would also be effective, because it implicitlyassumes that the investor wants to minimize the likelihood ofreturns falling below some target rate; in Grace’s case, thetarget rate would be set at zero (to protect against negativereturns).13. a. Systematic risk refers to fluctuations in asset prices causedby macroeconomic factors that are common to all risky assets;hence systematic risk is often referred to as market risk.Examples of systematic risk factors include the business cycle,inflation, monetary policy, fiscal policy, and technologicalchanges.Firm-specific risk refers to fluctuations in asset pricescaused by factors that are independent of the market, such asindustry characteristics or firm characteristics. Examples offirm-specific risk factors include litigation, patents,management, operating cash flow changes, and financial leverage.b. Trudy should explain to the client that picking only the topfive best ideas would most likely result in the client holdinga much more risky portfolio. The total risk of a portfolio, orportfolio variance, is the combination of systematic risk andfirm-specific risk.The systematic component depends on the sensitivity of theindividual assets to market movements as measured by beta.Assuming the portfolio is well diversified, the number ofassets will not affect the systematic risk component ofportfolio variance. The portfolio beta depends on theindividual security betas and the portfolio weights of those securities.On the other hand, the components of firm-specific risk (sometimes called nonsystematic risk) are not perfectly positively correlated with each other and, as more assets are added to the portfolio, those additional assets tend to reduce portfolio risk. Hence, increasing the number of securities in a portfolio reduces firm-specific risk. For example, a patent expiration for one company would not affect the othersecurities in the portfolio. An increase in oil prices islikely to cause a drop in the price of an airline stock butwill likely result in an increase in the price of an energy stock. As the number of randomly selected securities increases, the total risk (variance) of the portfolio approaches its systematic variance.。
投资学第13章课后习题及答案

投资学第13章课后习题及答案第13章本章习题1.如何理解技术分析的三大假设?2.技术分析具有哪些原则?在应用过程总应注意哪些问题?3.运用K线理论应该注意哪些问题?4.道氏理论的主要思想是什么?5.应用技术分析的法则有哪些?6.移动平均线的作用是什么?7.何谓技术指标与价格的背离?应该如何使用?参考答案:1.(1)假设一有其合理性的一面。
我们知道,影响证券价格的变动有很多方面的因素,包括宏观面、政策面、市场面、资金面、心理面等,但任何一个因素对证券市场的影响最终都必然体现在证券价格的变动上。
但是我们也应该看到,在这一假设的前提基础上,投资者在市场上获得的信息是公开的,且所有投资者所获得的信息都是一致的,即市场是有效的。
因为市场的有效性,加上投资者对市场信息的反馈及时准确,使得证券价格能够完全将市场信息加以消化,最终体现在证券价格上。
但是市场行为反映的信息只体现在股票价格的变动之中,同原始的信息毕竟有差异,损失信息是必然的。
正因为如此,在进行技术分析的同时,还应该适当进行一些基本分析和别的方面的分析,以弥补其不足。
(2)第二个理论假设结论在趋势论者看来是天经地义,完全可信的。
因为投资人之所以要卖掉手中的股票,是因为他认为目前的价格已经到顶,马上将往下跌,或者即使上涨,涨的幅度也有限,不会太多了。
他的这种悲观的观点是不会立刻改变的。
但是,随机漫步论者认为证券价格的形成是随机的,其价格变动并无趋势可言,当证券市场受到外来冲击时,这种预期就会发生变化,使得未来价格的变化表现出无规律的现象。
(3)第三个假设看似合理,且在一定程度上也反映了证券投资市场上的真实情形。
因为股票市场的某个市场行为留在投资人头脑中的阴影和快乐是会永远影响股票投资人的。
在进行技术分析时,一旦遇到与过去某一时期相同或相似的情况,应该与过去的结果比较。
过去的结果是已知的,这个已知的结果应该是现在对未来作预测的参考。
但是,股票市场的市场行为是干变万化的,不可能有完全相同的情况重复出现,差异总是或多或少存在。
《投资学(第6版)》课后习题参考解答.docx

第一章一、单项选择题1.下列选项中,()不是投资的特点。
A.投资通常是刚性兑付B.投资的复杂性和系统性C.投资周期相对较长D.投资项目实施的连续性和资金投入的波动性E.投资金融答案:A。
应为"投资具有风险性”。
2.下列选项中,()不是投资对经济增长的影响或作用的表现。
A.从资源配置角度看,投资影响经济结构,从而促进经济增长B.国民收入水平下降的年份,年度投资规模也相应减少,以保证人民生活水平改善的步伐C.从要素投入角度看,投资供给对经济增长有推动作用,增加生产资料供给,为扩大再生产提供物质条件D.从要素投入角度看,投资需求对经济增长有拉动作用,增加一笔投资会带来大于这笔投资额数倍的国民收入增加答案:B。
B为投资的特点之三。
年度投资规模的增长具有波动性。
年度投资规模与国民经济形势和国民收入多少密切相关。
二、多项选择题1.投资的要素包括()。
A.投资主体B.投资客体C.投资目的D.投资方式E.投资金额答案:ABCD。
2.投资学的研究方法包括()。
A.理论与实践相结合B.实证分析与规范分析相结合C.历史分析与比较分析相结合D.系统分析与定量分析相结合E.静态分析与动态分析相结合答案:ABCDE。
三、判断题1.从1992年开始,尽管我国经济体制改革不断深入,但社会各界对投资概念、投资范围的认识并未变化,投资只包括直接投资,即将资金直接投入建设项目形成固定资产和流动资产。
()答案:错。
解释:投资概念、投资范围的认识也不断深化,投资包括直接投资也包括间接投资,即购买有价证券,形成金融资产。
2.无论哪一种方式的金融投资,都是货币资金转化为金融资产,没有直接实现实物资产的增加。
现实生活中实物投资与金融投资具有相互依存和相互促进的关系,金融投资以实物投资为基础,除了某些特殊的金融投资外,并不转化为实物投资。
()答案:对。
3.尽管社会主义市场经济不断发展与完善,但我国原有的以国家投资为主的投融资格局仍未被打破。
投资学第10版习题答案06分析解析讲课教案
投资学第10版习题答案06分析解析讲课教案投资学第10版习题答案06分析解析CHAPTER 6: CAPITAL ALLOCATION TO RISKY ASSETSPROBLEM SETS1. (e) The first two answer choices are incorrect because a highly risk averse investorwould avoid portfolios with higher risk premiums and higher standard deviations.In addition, higher or lower Sharpe ratios are not an indication of an investor'stolerance for risk. The Sharpe ratio is simply a tool to absolutely measure the return premium earned per unit of risk.2. (b) A higher borrowing rate is a consequence of the risk of the borrowers’ default.In perfect markets with no additional cost of default, this increment would equal the value of the borrower’s option to default, and the Sharpe measure, with appropriate treatment of the default option, would be the same. However, in reality there arecosts to default so that this part of the increment lowers the Sharpe ratio. Also,notice that answer (c) is not correct because doubling the expected return with afixed risk-free rate will more than double the risk premium and the Sharpe ratio. 3. Assuming no change in risk tolerance, that is, an unchanged risk-aversioncoefficient (A), higher perceived volatility increases the denominator of theequation for the optimal investment in the risky portfolio (Equation 6.7). Theproportion invested in the risky portfolio will therefore decrease.4. a. The expected cash flow is: (0.5 × $70,000) + (0.5 × 200,000) = $135,000.With a risk premium of 8% over the risk-free rate of 6%, the required rate ofreturn is 14%. Therefore, the present value of the portfolio is:$135,000/1.14 = $118,421b. If the portfolio is purchased for $118,421 and provides an expected cashinflow of $135,000, then the expected rate of return [E(r)] is as follows:$118,421 × [1 + E(r)] = $135,000Therefore, E(r) =14%. The portfolio price is set to equate the expected rate ofreturn with the required rate of return.c. If the risk premium over T-bills is now 12%, then the required return is:6% + 12% = 18%The present value of the portfolio is now:$135,000/1.18 = $114,407d. For a given expected cash flow, portfolios that command greater riskpremiums must sell at lower prices. The extra discount from expectedvalue is a penalty for risk.5.When we specify utility by U = E(r) – 0.5Aσ2, the utility level for T-bills is: 0.07The utility level for the risky portfolio is:U = 0.12 – 0.5 ×A × (0.18)2 = 0.12 – 0.0162 ×AIn order for the risky portfolio to be preferred to bills, the following must hold:0.12 – 0.0162A > 0.07 ?A < 0.05/0.0162 = 3.09A must be less than 3.09 for the risky portfolio to be preferred to bills.6. Points on the curve are derived by solving for E(r) in the following equation:U = 0.05 = E(r) – 0.5Aσ2 = E(r) – 1.5σ2The values of E(r), given the values of σ2, are therefore:σσ 2E(r)0.00 0.0000 0.050000.05 0.0025 0.053750.10 0.0100 0.065000.15 0.0225 0.083750.20 0.0400 0.110000.25 0.0625 0.14375The bold line in the graph on the next page (labeled Q6, for Question 6) depicts the indifference curve.7. Repeating the analysis in Problem 6, utility is now:U = E(r) – 0.5Aσ2 = E(r) –2.0σ2 = 0.05The equal-utility combinations of expected return and standard deviation arepresented in the table below. The indifference curve is the upward sloping line in the graph on the next page, labeled Q7 (for Question 7).σσ 2E(r)0.00 0.0000 0.05000.05 0.0025 0.05500.10 0.0100 0.07000.15 0.0225 0.09500.20 0.0400 0.13000.25 0.0625 0.1750The indifference curve in Problem 7 differs from that in Problem 6 in slope.When A increases from 3 to 4, the increased risk aversion results in a greaterslope for the indifference curve since more expected return is needed in order to compensate for additional σ.8. The coefficient of risk aversion for a risk neutral investor is zero. Therefore, thecorresponding utility is equal to the portfolio’s expected return. The corresponding indifference curve in the expected return-standard deviation plane is a horizontal line, labeled Q8 in the graph above (see Problem 6).9. A risk lover, rather than penalizing portfolio utility to account for risk, derivesgreater utility as variance increases. This amounts to a negative coefficient of risk aversion. The corresponding indifference curve is downward sloping in the graph above (see Problem 6), and is labeled Q9.10. The portfolio expected return and variance are computed as follows:(1) W Bills (2)r Bills(3)W Index(4)r Indexr Portfolio(1)×(2)+(3)×(4)σPortfolio(3) × 20%σ 2 Portfolio0.0 5% 1.0 13.0% 13.0% = 0.130 20% = 0.20 0.04000.2 5 0.8 13.0 11.4% = 0.114 16% = 0.16 0.02560.4 5 0.6 13.0 9.8% = 0.098 12% = 0.12 0.01440.6 5 0.4 13.0 8.2% = 0.082 8% = 0.08 0.00640.8 5 0.2 13.0 6.6% = 0.066 4% = 0.04 0.00161.0 5 0.0 13.0 5.0% = 0.050 0% = 0.00 0.0000 11. Computing utility from U = E(r) – 0.5 ×Aσ2 = E(r) –σ2, we arrive at the values inthe column labeled U(A = 2) in the following table:W Bills W Index r PortfolioσPortfolioσ2Portfolio U(A = 2) U(A = 3)0.0 1.0 0.130 0.20 0.0400 0.0900 .07000.2 0.8 0.114 0.16 0.0256 0.0884 .07560.4 0.6 0.098 0.12 0.0144 0.0836 .07640.6 0.4 0.082 0.08 0.0064 0.0756 .07240.8 0.2 0.066 0.04 0.0016 0.0644 .06361.0 0.0 0.050 0.00 0.0000 0.0500 .0500The column labeled U(A = 2) implies that investors with A = 2 prefer a portfolio that is invested 100% in the market index to any of the other portfolios in the table.12. The column labeled U(A = 3) in the table above is computed from:U = E(r) – 0.5Aσ2 = E(r) – 1.5σ2The more risk averse investors prefer the portfolio that is invested 40% in themarket, rather than the 100% market weight preferred by investors with A = 2.13. Expected return = (0.7 × 18%) + (0.3 × 8%) = 15%Standard deviation = 0.7 × 28% = 19.6%14. Investment proportions: 30.0% in T-bills0.7 × 25% = 17.5% in Stock A0.7 × 32% = 22.4% in Stock B0.7 × 43% = 30.1% in Stock C15. Your reward-to-volatility ratio:.18.080.3571.28S-==Client's reward-to-volatility ratio:.15.080.3571.196S-==16.17. a. E(r C) = r f + y × [E(r P) –r f] = 8 + y × (18 - 8)If the expected return for the portfolio is 16%, then:16% = 8% + 10% ×y?.16.080.8.10y-==Therefore, in order to have a portfolio with expected rate of return equal to 16%, the client must invest 80% of total funds in the risky portfolio and 20% in T-bills.b.Client’s investment proportions:20.0% in T-bills0.8 × 25% = 20.0% in Stock A0.8 × 32% = 25.6% in Stock B0.8 × 43% = 34.4% in Stock Cc. σC = 0.8 ×σP = 0.8 × 28% = 22.4%18. a.σC = y × 28%If your client prefers a standard deviation of at most 18%, then: y = 18/28 = 0.6429 = 64.29% invested in the risky portfolio.b. ().08.1.08(0.6429.1)14.429%C E r y =+?=+?=19. a.y *0.36440.27440.100.283.50.080.18σ22==?-=-=PfP A r )E(r Therefore, th e client’s optimal proportions are: 36.44% invested in the risky portfolio and 63.56% invested in T-bills.b. E (r C ) = 0.08 + 0.10 × y * = 0.08 + (0.3644 × 0.1) = 0.1164 or 11.644% σC = 0.3644 × 28 = 10.203%20. a.If the period 1926–2012 is assumed to be representative of future expected performance, then we use the following data to compute the fraction allocated to equity: A = 4, E (r M ) ? r f = 8.10%, σM = 20.48% (we use the standard deviation of the risk premium from Table 6.7). Then y * is given by:That is, 48.28% of the portfolio should be allocated to equity and 51.72% should be allocated to T-bills.b.If the period 1968–1988 is assumed to be representative of future expected performance, then we use the following data to compute the fraction allocated to equity: A = 4, E (r M ) ? r f = 3.44%, σM = 16.71% and y * is given by:22()0.0344*0.308040.1671M fME r r y A σ-===?Therefore, 30.80% of the complete portfolio should be allocated to equity and 69.20% should be allocated to T-bills.c.In part (b), the market risk premium is expected to be lower than in part (a) and market risk is higher. Therefore, the reward-to-volatility ratio is expected to be lower in part (b), which explains the greater proportioninvested in T-bills.21. a. E (r C ) = 8% = 5% + y × (11% – 5%) ? .08.050.5.11.05y -==-b. σC = y × σP = 0.50 × 15% = 7.5%c.The first client is more risk averse, preferring investments that have less risk as evidenced by the lower standard deviation. 22. Johnson requests the portfolio standard deviation to equal one half the marketportfolio standard deviation. The market portfolio 20%M σ=, which implies 10%P σ=. The intercept of the CML equals 0.05f r=and the slope of the CMLequals the Sharpe ratio for the market portfolio (35%). Therefore using the CML:()()0.050.350.100.0858.5%M fP f P ME r r E r r σσ-=+=+?==23. Data: r f = 5%, E (r M ) = 13%, σM = 25%, and B f r = 9%The CML and indifference curves are as follows:24. For y to be less than 1.0 (that the investor is a lender), risk aversion (A ) must belarge enough such that:1σ<-=2MfM A r )E(r y ? 1.280.250.050.132=->A For y to be greater than 1 (the investor is a borrower), A must be small enough:1σ)(>-=2MfM A r r E y ? 0.640.250.090.132=-<A For values of risk aversion within this range, the client will neither borrow nor lend but will hold a portfolio composed only of the optimal risky portfolio:y = 1 for 0.64 ≤ A ≤ 1.2825. a.The graph for Problem 23 has to be redrawn here, with: E (r P ) = 11% and σP = 15%b. For a lending position: 2.670.150.050.112=->AFor a borrowing position: 0.890.150.090.112=-<A Therefore, y = 1 for 0.89 ≤ A ≤ 2.6726. The maximum feasible fee, denoted f , depends on the reward-to-variability ratio.For y < 1, the lending rate, 5%, is viewed as the relevant risk-free rate, and we solve for f as follows:.11.05.13.05.15.25f ---= ? .15.08.06.012, or 1.2%.25f ?=-= For y > 1, the borrowing rate, 9%, is the relevant risk-free rate. Then we notice that,even without a fee, the active fund is inferior to the passive fund because:.11 – .09 – f= 0.13 <.13 – .09 = 0.16 → f = –.004.15.25More risk tolerant investors (who are more inclined to borrow) will not be clients of the fund. We find that f is negative: that is, you would need to pay investors to choose your active fund. These investors desire higher risk –higher return complete portfolios and thus are in the borrowing range of the relevant CAL. In this range, the reward-to-variability ratio of the index (the passive fund) is better than that of the managed fund. 27. a.Slope of the CML .13.080.20-==28. a.With 70% of his money invested in my fund’s portfolio, the client’s expected return is 15% per year with a standard deviation of 19.6% per year. If he shifts that money to the passive portfolio (which has an expected return of 13% and standard deviation of 25%), his overall expected return becomes: E (r C ) = r f + 0.7 × [E (r M ) ? r f ] = .08 + [0.7 × (.13 – .08)] = .115, or 11.5% The standard deviation of the complete portfolio using the passive portfolio would be:σC = 0.7 × σM = 0.7 × 25% = 17.5%Therefore, the shift entails a decrease in mean from 15% to 11.5% and a decrease in standard deviation from 19.6% to 17.5%. Since both mean return and standard deviation decrease, it is not yet clear whether the move is beneficial. The disadvantage of the shift is that, if the client is willing toaccept a mean return on his total portfolio of 11.5%, he can achieve it with a lower standard deviation using my fund rather than the passive portfolio. To achieve a target mean of 11.5%, we first write the mean of the complete portfolio as a function of the proportion invested in my fund (y ):E (r C ) = .08 + y × (.18 ? .08) = .08 + .10 × yOur target is: E (r C ) = 11.5%. Therefore, the proportion that must be invested in my fund is determined as follows:.115 = .08 + .10 × y ? .115.080.35.10y -== The standard deviation of this portfolio would be:σC = y × 28% = 0.35 × 28% = 9.8%Thus, by using my portfolio, the same 11.5% expected return can be achieved with a standard deviation of only 9.8% as opposed to the standard deviation of 17.5% using the passive portfolio.b.The fee would reduce the reward-to-volatility ratio, i.e., the slope of the CAL. The client will be indifferent between my fund and the passive portfolio if the slope of the after-fee CAL and the CML are equal. Let f denote the fee:Slope of CAL with fee .18.08.10.28.28f f---==Slope of CML (which requires no fee).13.080.20.25-== Setting these slopes equal we have:.100.200.044 4.4%.28ff -=?==per year29. a.The formula for the optimal proportion to invest in the passive portfolio is:2σ)(*MfM A r r E y -=Substitute the following: E (r M ) = 13%; r f = 8%; σM = 25%; A = 3.5:20.130.08*0.2286, or 22.86% in the passive portfolio 3.50.25y -==?b. The answer here is the same as the answer to Problem 28(b). The fee that youcan charge a client is the same regardless of the asset allocation mix of theclient’s portfolio. You can charge a fee that will equate the reward-to-volatility ratio of your portfolio to that of your competition.CFA PROBLEMS1. Utility for each investment = E(r) – 0.5 × 4 ×σ2We choose the investment with the highest utility value, Investment 3.Investment ExpectedreturnE(r)StandarddeviationσUtilityU1 0.12 0.30 -0.06002 0.15 0.50 -0.35003 0.21 0.16 0.15884 0.24 0.21 0.15182. When investors are risk neutral, then A = 0; the investment with the highest utilityis Investment 4 because it has the highest expected return.3. (b)4. Indifference curve 2 because it is tangent to the CAL.5. Point E6. (0.6 × $50,000) + [0.4 × (-$30,000)] - $5,000 = $13,0007. (b) Higher borrowing rates will reduce the total return to the portfolio and thisresults in a part of the line that has a lower slope.8. Expected return for equity fund = T-bill rate + Risk premium = 6% + 10% = 16%Expected rate of return of the client’s portfolio = (0.6 × 16%) + (0.4 × 6%) = 12% Expected return of the client’s portfolio = 0.12 ×$100,000 = $12,000(which implies expected total wealth at the end of the period = $112,000)Standard deviation of client’s ov erall portfolio = 0.6 × 14% = 8.4%9. Reward-to-volatility ratio = .100.71 .14=CHAPTER 6: APPENDIX1.By year-end, the $50,000 investment will grow to: $50,000 × 1.06 = $53,000Without insurance, the probability distribution of end-of-year wealth is:Probability WealthNo fire 0.999 $253,000Fire 0.001 53,000For this distribution, expected utility is computed as follows:E[U(W)] = [0.999 ×ln(253,000)] + [0.001 ×ln(53,000)] = 12.439582 The certainty equivalent is:W CE = e 12.439582 = $252,604.85With fire insurance, at a cost of $P, the investment in the risk-free asset is: $(50,000 –P)Year-end wealth will be certain (since you are fully insured) and equal to: [$(50,000 –P) × 1.06] + $200,000Solve for P in the following equation:[$(50,000 –P) × 1.06] + $200,000 = $252,604.85 ?P = $372.78 This is the most you are willing to pay for insurance. Note that the expected loss is “only” $200, so you are willing to pay a substantial risk premium over the expected value of losses. The primary reason is that the value of the house is a largeproportion of your wealth.2. a. With insurance coverage for one-half the value of the house, the premiumis $100, and the investment in the safe asset is $49,900. By year-end, theinvestment of $49,900 will grow to: $49,900 × 1.06 = $52,894If there is a fire, your insurance proceeds will be $100,000, and theprobability distribution of end-of-year wealth is:Probability WealthNo fire 0.999 $252,894Fire 0.001 152,894For this distribution, expected utility is computed as follows:E[U(W)] = [0.999 ×ln(252,894)] + [0.001×ln(152,894)] = 12.4402225 The certainty equivalent is:W CE = e 12.4402225 = $252,766.77b.With insurance coverage for the full value of the house, costing $200, end-of-year wealth is certain, and equal to:[($50,000 – $200) × 1.06] + $200,000 = $252,788Since wealth is certain, this is also the certainty equivalent wealth of the fully insured position.c.With insurance coverage for 1? times the value of the house, the premiumis $300, and the insurance pays off $300,000 in the event of a fire. Theinvestment in the safe asset is $49,700. By year-end, the investment of$49,700 will grow to: $49,700 × 1.06 = $52,682The probability distribution of end-of-year wealth is:Probability WealthNo fire 0.999 $252,682Fire 0.001 352,682For this distribution, expected utility is computed as follows:E[U(W)] = [0.999 ×ln(252,682)] + [0.001 ×ln(352,682)] = 12.4402205 The certainty equivalent is:W CE = e 12.440222 = $252,766.27Therefore, full insurance dominates both over- and underinsurance.Overinsuring creates a gamble (you actually gain when the house burns down).Risk is minimized when you insure exactly the value of the house.。
投资学第10版课后习题答案Chap001
CHAPTER 1: THE INVESTMENT ENVIRONMENT PROBLEM SETS1. While it is ultimately true that real assets determine the material well-being of aneconomy, financial innovation in the form of bundling and unbundling securitiescreates opportunities for investors to form more efficient portfolios. Bothinstitutional and individual investors can benefit when financial engineering creates new products that allow them to manage their portfolios of financial assets moreefficiently. Bundling and unbundling create financial products with new properties and sensitivities to various sources of risk that allows investors to reduce volatility by hedging particular sources of risk more efficiently.2.Securitization requires access to a large number of potential investors. To attractthese investors, the capital market needs:1. a safe system of business laws and low probability of confiscatorytaxation/regulation;2. a well-developed investment banking industry;3. a well-developed system of brokerage and financial transactions; and4.well-developed media, particularly financial reporting.These characteristics are found in (indeed make for) a well-developed financialmarket.3. Securitization leads to disintermediation; that is, securitization provides a meansfor market participants to bypass intermediaries. For example, mortgage-backedsecurities channel funds to the housing market without requiring that banks orthrift institutions make loans from their own portfolios. Securitization works welland can benefit many, but only if the market for these securities is highly liquid.As securitization progresses, however, and financial intermediaries loseopportunities, they must increase other revenue-generating activities such asproviding short-term liquidity to consumers and small business and financialservices.4. The existence of efficient capital markets and the liquid trading of financial assetsmake it easy for large firms to raise the capital needed to finance their investments in real assets. If Ford, for example, could not issue stocks or bonds to the generalpublic, it would have a far more difficult time raising capital. Contraction of thesupply of financial assets would make financing more difficult, thereby increasing the cost of capital. A higher cost of capital results in less investment and lowerreal growth.5. Even if the firm does not need to issue stock in any particular year, the stock marketis still important to the financial manager. The stock price provides importantinformation about how the market values the firm's investment projects. For example, if the stock price rises considerably, managers might conclude that the marketbelieves the firm's future prospects are bright. This might be a useful signal to thefirm to proceed with an investment such as an expansion of the firm's business.In addition, shares that can be traded in the secondary market are more attractive toinitial investors since they know that they will be able to sell their shares. This inturn makes investors more willing to buy shares in a primary offering and thusimproves the terms on which firms can raise money in the equity market.Remember that stock exchanges like those in New York, London, and Paris are theheart of capitalism, in which firms can raise capital quickly in primary marketsbecause investors know there are liquid secondary markets.6. a. No. The increase in price did not add to the productive capacity of the economy.b. Yes, the value of the equity held in these assets has increased.c. Future homeowners as a whole are worse off, since mortgage liabilities havealso increased. In addition, this housing price bubble will eventually burst andsociety as a whole (and most likely taxpayers) will suffer the damage.7. a. The bank loan is a financial liability for Lanni, and a financial asset for the bank.The cash Lanni receives is a financial asset. The new financial asset created isLanni's promissory note to repay the loan.b. Lanni transfers financial assets (cash) to the software developers. In return,Lanni receives the completed software package, which is a real asset. Nofinancial assets are created or destroyed; cash is simply transferred from one partyto another.c. Lanni exchanges the real asset (the software) for a financial asset, which is 1,500shares of Microsoft stock. If Microsoft issues new shares in order to pay Lanni,then this would represent the creation of new financial assets.d. By selling its shares in Microsoft, Lanni exchanges one financial asset (1,500shares of stock) for another ($120,000 in cash). Lanni uses the financial asset of$50,000 in cash to repay the bank and retire its promissory note. The bank mustreturn its financial asset to Lanni. The loan is "destroyed" in the transaction, since it is retired when paid off and no longer exists.8. a.AssetsLiabilities & Shareholders’ EquityCash $ 70,000 Bank loan $ 50,000 Computers 30,000 Shareholders’ equity50,000 Total $100,000 Total $100,000 Ratio of real assets to total assets = $30,000/$100,000 = 0.30b.AssetsLiabilities & Shareholders’ EquitySoftware product* $ 70,000 Bank loan $ 50,000 Computers 30,000 Shareholders’ equity50,000 Total $100,000 Total $100,000 *Valued at costRatio of real assets to total assets = $100,000/$100,000 = 1.0c.AssetsLiabilities & Shareholders’ EquityMicrosoft shares $120,000 Bank loan $ 50,000Computers 30,000 Shareholders’ equity100,000Total $150,000 Total $150,000 Ratio of real assets to total assets = $30,000/$150,000 = 0.20Conclusion: when the firm starts up and raises working capital, it is characterized bya low ratio of real assets to total assets. When it is in full production, it has a highratio of real assets to total assets. When the project "shuts down" and the firm sells it off for cash, financial assets once again replace real assets.9. For commercial banks, the ratio is: $166.1/$13,926.0 = 0.0119For nonfinancial firms, the ratio is: $15,320/$30,649 = 0.4999The difference should be expected primarily because the bulk of thebusiness of financial institutions is to make loans and the bulk of non-financial corporations is to invest in equipment, manufacturing plants, andproperty. The loans are financial assets for financial institutions, but theinvestments of non-financial corporations are real assets.10. a. Primary-market transaction in which gold certificates are being offered topublic investors for the first time by an underwriting syndicate led by JW KorthCapital.b. The certificates are derivative assets because they represent an investment inphysical gold, but each investor receives a certificate and no gold. Note thatinvestors can convert the certificate into gold during the four-year period.c. Investors who wish to hold gold without the complication, risk, and cost ofphysical storage.11. a. A fixed salary means that compensation is (at least in the short run)independent of the firm's success. This salary structure does not tie the manager’simmediate compensation to the success of the firm, so a manager might not feeltoo compelled to work hard to maximize firm value. However, the managermight view this as the safest compensation structure and therefore value it morehighly.b. A salary that is paid in the form of stock in the firm means that the manager earnsthe most when the shareholders’ wealth is maximized. Five years of vesting helpsalign the interests of the employee with the long-term performance of the firm. Thisstructure is therefore most likely to align the interests of managers and shareholders.If stock compensation is overdone, however, the manager might view it as overlyrisky since the manager’s career is already linked to the firm, and this undiversifiedexposure would be exacerbated with a large stock position in the firm.c. A profit-linked salary creates great incentives for managers to contribute to thefirm’s success. However, a manager whose salary is tied to short-term profits will be risk seeking, especially if these short-term profits determine salary or if thecompensation structure does not bear the full cost of the project’s risks. Shareholders, in contrast, bear the losses as well as the gains on the project and might be lesswilling to assume that risk.12. Even if an individual shareholder could monitor and improve managers’ performanceand thereby increase the value of the firm, the payoff would be small, since theownership share in a large corporation would be very small. For example, if you own $10,000 of Ford stock and can increase the value of the firm by 5%, a very ambitious goal, you benefit by only: 0.05 $10,000 = $500. The cost, both personal andfinancial to an individual investor, is likely to be prohibitive and would typicallyeasily exceed any accrued benefits, in this case $500.In contrast, a bank that has a multimillion-dollar loan outstanding to the firm has a big stake in making sure that the firm can repay the loan. It is clearly worthwhile for thebank to spend considerable resources to monitor the firm.13. Mutual funds accept funds from small investors and invest, on behalf of theseinvestors, in the domestic and international securities markets.Pension funds accept funds and then invest in a wide range of financial securities, on behalf of current and future retirees, thereby channeling funds from one sector of theeconomy to another.Venture capital firms pool the funds of private investors and invest in start-up firms.Banks accept deposits from customers and loan those funds to businesses or use thefunds to buy securities of large corporations.14. Treasury bills serve a purpose for investors who prefer a low-risk investment.The lower average rate of return compared to stocks is the price investors payfor predictability of investment performance and portfolio value.15. With a top-down investing style, you focus on asset allocation or the broadcomposition of the entire portfolio, which is the major determinant of overallperformance. Moreover, top-down management is the natural way to establish aportfolio with a level of risk consistent with your risk tolerance. The disadvantage ofan exclusive emphasis on top-down issues is that you may forfeit the potential highreturns that could result from identifying and concentrating in undervalued securitiesor sectors of the market.With a bottom-up investing style, you try to benefit from identifying undervaluedsecurities. The disadvantage is that investors might tend to overlook the overallcomposition of your portfolio, which may result in a nondiversified portfolio or aportfolio with a risk level inconsistent with the appropriate level of risk tolerance. Inaddition, this technique tends to require more active management, thus generatingmore transaction costs. Finally, the bottom-up analysis may be incorrect, in which case there will be a fruitlessly expended effort and money attempting to beat a simple buy-and-hold strategy.16. You should be skeptical. If the author actually knows how to achieve such returns, onemust question why the author would then be so ready to sell the secret to others.Financial markets are very competitive; one of the implications of this fact is thatriches do not come easily. High expected returns require bearing some risk, andobvious bargains are few and far between. Odds are that the only one getting rich from the book is its author.17. Financial assets provide for a means to acquire real assets as well as an expansionof these real assets. Financial assets provide a measure of liquidity to real assetsand allow for investors to more effectively reduce risk through diversification.18. Allowing traders to share in the profits increases th e traders’ willingness toassume risk. Traders will share in the upside potential directly in the form ofhigher compensation but only in the downside indirectly in the form of potentialjob loss if performance is bad enough. This scenario creates a form of agencyconflict known as moral hazard, in which the owners of the financial institutionshare in both the total profits and losses, while the traders will tend to share more of the gains than the losses.19. Answers may vary, however, students should touch on the following: increasedtransparency, regulations to promote capital adequacy by increasing the frequency of gain or loss settlement, incentives to discourage excessive risk taking, and thepromotion of more accurate and unbiased risk assessment.。
(完整版)投资学第10版习题答案05
(完整版)投资学第10版习题答案05CHAPTER 5: RISK, RETURN, AND THE HISTORICALRECORDPROBLEM SETS1. The Fisher equation predicts that the nominal rate will equal the equilibriumreal rate plus the expected inflation rate. Hence, if the inflation rate increasesfrom 3% to 5% while there is no change in the real rate, then the nominal ratewill increase by 2%. On the other hand, it is possible that an increase in theexpected inflation rate would be accompanied by a change in the real rate ofinterest. While it is conceivable that the nominal interest rate could remainconstant as the inflation rate increased, implying that the real rate decreasedas inflation increased, this is not a likely scenario.2. If we assume that the distribution of returns remains reasonably stable overthe entire history, then a longer sample period (i.e., a larger sample) increasesthe precision of the estimate of the expected rate of return; this is aconsequence of the fact that the standard error decreases as the sample sizeincreases. However, if we assume that the mean of the distribution of returnsis changing over time but we are not in a position to determine the nature ofthis change, then the expected return must be estimated from a more recentpart of the historical period. In this scenario, we must determine how far back,historically, to go in selecting the relevant sample. Here, it is likely to bedisadvantageous to use the entire data set back to 1880.3. The true statements are (c) and (e). The explanations follow.Statement (c): Let σ = the annual standard deviation of the risky investmentsand 1σ= the standard deviation of the first investment alternative over the two-year period. Then:σσ?=21Therefore, the annualized standard deviation for the first investment alternative is equal to:σσσ<=221Statement (e): The first investment alternative is more attractive to investors with lower degrees of risk aversion. The first alternative (entailing a sequence of two identically distributed and uncorrelated risky investments) is riskierthan the second alternative (the risky investment followed by a risk-freeinvestment). Therefore, the first alternative is more attractive to investors with lower degrees of risk aversion. Notice, however, that if you mistakenlybelieved that time diversification can reduce the total risk of a sequence ofrisky investments, you would have been tempted to conclude that the firstalternative is less risky and therefore more attractive to more risk-averseinvestors. This is clearly not the case; the two-year standard deviation of thefirst alternative is greater than the two-year standard deviation of the secondalternative.4. For the money market fund, your holding-period return for the next yeardepends on the level of 30-day interest rates each month when the fund rolls over maturing securities. The one-year savings deposit offers a 7.5% holding period return for the year. If you forecast that the rate on money marketinstruments will increase significantly above the current 6% yield, then themoney market fund might result in a higher HPR than the savings deposit.The 20-year Treasury bond offers a yield to maturity of 9% per year, which is 150 basis points higher than the rate on the one-year savings deposit; however, you could earn a one-year HPR much less than 7.5% on the bond if long-term interest rates increase during the year. If Treasury bond yields rise above 9%, then the price of the bond will fall, and the resulting capital loss will wipe out some or all of the 9% return you would have earned if bond yields hadremained unchanged over the course of the year.5. a. If businesses reduce their capital spending, then they are likely todecrease their demand for funds. This will shift the demand curve inFigure 5.1 to the left and reduce the equilibrium real rate of interest.b. Increased household saving will shift the supply of funds curve to theright and cause real interest rates to fall.c. Open market purchases of U.S. Treasury securities by the FederalReserve Board are equivalent to an increase in the supply of funds (ashift of the supply curve to the right). The FED buys treasuries withcash from its own account or it issues certificates which trade likecash. As a result, there is an increase in the money supply, and theequilibrium real rate of interest will fall.6. a. The “Inflation-Plus” CD is the safer investment because it guarantees thepurchasing power of the investment. Using the approximation that the realrate equals the nominal rate minus the inflation rate, the CD provides a realrate of 1.5% regardless of the inflation rate.b. The expected return depends on the expected rate of inflation over the nextyear. If the expected rate of inflation is less than 3.5% then the conventionalCD offers a higher real return than the inflation-plus CD; if the expected rateof inflation is greater than 3.5%, then the opposite is true.c. If you expect the rate of inflation to be 3% over the next year, then theconventional CD offers you an expected real rate of return of 2%, which is0.5% higher than the real rate on the inflation-protected CD. But unless youknow that inflation will be 3% with certainty, the conventional CD is alsoriskier. The question of which is the better investment then depends on yourattitude towards risk versus return. You might choose to diversify and investpart of your funds in each.d. No. We cannot assume that the entire difference between the risk-freenominal rate (on conventional CDs) of 5% and the real risk-free rate (oninflation-protected CDs) of 1.5% is the expected rate of inflation. Part of thedifference is probably a risk premium associated with the uncertaintysurrounding the real rate of return on the conventional CDs. This impliesthat the expected rate of inflation is less than 3.5% per year.7. E(r) = [0.35 × 44.5%] + [0.30 × 14.0%] + [0.35 × (–16.5%)] = 14%σ2 = [0.35 × (44.5 – 14)2] + [0.30 × (14 – 14)2] + [0.35 × (–16.5 – 14)2] = 651.175 σ = 25.52%The mean is unchanged, but the standard deviation has increased, as theprobabilities of the high and low returns have increased.8. Probability distribution of price and one-year holding period return for a 30-year U.S. Treasury bond (which will have 29 years to maturity at year-end):Economy Probability YTM Price CapitalGainCouponInterest HPRBoom 0.20 11.0% $ 74.05 -$25.95 $8.00 -17.95% Normal growth 0.50 8.0 100.00 0.00 8.00 8.00 Recession 0.30 7.0 112.28 12.28 8.00 20.289. E(q) = (0 × 0.25) + (1 × 0.25) + (2 × 0.50) = 1.25σq = [0.25 × (0 – 1.25)2 + 0.25 × (1 – 1.25)2 + 0.50 × (2 – 1.25)2]1/2 = 0.8292 10. (a) With probability 0.9544, the value of a normally distributedvariable will fall within 2 standard deviations of the mean; that is,between –40% and 80%. Simply add and subtract 2 standarddeviations to and from the mean.11. From Table 5.4, the average risk premium for the period 7/1926-9/2012 was:12.34% per year.Adding 12.34% to the 3% risk-free interest rate, the expected annual HPR for the Big/Value portfolio is: 3.00% + 12.34% = 15.34%.No. The distributions from (01/1928–06/1970) and (07/1970–12/2012) periods have distinct characteristics due to systematic shocks to the economy and subsequent government intervention. While the returns from the two periods do not differ greatly, their respective distributions tell a different story. The standard deviation for all six portfolios is larger in the first period. Skew is also positive, but negative in the second, showing a greater likelihood of higher-than-normal returns in the right tail.Kurtosis is also markedly larger in the first period.13. a%88.5,0588.070.170.080.01111or i i rn i rn rr =-=+-=-++=b. rr ≈ rn - i = 80% - 70% = 10%Clearly, the approximation gives a real HPR that is too high.14. From Table 5.2, the average real rate on T-bills has been 0.52%.a. T-bills: 0.52% real rate + 3% inflation = 3.52%b. Expected return on Big/Value:3.52% T-bill rate + 12.34% historical risk premium = 15.86%c. The risk premium on stocks remains unchanged. A premium, thedifference between two rates, is a real value, unaffected by inflation.15. Real interest rates are expected to rise. The investment activity will shiftthe demand for funds curve (in Figure 5.1) to the right. Therefore theequilibrium real interest rate will increase.16. a. Probability distribution of the HPR on the stock market and put:STOCK PUT State of theEconomyProbability Ending Price + Dividend HPR Ending Value HPR Excellent0.25 $ 131.00 31.00% $ 0.00 -100% Good0.45 114.00 14.00 $ 0.00 -100 Poor0.25 93.25 ?6.75 $ 20.25 68.75 Crash 0.05 48.00 -52.00 $ 64.00 433.33Remember that the cost of the index fund is $100 per share, and the costof the put option is $12.b. The cost of one share of the index fund plus a put option is $112. Theprobability distribution of the HPR on the portfolio is:State of the Economy Probability Ending Price + Put + DividendHPRExcellent 0.25 $ 131.00 17.0%= (131 - 112)/112 Good 0.45 114.00 1.8= (114 - 112)/112 Poor 0.25 113.50 1.3= (113.50 - 112)/112 Crash0.05 112.00 0.0 = (112 - 112)/112 c. Buying the put option guarantees the investor a minimum HPR of 0.0% regardless of what happens to the stock's price. Thus, it offers insuranceagainst a price decline.17. The probability distribution of the dollar return on CD plus call option is:State of theEconomy Probability Ending Valueof CDEnding Valueof CallCombinedValueExcellent 0.25 $ 114.00 $16.50 $130.50Good 0.45 114.00 0.00 114.00Poor 0.25 114.00 0.00 114.00Crash 0.05 114.00 0.00 114.0018.a.Total return of the bond is (100/84.49)-1 = 0.1836. With t = 10, the annualrate on the real bond is (1 + EAR) = = 1.69%.b.With a per quarter yield of 2%, the annual yield is = 1.0824, or8.24%. The equivalent continuously compounding (cc) rate is ln(1+.0824)= .0792, or 7.92%. The risk-free rate is 3.55% with a cc rate of ln(1+.0355)= .0349, or 3.49%. The cc risk premium will equal .0792 - .0349 = .0443, or4.433%.c.The appropriate formula is ,where . Using solver or goal seek, setting thetarget cell to the known effective cc rate by changing the unknown variance(cc) rate, the equivalent standard deviation (cc) is 18.03% (excel mayyield slightly different solutions).d.The expected value of the excess return will grow by 120 months (12months over a 10-year horizon). Therefore the excess return will be 120 ×4.433% = 531.9%. The expected SD grows by the square root of timeresulting in 18.03% × = 197.5%. The resulting Sharpe ratio is531.9/197.5 = 2.6929. Normsdist (-2.6929) = .0035, or a .35% probabilityof shortfall over a 10-year horizon.CFA PROBLEMS1. The expected dollar return on the investment in equities is $18,000 (0.6 × $50,000 + 0.4×?$30,000) compared to the $5,000 expected return for T-bills. Therefore, the expected risk premium is $13,000.2. E(r) = [0.2 × (?25%)] + [0.3 × 10%] + [0.5 × 24%] =10%3. E(r X) = [0.2 × (?20%)] + [0.5 × 18%] + [0.3 × 50%] =20%E(r Y) = [0.2 × (?15%)] + [0.5 × 20%] + [0.3 × 10%] =10%4. σX2 = [0.2 × (– 20 – 20)2] + [0.5 × (18 – 20)2] + [0.3 × (50 – 20)2] = 592σX = 24.33%σY2 = [0.2 × (– 15 – 10)2] + [0.5 × (20 – 10)2] + [0.3 × (10 – 10)2] = 175σY = 13.23%5. E(r) = (0.9 × 20%) + (0.1 × 10%) =19% $1,900 in returns6. The probability that the economy will be neutral is 0.50, or 50%. Given aneutral economy, the stock will experience poor performance 30% of thetime. The probability of both poor stock performance and a neutral economy is therefore: 0.30 × 0.50 = 0.15 = 15%7. E(r) = (0.1 × 15%) + (0.6 × 13%) + (0.3 × 7%) = 11.4%。
投资学课后习题及答案
投资学课后习题及答案投资学课后习题及答案投资学练习导论习题1证券投资是指投资者购买_______、________、________等有价证券以及这些有价证券的_______以获取________、_________及________的投资行为和投资过程,是直接投资的重要形式。
(填空)2 ____是投资者为实现投资目标所遵循的基本方针和基本准则。
(单选) A证券投资政策 B证券投资分析 C证券投组合 D评估证券投资组合的业绩3 一般来说,证券投资与投机的区别主要可以从________等不同角度进行分析。
(多选) A 动机 B对证券所作的分析方法 C投资期限 D投资对象E风险倾向4在证券市场中,难免出现投机行为,有投资就必然有投机。
适度的投机有利于证券市场发展(判断)第一至第四章习题1在股份有限公司利润增长时,参与优先股股东除了按固定股息率取得股息外,还可以分得___________。
(填空)2 累积优先股是一种常见的、发行很广泛的优先股股票。
其特点是股息率______,而且可以 ________计算。
(填空)3________不是优先股的特征之一。
(单选)A约定股息率 B股票可由公司赎回 C具有表决权 D优先分派股息和清偿剩余资产。
4 股份有限公司最初发行的大多是_____,通过这类股票所筹集的资金通常是股份有限公司股本的基础。
(单选) A特别股 B优先股 CB股 D普通股5 当公司前景和股市行情看好、盈利增加时,可转换优先股股东的最佳策略是_______ 。
(单选)A转换成参与优先股 B转换成公司债券 C转换成普通股 D转换成累积优先股6 下列外资股中,不属于境外上市外资股的是________。
(单选)A H股 BN股 CB股 DS股7 股份制就是以股份公司为核心,以股票发行为基础,以股票交易为依托。
(判断) 8 可赎回优先股是指允许拥有该股票的股东在一个合理的价格范围内将资金赎回。
(判断) 9________是指在管理层和股东之间发生冲突的可能性,它是由管理层在利益回报方面的控制以及管理人员的低效业绩所产生的问题。
投资学第10版课后习题答案Chap003
CHAPTER 3: HOW SECURITIES ARE TRADEDPROBLEM SETS1.Stop-loss order: allows a stock to be sold if the price falls below a predeterminedlevel. Stop-loss orders often accompany short sales. Limit sell order: sells stockwhen the price rises above a predetermined level. Market order: either a buy or sellorder that is executed immediately at the current market price2. In response to the potential negative reaction to large [block] trades, trades will be splitup into many small trades, effectively hiding the total number of shares bought or sold.3. The use of leverage necessarily magnifies returns to investors. Leveragingborrowed money allows for greater return on investment if the stock price increases.However, if the stock price declines, the investor must repay the loan, regardless ofhow far the stock price drops, and incur a negative rate of return. For example, if aninvestor buys an asset at $100 and the price rises to $110, the investor earns 10%.If an investor takes out a $40 loan at 5% and buys the same stock, the return will be13.3%, computed as follows: $10 capital gain minus $2 interest expense divided bythe $60 original investment. Of course, if the stock price falls below $100, thenegative return will be greater for the leveraged account.4. (a) A market order is an order to execute the trade immediately at the bestpossible price. The emphasis in a market order is the speed of execution (thereduction of execution uncertainty). The disadvantage of a market order is thatthe price at which it will be executed is not known ahead of time; it thus hasprice uncertainty.5. (a) A broker market consists of intermediaries who have the discretion to tradefor their clients. A large block trade in an illiquid security would most likelytrade in this market as the brokers would have the best access to clientsinterested in this type of security.The advantage of an electronic communication network (ECN) is that it canexecute large block orders without affecting the public quote. Since thissecurity is illiquid, large block orders are less likely to occur and thus it wouldnot likely trade through an ECN.Electronic limit-order markets (ELOM) transact securities with high tradingvolume. This illiquid security is unlikely to be traded on an ELOM.6. a. The stock is purchased for: 300 ⨯ $40 = $12,000The amount borrowed is $4,000. Therefore, the investor put up equity, ormargin, of $8,000.b.If the share price falls to $30, then the value of the stock falls to $9,000. Bythe end of the year, the amount of the loan owed to the broker grows to:$4,000 ⨯ 1.08 = $4,320Therefore, the remaining margin in the investor’s account is:$9,000 - $4,320 = $4,680The percentage margin is now: $4,680/$9,000 = 0.52, or 52%Therefore, the investor will not receive a margin call.c.The rate of return on the investment over the year is:(Ending equity in the account - Initial equity)/Initial equity= ($4,680 - $8,000)/$8,000 = -0.415, or -41.5%Alternatively, divide the initial equity investments into the change in valueplus the interest payment:($3,000 loss + $320 interest)/$8,000 = -0.415.7. a. The initial margin was: 0.50 ⨯ 1,000 ⨯ $40 = $20,000As a result of the increase in the stock price Old Economy Traders loses: $10 ⨯ 1,000 = $10,000Therefore, margin decreases by $10,000. Moreover, Old Economy Tradersmust pay the dividend of $2 per share to the lender of the shares, so that themargin in the account decreases by an additional $2,000. Therefore, theremaining margin is:$20,000 – $10,000 – $2,000 = $8,000b. The percentage margin is: $8,000/$50,000 = 0.16, or 16%So there will be a margin call.c. The equity in the account decreased from $20,000 to $8,000 in one year, for arate of return of: (-$12,000/$20,000) = -0.60, or -60%8.a. The buy order will be filled at the best limit-sell order price: $50.25b.The next market buy order will be filled at the next-best limit-sell order price: $51.50 c. You would want to increase your inventory. There is considerable buyingdemand at prices just below $50, indicating that downside risk is limited. Incontrast, limit sell orders are sparse, indicating that a moderate buy order could result in a substantial price increase.9. a.You buy 200 shares of Telecom for $10,000. These shares increase in value by 10%, or $1,000. You pay interest of: 0.08 ⨯ $5,000 = $400The rate of return will be: $1,000$4000.1212%$5,000-==b. The value of the 200 shares is 200P . Equity is (200P – $5,000). You will receive a margin call when:PP 200000,5$200-= 0.30 ⇒ when P = $35.71 or lower10. a.Initial margin is 50% of $5,000, or $2,500.b. Total assets are $7,500 ($5,000 from the sale of the stock and $2,500 put up formargin). Liabilities are 100P . Therefore, equity is ($7,500 – 100P ). A margin call will be issued when:PP 100100500,7$-= 0.30 ⇒ when P = $57.69 or higher11. The total cost of the purchase is: $20 ⨯ 1,000 = $20,000You borrow $5,000 from your broker and invest $15,000 of your own funds.Your margin account starts out with equity of $15,000.a. (i) Equity increases to: ($22 ⨯ 1,000) – $5,000 = $17,000Percentage gain = $2,000/$15,000 = 0.1333, or 13.33%(ii) With price unchanged, equity is unchanged.Percentage gain = zero(iii) Equity falls to ($18 ⨯ 1,000) – $5,000 = $13,000Percentage gain = (–$2,000/$15,000) = –0.1333, or –13.33%The relationship between the percentage return and the percentage change inthe price of the stock is given by:% return = % change in price ⨯ equityinitial s Investor'investment T otal = % change in price ⨯ 1.333 For example, when the stock price rises from $20 to $22, the percentage change in price is 10%, while the percentage gain for the investor is:% return = 10% ⨯000,15$000,20$= 13.33%b. The value of the 1,000 shares is 1,000P . Equity is (1,000P – $5,000). You will receive a margin call when:P P 000,1000,5$000,1-= 0.25 ⇒ when P = $6.67 or lowerc. The value of the 1,000 shares is 1,000P . But now you have borrowed $10,000instead of $5,000. Therefore, equity is (1,000P – $10,000). You will receive a margin call when:PP 000,1000,10$000,1-= 0.25 ⇒ when P = $13.33 or lower With less equity in the account, you are far more vulnerable to a margin call.d. By the end of the year, the amount of the loan owed to the broker grows to:$5,000 ⨯ 1.08 = $5,400The equity in your account is (1,000P – $5,400). Initial equity was $15,000.Therefore, your rate of return after one year is as follows: (i)000,15$000,15$400,5$)22$000,1(--⨯= 0.1067, or 10.67% (ii)000,15$000,15$400,5$)20$000,1(--⨯= –0.0267, or –2.67% (iii)000,15$000,15$400,5$)18$000,1(--⨯= –0.1600, or –16.00% The relationship between the percentage return and the percentage change inthe price of Intel is given by: % return = ⎪⎪⎭⎫ ⎝⎛⨯equity initial s Investor'investment Total price in change %⎪⎪⎭⎫ ⎝⎛⨯-equity initial s Investor'borrowed Funds %8For example, when the stock price rises from $40 to $44, the percentage change in price is 10%, while the percentage gain for the investor is:⎪⎭⎫ ⎝⎛⨯000,15$000,20$%10⎪⎭⎫ ⎝⎛⨯-000,15$000,5$%8=10.67%e. The value of the 1000 shares is 1,000P . Equity is (1,000P – $5,400). You will receive a margin call when:PP 000,1400,5$000,1-= 0.25 ⇒ when P = $7.20 or lower12. a. The gain or loss on the short position is: (–1,000 ⨯ ΔP )Invested funds = $15,000Therefore: rate of return = (–1,000 ⨯ ΔP )/15,000The rate of return in each of the three scenarios is:(i) Rate of return = (–1,000 ⨯ $2)/$15,000 = –0.1333, or –13.33%(ii) Rate of return = (–1,000 ⨯ $0)/$15,000 = 0%(iii) Rate of return = [–1,000 ⨯ (–$2)]/$15,000 = +0.1333, or+13.33%b. Total assets in the margin account equal:$20,000 (from the sale of the stock) + $15,000 (the initial margin) = $35,000Liabilities are 500P . You will receive a margin call when:PP 000,1000,1000,35$-= 0.25 ⇒ when P = $28 or higherc. With a $1 dividend, the short position must now pay on the borrowed shares:($1/share ⨯ 1000 shares) = $1000. Rate of return is now:[(–1,000 ⨯ ΔP ) – 1,000]/15,000(i) Rate of return = [(–1,000 ⨯ $2) – $1,000]/$15,000 = –0.2000, or –20.00%(ii) Rate of return = [(–1,000 ⨯ $0) – $1,000]/$15,000 = –0.0667, or –6.67% (iii) Rate of return = [(–1,000) ⨯ (–$2) – $1,000]/$15,000 = +0.067, or+6.67%Total assets are $35,000, and liabilities are (1,000P + 1,000). A margin call will be issued when:PP 000,1000,1000,1000,35--= 0.25 ⇒ when P = $27.2 or higher13. The broker is instructed to attempt to sell your Marriott stock as soon as theMarriott stock trades at a bid price of $40 or less. Here, the broker will attempt to execute but may not be able to sell at $40, since the bid price is now $39.95. The price at which you sell may be more or less than $40 because the stop-loss becomes a market order to sell at current market prices.14. a. $55.50b. $55.25c. The trade will not be executed because the bid price is lower than the pricespecified in the limit-sell order.d. The trade will not be executed because the asked price is greater than the pricespecified in the limit-buy order.15. a. You will not receive a margin call. You borrowed $20,000 and with another$20,000 of your own equity you bought 1,000 shares of Disney at $40 pershare. At $35 per share, the market value of the stock is $35,000, your equityis $15,000, and the percentage margin is: $15,000/$35,000 = 42.9%Your percentage margin exceeds the required maintenance margin.b. You will receive a margin call when:PP 000,1000,20$000,1-= 0.35 ⇒ when P = $30.77 or lower16. The proceeds from the short sale (net of commission) were: ($21 ⨯ 100) – $50 = $2,050A dividend payment of $200 was withdrawn from the account.Covering the short sale at $15 per share costs (with commission): $1,500 + $50 = $1,550Therefore, the value of your account is equal to the net profit on the transaction:$2,050 – $200 – $1,550 = $300Note that your profit ($300) equals (100 shares ⨯ profit per share of $3). Your net proceeds per share were:$21selling price of stock –$15 repurchase price of stock–$ 2 dividend per share–$ 1 2 trades $0.50 commission per share$ 3CFA PROBLEMS1. a. In addition to the explicit fees of $70,000, FBN appears to have paid animplicit price in underpricing of the IPO. The underpricing is $3 per share, ora total of $300,000, implying total costs of $370,000.b. No. The underwriters do not capture the part of the costs correspondingto the underpricing. The underpricing may be a rational marketingstrategy. Without it, the underwriters would need to spend more resourcesin order to place the issue with the public. The underwriters would thenneed to charge higher explicit fees to the issuing firm. The issuing firmmay be just as well off paying the implicit issuance cost represented bythe underpricing.2. (d) The broker will sell, at current market price, after the first transaction at$55 or less.3. (d)。
- 1、下载文档前请自行甄别文档内容的完整性,平台不提供额外的编辑、内容补充、找答案等附加服务。
- 2、"仅部分预览"的文档,不可在线预览部分如存在完整性等问题,可反馈申请退款(可完整预览的文档不适用该条件!)。
- 3、如文档侵犯您的权益,请联系客服反馈,我们会尽快为您处理(人工客服工作时间:9:00-18:30)。
张元萍《投资学》课后习题答案第一章能力训练答案选择题思考题1.投资就是投资主体、投资目的、投资方式和行为内在联系的统一,这充分体现了投资必然与所有权相联系的本质特征。
也就是说,投资是要素投入权、资产所有权、收益占有权的统一。
这是因为:①反映投资与所有权联系的三权统一的本质特征,适用于商品市场经济的一切时空。
从时间上看,无论是商品经济发展的低级阶段还是高度发达的市场经济阶段,投资都无一例外地是要素投入权、资产所有权、收益占有权的统一;从空间上看,无论是在中国还是外国乃至全球范围,投资都无一例外地是这三权的高度统一。
②反映投资与所有权联系的三权统一的本质特征,适用于任何投资种类和形式。
尽管投资的类型多种多样,投资的形式千差万别,但它们都是投资的三权统一。
③反映投资与所有权联系的三权统一本质特征贯穿于投资运动的全过程。
投资的全过程是从投入要素形成资产开始到投入生产,生产出成果,最后凭借对资产的所有权获取收益。
这一全过程实际上都是投资三权统一的实现过程。
④反映投资与所有权联系的三权统一本质特征,是投资区别于其他经济活动的根本标志。
投资的这种本质特征决定着投资的目的和动机,规定着投资的发展方向,决定着投资的运动规律。
这些都使投资与其他经济活动区别开来,从而构成独立的经济范畴和研究领域。
2.金融投资在整个社会经济中的作用来看,金融投资的功能具有共性,主要有以下几个方面:(1)筹资与投资的功能。
这是金融投资最基本的功能。
筹资是金融商品服务筹资主体的功能,投资是金融商品服务投资主体的功能。
社会经济发展的最终决定力量是其物质技术基础,物质技术基础的不断扩大、提高必须依靠实业投资。
(2)分散化与多元化功能。
金融投资促进了投资权力和投资风险分散化,同时又创造了多元化的投资主体集合。
金融投资把投资权力扩大到了整个社会。
(3)自我发展功能。
金融投资具有一种促进自己不断创新和发展的内在机制。
(4)资源配置优化功能。
货币是经济增长的第一推动力和持续动力,因此如筹集货币和分配货币并通过货币的分配而优化整个经济系统的资源配置,是经济运行的首要问题。
金融投资为有效地利用货币资本和优化资源配置提供了条件。
(5)经济运行的调节功能。
金融投资对国民经济运行的反应十分灵敏,能够充分地展现出经济运行的动向。
经济发展前景看好,金融投资的价格就上升。
(6)增值与投机功能。
金融投资本质上是货币资本的运动,货币资本自身具有增值的要求。
金融投资在这里充当其货币资本增值的工具。
投机性,产生于金融商品的性质和市场价格的波动以及相应的交易制度。
3.投资和投机的区别表现在五个方面:(1)交易目的不同。
股票投资者关心的是本金的安全,并在本金安全的基础上获得长期稳定的股息收入;而投机者则期望在短期的价格涨跌中取得资本所得。
(2)持有时间不同。
投机动机的实施者一般持有股票时间都在一年以上;而投机者的持有期限可能只有几月、几周,甚至几天、几小时。
(3)风险倾向不同。
投资动机者的准则是"安全第一",宁可少一点收益也不愿承担过大的风险。
在选择投资对象时,多看好公司经营状况好,发展前景好,股价稳中有升的股票。
投资动机者则不同,他们多是以"收益第一"作为投资准则,为了可观的收益,宁愿冒很大的风险,所以他们通常热衷于股价波动大的中小公司股票,特别是那些有周期性价格变化规律的股票。
(4)交易方式不同。
从事投资动机的资金主要来源于自身积蓄,在投资实施时伴随着实际的交割,即投资者买卖股票的同时进行货币收付;而用于投机的资金多从他人处借得,其交易方式主要是买空和卖空,并不伴随实际的交割行为。
(5)投资的决策依据不同。
投资行为的做出基于对股票发行公司的分析考察;投机行为则侧重于对市场行情短期变化的预测。
4. 金融投资和实物投资的区别实物投资主要是以实物资产为对象,是投入资金,以建造或购置固定资产和与之相联系的流动资产而取得利益的一种实际资产化的过程。
实物资产是金融资产存在和发展的基础,金融资产的收益最终来源于实物资产在社会再生产过程中的创造。
金融投资都是以货币资金转化为金融资产,都没有实现为实物资产,因而也没有引起社会再生产扩大和社会总投资的增加。
只有当金融投资被直接投资者运用于直接投资时,才使社会总投资增加和社会再生产规模扩大。
但金融投资之所以成为一种重要的投资形式,主要是因为金融投资把社会闲散资金迅速集中起来,从而形成巨额资金流入直接投资者手中,这必然加速和扩大了直接投资的规模,促进了经济的增长。
随着商品经济的充分发展,市场经济的高度完善,银行和信用的作用越来越大,金融市场越来越成熟完善,股份公司越来越普遍,金融投资在聚集投资资金方面的作用也越来越重要。
5.BSV(1996)模型假定投资者在决策时存在两种偏差:一是相似性偏差,即基于近期数据与某种模式(比如股票上升或下降通道)的相似性来预测,过分重视近期数据。
这会造成投资者对新信息反应过度,认为近期股价的变化反映了其未来变化的趋势,从而错误地对价格变化进行外推。
二是保守性偏差,即不能及时根据变化了的情况修正自己的预测,这会造成投资者对新信息反应不足,认为股票收益的变化只是一种暂时现象,投资者未根据收益的变化充分调整对未来收益的预期,当后来的实际收益与先前的预期不符时才进行调整。
投资者在相似性偏差和保守性偏差之间的状态转移遵循贝叶斯法则。
6.随着商品经济的发展,金融投资在市场经济中的作用越来越大,但需要指出,金融投资之所以成为一种重要的投资形式,主要是因为金融投资把社会闲散资金迅速集中起来,从而形成巨额资金流入直接投资者手中,这必然加速和扩大了直接投资的规模,促进了经济的增长。
而且随着我国市场机制的日益完善,银行和信用的作用越来越大,金融市场越来越成熟完善,股份公司越来越普遍,金融投资在聚集投资资金方面的作用也越来越重要。
通过发行股票与债券,使投资主体多元化,聚集了社会上的闲散资金,用于企业的发展,用于赚取利润。
金融投资还为有效的利用货币资本额和优化资源配置提供了条件。
可以说提供了一个渠道与方式。
7.投机是促成市场流动的基本组成部分,在市场经济中发挥着不可欠缺的功能。
它在与投资和其他经济活动正确结合,相互作用的条件下,不仅对市场无害,而且有一定的积极作用。
这在期货市场、证券市场、外汇市场上表现尤为明显。
投机的经济功能主要表现为以下几点:(1)承担交易风险。
在证券和期货市场上,投机者是和保值者相辅相成的。
保值者的目的是为了获得合理的正常的稳定经营收入,因此他们往往利用套头交易等方式逃避风险。
而投机者则是专门承担价格波动风险的,以期通过风险来赚钱。
承担风险已成为投资者的一种专业化职能,没有投机者也就没有风险的承担者。
投机者承受风险才能使旨在保值的投机者能顺利避险。
(2)价格平衡。
在正常情况下市场价格是随着供求关系的变化而上下波动的,供过于求则价格下降,供不应求则价格上升。
而投机者所遵循的原则是低价买、高价卖,当市场供大于求时,价格很低,投机者大量低价购进,吸收剩余,实际上是增加了市场需求,减小了供求缺口,使价格不致下降到过低水平;而当供小于求时,价格很高,投机者大量卖出,客观上增加了市场供给,消除部分短缺,同样减少供求缺口,使价格不致上升到过高水平。
所以,投机行为可以缓和价格波动,使商品的生产者和使用者不致因价格的暴跌或暴涨而蒙受太大的损失,即投机行为可以为生产者和使用者创造一个相对稳定的市场环境。
(3)活跃市场。
体现在一个市场能够迅速地向某一个买方或卖方提供他们要交易的对象;还要在不发生过度的价格波动下,有承受交易的能力,使大量大交易迅速完成。
投机活动在证券、外汇、期货市场上能起到催化与润滑作用,使市场活跃起来,增加市场的流动性。
(4)使相关市场或产品趋于协调。
市场上各商品之间常具有高度相关性。
在一定的市场情况下,这些竞争性商品的价格有一定的比例关系,投机者常仔细研究这种关系。
当一种商品与另一种商品的价格关系脱节时,由于投机者的作用,将会使市场间逐渐恢复一致。
8. 做市商制度的功能①具有市场价格稳定功能。
在做市商制度中,交易的买卖价格由做市商集合市场信息后公布,即使投资者的市场预期不好,报出超低市场价格的卖盘,只要做市商不供给相应的买价,交易就不能形成。
从而做市商可根据自身信息较全面的优势,稳定市场价格,避免由于投资者的不合理市场预期而造成的市场价格大起大落。
②具有保持市场流动性的功能。
做市商在交易中既充当交易的买方又充当交易的卖方,这使市场的交易不会因为交易单边的缺失而中断。
例如,在我国现行的证券市场涨停制度下,有时会出现好的股票买不到,差的股票卖不掉的现象,这就是交易单边缺失而发生的交易中断。
在做市商制度下,做市商依据自身的实力,可以根据市场的需求进行买入和卖出的报价,并且可以针对市场的需求进行单独报价,从而满足投资者的买卖愿望,增强了市场在边缘位置的活跃性。
第二章能力训练答案选择题思考题1.债券投资所带来的收益有以下3种:①利息收入,除了中央政府或联邦政府发行的债券免税之外,也适用于所得税。
②资本损益,如果有收益的话,适用于资本利得税。
在中国,尚未开征这类税种。
③将利息作再投资所得到的收益。
2.每股净收益突出了相对价值的重要意义。
某家上市公司的税后利润的绝对数即便很高,倘若由于其总股本非常大,每股净收益因此较低的话,该公司股票的市价肯定不会高;反之,每股净收益的数额大则意味着企业有潜力增发股利或增资扩大生产经营规模,公司股票的价格会因此而稳步上升。
3.具有上述复杂资本结构的企业,必须同时列示两个每股净收益的数据:一个?quot;原始的每股净收益",即将可转换的有价证券作为一般的公司债券和优先股处理;另一个为"完全稀释后的每股净收益",即假定全部可转换的公司债券和优先股都按规定的调换比率转化为普通股。
这后一个每股净收益着眼于未来有可能发生的情况,旨在提醒股东们意识到,稀释对他们在公司所有权的比重所具有的潜在影响。
4.意义在于:它一方面衡量了股东们持有该种股票所获得的股息收益的高低情况;另一方面也为投资者揭示了出售这种股票或者放弃购买这种股票而转向别的投资所具有的机会成本。
5.①是贴现率以面值为计算基础,但投资者购买国库券时实际支付的金额小于面值,这也可以理解为投资的利息收益在购买国库券时就已取得;②是所有国库券的持有日都计息,但1年假设只有360天,即它是按365(6)/360方式的欧洲货币法来计息的。
6.到期收益率实际上是基于投资者持有债券直至到期日的假定。
但是,如果债券的期限比投资者的持有期要长,也就是说,投资者选择在到期前卖出债券,到期收益率则不能准确衡量投资者在持有期的回报率。
在债券到期前,如果利率上升,那么,投资者不仅从债券上获得了利息支付,还必须承担债券的资本损失。