全息干涉与散斑干涉综述
现代光学测试技术
从测量镜返回光束的光频发生变化,其频移为
,该
光与返回光会合,形成“拍”,其拍频信号可表示为:
计算机先将拍频信号
与参考信号
理后,就得到所需的测量信息 .
进行相减处
设在动镜移动的时间 t 内,由 为 N ,则有:
引起的条纹亮暗变化次数
上式中
为在时间t内动镜移动的距离L,于是有:
单击此处添加大标题内容
第三章 散斑技术 散斑的形成及其性质 当一束激光射到物体的粗糙表面(例如铝板)上时,在铝板前面的空间将布满明暗相间的亮斑与暗斑;
一、双频激光外差干涉仪图
1 -141 示出双频激光外差干涉仪的光学系统。干涉仪的 光源为一双频 He-Ne 激光器,这种激光器是在全内腔单频 He-Ne 激光器上加上约 300 特拉斯的轴向磁场,由于塞曼 效应和频率牵引效应,使该激光器输出一束有两个不同频率的 左旋和右旋圆偏振光,它们频率
差 Δν约为 1.5MHz 。这两束光
1 -5 长度(间隔、高度、振幅)的激光干涉测量
一.
激光干涉测长的工作原理及特点
干涉测长仪器是用光波波长为基准来测量各种长度(如属测量干涉场上指定点上位相随时间而变化的干涉仪。
激光干涉测长仪与用其它准单色光源的干涉测长仪相比,具有下列的显著优点:
激光干涉测 长的工作原 理如图 1101 所示。
单击此处添加大标题内容
1 -6 激光外差干涉测长与测振 激光光波干涉比长仪以光波波长为基准来测量各种长度,具有很高的测量精度。这种仪器中, 由于动镜在测量时一般是从静止状态开始移动到一定的速度,因此干涉条纹的移动也是从静止 开始逐渐加速,为了对干涉条纹的移动数进行正确的计数,光电接收器后的前置放大器一般只 能用直流放大器,而不能用交流放大器,因此在测量时,一般对测量环境有较高的要求,一般 的干涉比长仪不能 用于车间现场进行精密测量。为了适应在车间现场实现干涉计量的需要,必 须使干涉仪不仅具有高的测量精度,而且还要具有克服车间现场中气流及灰雾引起的光电信号 直流漂移的性能,光外差干涉 技术是为解决车间现场测量问题而发展起来的。 这种技术的一个共同点是在干涉仪的参考光路中引入具有一定频率的副载波,干涉后被测信号 是通过这一副载波来传递,并被光电接收器接收,从而使光电接收器后面的前置放大器可以用 一交流放大器代替常规的直流放大器,以隔绝由于外界环境干扰引起的直流电平漂移,使仪器 能在车间现场环境下稳定工作。
全息技术的原理及应用论文
全息技术的原理及应用论文引言全息技术是一种基于光波干涉原理的成像技术,可以捕捉和再现真实物体的全方位信息。
从20世纪中叶开始,全息技术便逐渐应用于不同领域,如科学研究、医学、教育等。
本文将介绍全息技术的原理以及其在不同领域中的应用。
全息技术的原理全息技术的原理是基于光的波动性和波干涉原理。
在使用全息技术进行成像时,需要使用一个激光光源和一个光敏材料。
首先,将激光光源发射的单色激光束分成两束,其中一束称为参考光束,另一束称为物光束。
接着,将物体放置在物光束的路径上,并使物光束与参考光束相交。
当物体被照射到时,它会散射物光束,形成一个由光波构成的复杂干涉图案。
最后,将散射的物光束与参考光束合并,并投射到光敏材料上。
光敏材料会根据干涉图案的强度和相位记录下光波的振幅和相位信息。
全息图像的特点是,不同于传统的二维影像,它可以在各个角度重现真实物体的全方位信息。
这是因为全息图像记录了整个光波的信息,而传统的二维影像只能记录到部分光波信息。
全息技术在科学研究中的应用全息技术在科学研究中有着广泛的应用。
以下是一些主要的应用领域:•光学研究:全息技术可以用于光波的干涉和衍射研究,帮助科学家深入了解光的特性和行为。
•生物医学研究:全息技术可以用于三维细胞成像和组织结构分析,为生物医学研究提供了重要的工具。
•简化分析:全息技术可以用于分析复杂的物理和化学过程,例如燃烧过程的分析和流体力学的研究。
全息技术在医学中的应用全息技术在医学中也有着重要的应用。
以下是一些主要的应用领域:•三维成像:全息技术可以用于对人体器官和组织进行三维成像,为医生提供更全面的诊断信息。
•手术规划:全息技术可以帮助医生进行手术规划,减少手术风险,并提高手术成功率。
•医学教育:全息技术可以用于医学教育中的虚拟解剖学实验和模拟手术培训,提高学生的学习效果。
全息技术在教育中的应用全息技术在教育中的应用也越来越广泛。
以下是一些主要的应用领域:•互动课堂:全息技术可以用于创造一个互动的教学环境,使学生更加主动地参与学习。
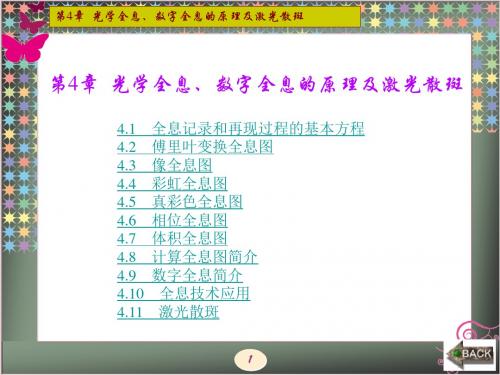
现代光学第4章 光学全息 数字全息的原理及激光散斑 共192页
21
第4章 光学全息、数字全息的原理及激光散斑
图4.2-1中,记录物体为一透明图片,位于透镜的前焦 平面上; 参考点光源(针孔)与物共面,位置坐标为(-b,0); 记录介质位于透镜的后焦面。用相干单色平面波垂直入射 照明物面时,透明图片后表面上的光波场复振幅分布 即为物光的复振幅,表示为 O(x0,y0), 在记录平面即透 镜的后焦面上得到其傅里叶变换为
光强分布为
(4.1-3)
(4.1-4)
5
第4章 光学全息、数字全息的原理及激光散斑
在线性记录条件下,全息图的振幅透射系数为
(4.1-5) 再现时,设照明全息图的光波场在全息图上的复振幅 分布为
(4.1-6)
6
第4章 光学全息、数字全息的原理及激光散斑
则透过全息图光波的复振幅分布为
(4.1-7) 式中: 第一项是直射光; 第二项是原始像(含O); 第三项 是共轭像(含O*)。 这就是全息照相的基本公式。应当指出, 一般情况参考光是平面波或球面波,可看成是点光源; 而 物体都有一定的大小,可看成点光源的线性组合,则
对于原始像,有
可见,原始像和物完全重合。
(4.1-18)
13
第4章 光学全息、数字全息的原理及激光散斑
对于共轭像,有 (4.1-19)
14
第4章 光学全息、数字全息的原理及激光散斑
4.1.3 再现像的放大率 1. 横向放大率 当物光和参考光的夹角不大时,横向放大率定义为
(4.1-20)
应用式(4.1-17),分别求关于xi和xO的一阶导数,得到横向 放大率的显式表达式为
(4.2-4)
26
第4章 光学全息、数字全息的原理及激光散斑
数字散斑干涉(DSPI)研究的文献综述
数字散斑干涉振动测量技术研究进展摘要:数字散斑干涉技术(DSPI)是一种光学测试方法,具有非接触、高灵敏度、全场、实时、无损检测的特点,在振动测量方面有着较大的优势。
本文从图像处理、相移技术等方面阐述了数字散斑干涉振动测量的发展现状,并对其中的关键技术进行了比较和分析。
关键词:数字散斑干涉,振动测量,数字图像处理,相移技术Research Progress on V ibration Measurement Using Digital SpecklePattern InterferometryAbstract:Digital speckle pattern interferometry (DSPI) is an optical testing and measuring method,a non-contact, high-sensitivity, full-field, real-time, non-destructive one, which has an advantage in vibration analysis. This paper introduces the recent progress on DSPI vibration measurement from aspects of digital image processing and phase shifting, also compares and analyzes their key technologies.Keywords:Digital speckle pattern interferometry; Vibration measurement; Digital image processing; Phase shifting0 引言散斑计量技术是现代光测力学技术中的一种。
它具有非接触、无损、全场、高精度、实时测量的特点,在轮廓、应变、位移和振动测量方面有着广泛的应用前景[1]。
全息干涉原理

全息干涉原理
全息干涉原理是一种基于光学干涉的技术,它可以将物体的三维信息记录在一张平面上,从而实现全息图的制作。
全息干涉原理的核心是光的干涉,即两束光线相遇时会产生干涉现象,这种现象可以用来记录物体的形状和位置信息。
全息干涉原理的实现需要使用激光光源和全息板。
激光光源可以产生一束相干光,而全息板则是一种特殊的光学元件,它可以记录光的干涉图案。
在制作全息图时,首先需要将物体放置在激光光束的路径上,使得物体可以反射或透过光线。
然后,将全息板放置在物体和光源之间,使得光线可以通过全息板并记录下物体的干涉图案。
全息干涉原理的优点是可以记录物体的三维信息,而且可以在不同角度下观察全息图,从而获得更加真实的物体形状。
此外,全息图还可以用于光学存储和信息传输等领域。
然而,全息干涉原理也存在一些限制。
首先,制作全息图需要使用激光光源和全息板等专业设备,成本较高。
其次,全息图的制作过程需要较长的时间和精密的操作,对操作人员的技术要求较高。
最后,全息图的观察需要使用特殊的光源和光学设备,不太方便。
全息干涉原理是一种重要的光学技术,它可以记录物体的三维信息,具有广泛的应用前景。
随着科技的不断发展,相信全息干涉原理将会得到更加广泛的应用和发展。
全息技术的原理及应用现状

全息技术的原理及应用现状引言全息技术是一种记录和再现三维空间中物体的光学技术,通过使用干涉和衍射原理,可以将物体的完整三维信息记录在一张平面上,然后再通过光的照射将其再现出来。
全息技术广泛应用于各个领域,包括科学研究、医学、艺术等。
本文将介绍全息技术的原理以及其在不同领域的应用现状。
全息技术的原理全息技术的原理基于光的干涉和衍射现象。
当一束激光照射到物体上时,物体会对光进行散射,产生波前形状。
然后,将物体放在光敏材料上,再次用同一波长和相干性的光照射,光将被散射和干涉,形成一个复杂的光场。
通过光场的干涉和衍射,可以记录下物体的三维信息。
全息技术的记录过程1.激光照射:将一束激光照射到物体上。
2.光的散射:物体对激光进行散射,形成波前形状。
3.干涉记录:将散射光与参考光(激光)进行干涉,形成干涉图样。
4.光敏材料的记录:将干涉图样记录在光敏材料上。
5.固定显影:用化学处理将记录在光敏材料上的图样固定。
全息技术的再现过程1.激光照射:将同一波长和相干性的激光照射在光敏材料上。
2.衍射复现:照射光通过光敏材料,衍射生成原始物体的复原波前。
3.人眼观察:人眼通过观察这个复原波前,再现出原始物体的三维信息。
全息技术在科学研究中的应用全息技术在科学研究中发挥了重要的作用,以下是一些主要应用:1.显微镜技术的改进:全息显微镜能够实现超分辨率成像,使得科学家能够观察到更细微的结构和细胞。
全息显微镜在生物医学研究中有很大的应用潜力。
2.全息光刻技术:全息光刻技术是一种制备微纳米结构的关键技术。
它可以将光的干涉和衍射原理应用于光刻工艺中,实现高分辨率和高精度的微纳米结构制造。
3.全息光学存储:全息光学存储是一种基于全息技术的数据存储技术,可以实现大容量、高速的数据存储。
它在信息技术领域有着广泛的应用前景。
全息技术在医学中的应用全息技术在医学领域有着广泛的应用,以下是一些主要应用:1.医学成像:全息技术可以实现三维医学成像,提供更准确的诊断信息。
全息技术的物理原理和应用
全息技术的物理原理和应用全息技术是一种将物体的全息图像记录下来,并能够重现出物体三维图像的技术。
它起源于20世纪60年代,并在短时间内引起了极大的关注。
全息技术的物理原理是非常复杂的,并且对材料、光源和记录条件要求极高。
在本篇文章中,我们将深入探究全息技术的物理原理和应用。
一、全息技术的物理原理全息技术的物理基础是光的干涉现象。
当两束光线穿过相同的区域时,它们将产生干涉。
这种干涉可以分为两种类型:同相干和非同相干。
同相干干涉是指两束光线的波长完全相同,相位相同,并且在时间和空间上都非常相似。
在这种情况下,两束光线相遇后会发生增幅干涉,也就是叠加。
这种干涉会在空间中形成明暗相间的条纹,称为干涉条纹。
非同相干干涉则是指两束光线的波长不同,或者相位不同,或者它们在时间和空间上不相似。
在这种情况下,两束光线相遇后会发生减幅干涉,也就是衰减。
这种干涉不会产生干涉条纹,但会产生全息图。
全息图是一种在空间和时间上记录了物体的全部信息的记录介质。
全息图是由两部分组成的:参考波和物波。
参考波是光学记录介质上的一束平行光线。
当这束光线照射到记录介质上时,它被分为两束,一束照射到物体上,一束被反射回来。
物波是反射回来的光线,它会将物体的信息传输到记录介质上,并与参考波产生干涉。
当物波和参考波相遇时,它们会产生干涉条纹,并记录在光学记录介质上。
这种记录方式称为全息记录。
全息记录的强度和相位信息被记录下来,因此,可以通过读取记录介质来重现物体的三维图像。
二、全息技术的应用由于全息技术可以记录物体的全部信息,因此在各个领域都有广泛的应用。
以下是几种典型的应用:1. 全息显微镜全息显微镜是一种利用全息技术来增强传统光学显微镜分辨率的设备。
它可以识别出非常小的细胞和细胞组织,还可以在细胞内部观察分子的行为。
2. 全息相机全息相机是一种可以拍摄物体三维图像的相机。
它使用全息记录介质来记录物体的全部信息,并通过读取记录介质来重现物体的三维图像。
物理实验中微小位移量的几种光学测量方法
物理实验中微小位移量的几种光学测量方法在物理实验中,测量微小位移量是非常重要的。
微小位移量的测量可以用来研究物体的运动规律和性质,同时也可以应用到各种不同的领域,例如工程、医学、空间科学等。
光学测量方法是一种常用的方法,它采用光学原理来测量微小位移量,具有非接触性、高精度和高灵敏度等优点。
本文将介绍几种常用的光学测量方法,包括差动测量法、干涉测量法、激光测量法和数字全息测量法,并对它们的原理、应用和优缺点进行详细介绍。
差动测量法是一种基于两束光的相位差来测量微小位移量的方法。
它的基本原理是将两束光沿不同的光路传播,然后再将它们进行合并,通过比较两束光的相位差来测量位移量。
差动测量法在实际应用中有多种实现方式,例如双臂激光干涉仪、激光多普勒测速仪等。
双臂激光干涉仪是最常见的一种实现方式,它采用激光作为光源,通过将激光分为两束,分别沿不同的光路传播,并最终在相位板上进行叠加来进行测量。
在测量时,当被测物体发生微小位移时,两束光的相位差会发生变化,通过测量这种相位差的变化就可以得到位移量。
差动测量法在很多领域都有广泛的应用,例如机械工程、光学工程、材料科学等。
它具有非接触性、高精度和稳定性的优点,在微小位移量的测量中有着很高的应用价值。
但是,差动测量法也有一些缺点,例如对环境条件要求较高,需要较长的测量时间,同时对系统的稳定性和复杂性也有一定要求。
干涉测量法是一种基于光的干涉现象来测量微小位移量的方法。
干涉测量法的基本原理是利用干涉仪的干涉图样来测量光的相位差,从而得到被测物体的位移量。
干涉测量法在实际应用中有多种实现方式,例如薄膜干涉法、多束干涉法和全息干涉法等。
薄膜干涉法是一种常见的实现方式,它采用薄膜反射镜或衍射光栅等器件来产生干涉图样,通过测量干涉图样的变化来测量位移量。
在测量时,通常需要通过对干涉图样进行处理,例如通过解调或者数字图像处理等方式,来得到被测物体的位移量。
干涉测量法在很多领域都有广泛的应用,例如半导体制造、光学显微镜、生物医学等。
光栅大错位数字散斑干涉系统及其应用研究
光栅大错位数字散斑干涉系统及其应用研究
谢蒙萌;杨勇;姜锦虎;陶宝祺
【期刊名称】《力学季刊》
【年(卷),期】2000(21)2
【摘要】本文用统计光学理论简要阐述了大错位数字散斑干涉的原理及特点,并在此基础上首次提出利用光栅作为错位元件的光栅大错位数字散斑干涉。
该方法具有与全息干涉计量相同的灵敏度,光路简单,结构紧凑,波像差小,防震要求低等特点。
文中对该方法进行了详细的原理分析与介绍,利用其对典型试件受均布载荷下的离面位移场进行测量,通过理论值与实验结果的比较,表明该方法的可行性。
该方法拓宽了散斑干涉技术的适用范围,为实际生产中的物体离面位移测量提供了新的手段。
【总页数】5页(P225-229)
【关键词】大错位;数字散斑;光栅;干涉系统
【作者】谢蒙萌;杨勇;姜锦虎;陶宝祺
【作者单位】南京航空航天大学;苏州大学物理科学与技术学院
【正文语种】中文
【中图分类】O348.1
【相关文献】
1.基于光栅大错位数字散斑干涉的无损检测技术 [J], 谢蒙萌;陶宝祺;姜锦虎
2.基于方棱镜的大错位电子散斑干涉形貌测量技术 [J], 孙平;于立国;高秀梅
3.一种可实现电子散斑干涉的新型大错位方棱镜 [J], 刘瑞金;孙平
4.大错位量散斑干涉法测量残余应力 [J], 乌时毅;秦玉文
5.光栅大错位数字散斑干涉仪 [J], 谢蒙萌;络英;黄睿;姜锦虎
因版权原因,仅展示原文概要,查看原文内容请购买。
光学实验利用全息照相技术记录和还原光场
光学实验中全息照 相技术的应用
原理:利用全息干涉技术对物体表面形貌进行测量和计量 应用领域:光学、机械、航空航天、生物医学等 优点:非接触、高精度、高分辨率、测量速度快 未来发展:提高测量精度和稳定性,拓展应用领域
应用领域:光学、机械、航 空航天等
定义:利用全息技术记录散斑 干涉图,实现对物体表面形貌 的精确测量
实验环境:保持实验环境暗淡, 减少干扰光的影响
记录数据:及时记录实验数据, 以便后续分析和处理
数据分析:对全息照相实验数据进行定量和定性分析,包括光强分布、相位恢复等。 数据处理:采用数字信号处理技术对全息图进行滤波、去噪、增强等操作,提高成像质量。 实验技巧:掌握全息照相实验的技巧和方法,如光源选择、曝光时间控制、实验环境搭建等。 误差分析:对实验数据进行误差分析和评估,确保实验结果的可靠性和准确性。
穿戴防护眼镜和实验服 避免直接接触实验器材和化学品 严格按照实验操作规程进行实验 实验后及时清理现场并检查设备安全
感谢您的观看
汇报人:
应用价值:全息记录和再现散斑干涉现象,有助于研究光学元件表面的微观结构和性 能,提高光学元件的制造精度和稳定性。
实验目的:利用全息照相技术实现光学信息存储 实验原理:利用全息干涉原理记录和再现光波前的振幅和相位信息 实验步骤:制作全息图、存储和读取光学信息 实验结果:成功实现光学信息的全息存储和再现
稳定性问题:全息照相技术需要在稳定的环境条件下进行,以避免图像失真或模糊。这使得在某些不稳定的实验 环境中,如地震或海浪等,难以获得高质量的全息图像。
优势和局限性: 全息照相技术 在光学实验中 的优势和局限
性
发展趋势:全 息照相技术未 来在光学实验 领域的发展趋
势和方向
- 1、下载文档前请自行甄别文档内容的完整性,平台不提供额外的编辑、内容补充、找答案等附加服务。
- 2、"仅部分预览"的文档,不可在线预览部分如存在完整性等问题,可反馈申请退款(可完整预览的文档不适用该条件!)。
- 3、如文档侵犯您的权益,请联系客服反馈,我们会尽快为您处理(人工客服工作时间:9:00-18:30)。
全息干涉与散斑干涉技术综述报告全息干涉无损检测技术是无损检测技术中的一个新分支,它是20世纪60年代末期发展起来的,是全息干涉计量技术的重要应用。
我们知道结构在外力的作用下,将产生表面变形。
若结构存在缺陷,则对应缺陷表面部位的表面变形与结构无缺陷部位的表面变形是不同的。
这是因为缺陷的存在,使得缺陷部位的结构的刚度、强度、热传导系数等物理量均发生变化的结果。
因而缺陷部位的局部变形与结构的整体变形就不一样。
应用全息干涉计量技术就可以把这种不同表面的变形转换为光强表示的干涉条纹由感光介质记录下来。
而激光散斑技术是在激光全息实验中,我们观察被激光所照射的试件表面,就可以看到上面有无数的小斑点,因而观察不到条纹,因此在前期,散斑是被看作是噪声来对待的,直到随着人们对全息干涉技术的进一步了解,才发现虽然这些斑点的大小位置都是随机分布的,但所有的斑点综合是符合统计规律的,在同样的照射和记录条件下,一个漫反射表面对应着一个确定的散斑场,即散斑与形成散斑的物体表面是一一对应的。
在一定范围内,散斑场的运动是和物体表面上各点的运动一一对应的,这就启发人们根据散斑运动检测,来获得物体表面运动的信息,从而计算位移、应变和应力等一些力学量。
因此全息和激光散斑方法由于其固有的高灵敏度,在非破坏性测试领域发现了越来越多的应用。
可探测到表面及地下的裂缝、空洞、脱层和分层等缺陷。
由于这些方法测量了在外部加载或其他条件的影响下,在这三个维度下研究对象的变形,它们也可以用于质量控制,也可以用于设计阶段。
激光散斑的方法,还利用了电子检测和处理的发展(称为电视全息术),并可用于实时定量评价。
本综述报告主要介绍利用光纤光刻技术,对全息和激光散斑测量方法进行了全面的研究,这两种方法都适用于焊接、复合材料的检验。
IntroductionHolography is a two step process of recording a wavefrontand then reconstructing the wave. While Holography is oftenused to obtain the recreations of beautiful 3-dimensional scenes,there are several engineering applications, the most common andimportant one being Holographic Non-Destructive Testing . Thisis accomplished with holographic interferometry, whereininterferometry is carried out with holographically generatedwavefronts .A speckle pattern is generated when an object with a roughsurface is illuminated with a highly coherent source of lightsuch as laser. Initially this speckle noise was considered asthe bane of holographers, until it was realized that these specklescarry information about the surface that produce them. Again,as in the case of holography, the combination of interferometric concepts with speckle pattern correlation gave rise to speckle interferometry . The developments in electronic detection and processing further added wings to laser speckle methods giving rise to Electronic Speckle Pattern Interferometry (ESPI), or “TV Holography”. This paper describes a brief outline of holographic and speckle methods for Non-Destructive Testing applications, wherein the deformations of an object under load are measured in a non-contact way. Measurement of surface shapes using contouring and derivatives of displacement using Shearography are also presented.1.HolographyThe schematic for recording a hologram is shown in Fig.1. The light from a laser is split into two beams. One beam illuminates the object and the other beam is used as a reference. At the recording plane, an interference of theFig. 1 : Experimental arrangement for recording a hologram. wavefront scattered by the object with the reference wavefront takes place. A recording is made on a high resolution photographic plate. The developed plate, now called a “Hologram”, when illuminated by the reference wave, reconstructs the object wave. There are several recording geometries such as in-line, off-axis, image plane, Fourier Transform, reflection and rainbow holograms. The theory behind the recording and reconstruction of object wavefront is well documented .1.1Holographic Interferometry (HI)While holography is used to obtain recreations of beautiful 3-D scenes, most engineering applications of holography make use of its ability to record slightly different scenes and display the minute differences between them. This technique is called Holographic Interferometry (HI). Herewe deal with Interference of two waves of which atleast one of the waves is generated holographically.Methods of Holography Interferometry are classified as (i) Real-time HI, (ii) Double-Exposure HI, and (iii) Time average HI. In holographic interferometry, we record the holograms of the two states of an object under test, one without loading and one with loading. When such a doubly exposed hologram is reconstructed, we see the object superposed with a fringe pattern which depicts the deformation undergone by the object due to loading. The theory behind the fringe formation in HI is as follows [3]:Let the O1 and O2 represent the undeformed and deformed object waves, which are written asO1(x,y) = |O(x,y)| exp[-i Φ(x,y)] (1)O2(x,y) = |O(x,y)| exp[-i Φ(x,y) + δ] (2) where δis the phase change due to displacement or deformation of the object. The intensity due to superposition of these two waves isI(x,y) = |O1(x,y) + O(x,y)|2= O1O1* + O2O2* + O1O2* + O1* O2= I1 + I2+ 2I1I2Cos δ(3)where I1 and I2 are the intensities of O1 & O2. The Phase Difference δ is given byδ = (K2-K1).L (4)where K2 is the observation vector, K1 is the illumination vector and L is the displacement vector. Thus the evaluationof the phase δis gives the displacement. The fringes formed represent contours of constant displacement.1.2Holographic Non-Destructive Testing (HNDT)This powerful technique of Holographic interferometry, is an invaluable aid in Engineering design, Quality Control and Non-Destructive testing and Inspection. In HNDT, the object under study is subjected a very small stress or excitation and its behavior is studied using HI.The defects in the object can be spotted as an anomaly in the otherwise regular fringe pattern. HNDT is a highly sensitive, whole-field, non-contact technique and is applicable to objects of any shape and size. The types of excitation used for HNDT are mechanical, thermal, pneumatic or vibrational. Defects such as cracks, voids, debonds, delaminations, residual stress, imperfect fits, interior irregularities, inclusions could be seen. HNDT is applied to inspect the disbonds between the plies of an aircraft tyre, delamination of the composite material of a helicopter rotor blade, PCB inspection, rocket castings, pressure vessels, andso on.Use of double-pulsed laser makes HI more attractive for study of transients and impact loads. Fig.2 shows the double exposure hologram of a turbine blade subjected to an impact loading (recorded using a double-pulsed Ruby laser).Fig. 2 : Double-pulse hologram of a turbine blade impact loaded with a small metallic ball.Time average HI, wherein a hologram of a vibratingobject is recorded, provides information about the modes and the vibration amplitudes at various points on the object. Figs.3(a) and (b) show the time average holograms of a rectangular plate vibrating at 1826 Hz and 5478 Hz, from which the resonant mode patterns could be easily studied . In HNDT, this technique is used for study of vibrations of machinery, car doors, engines and gear boxes and to identify the points where they should be bolted to arrest the vibration and noise.Fig. 3 : (a) and (b) Time averaged hologram of a centrally clamped plate at (0,0) and (1,0) mode when vibrated at 1826 Hzand5478Hz respectively2 22 22. Electronic Speckle Pattern Interferometry(ESPI)Recent holographic applications in engineering use a video camera for image acquisition, which is coupled to a computer image processing system. This is termed as TV Holography, though technically called Electronic Speckle Pattern Interferometry (ESPI). The technique makes use of the speckle pattern produced when an object with a rough surface is illuminated with a laser [4-6]. The correlation between the speckle patterns, before and after an object is deformed, are carried out using image processing techniques. Figure 4 shows the schematic of an ESPI system. The object is illuminated by the light from a laser and is imaged by a CCD camera. An in-line reference beam, derived from the same laser, is added at the image plane. The specklecorrelation is carried out by storing an image while the object is in its initial state, and subtracting the subsequent frame fromthis stored frame, displaying the difference on the monitor. When the object is subjected to some loading or excitation, the correlated areas appear black while the uncorrelated areas would be bright, resulting in a fringe pattern. As in HI,the fringes represent contours of constantdisplacement of the object points.The fringe formation in ESPI is well documented . The intensity distributions I 1(x,y) and 12(x,y) recorded before and after the object displacement respectively can be written asFig. 5 : Measurement of Poisson’s ratioI I (x,y) = a 1 +a 2 + 2a 1a 2 cos(ϕ) (5) I 2(x,y) = a 1 +a 2 + 2a 1a 2cos(ϕ+δ) (6)Fig. 4 : Experimental arrangement for ESPIFig. 6 : (a) Delamination in a plate (b) Longitudinal crack in asteel weldmentwhere a 1 and a 2 are the amplitudes of the object and reference waves, δ is the phase difference between them and ϕ is the additional phase change introduced due to the objectmovement. The subtracted signal as displayed on the monitor is given by,I 1 - I 2 = 4 |a 1a 2 Sin[ϕ + (δ/2)] Sin (d/2)|(7)Thus we find the brightness is modulated by a sine factor of the phase. The brightness on the monitor is maximumFig. 7 : Fiber Optic Shearography systemwhen δ = (2m +1)π and zero when δ = 2m π, which producesa fringe pattern on the monitor. The phase change δ is given by equation [4], the same as in holography. Figure 5 shows such an interferogram obtained by ESPI with a plate subjected to four-point bending, from which the Poisson’s ratio of the material of the plate could be calculated directlyfrom the smaller angle between the asymptotes of the hyperbolic fringes [8]. Figure 6(a) shows the delamination between two plates bonded together, while Fig. 6(b) shows a longitudinal crack in a weldments [9].4. Shearography In Shearography, we generate correlation fringes which are contours of constant slope of the out-of-plane displacement of an object under study . In this technique, one speckle field is made to interfere with the same speckle field, but sheared with respect to it. The subtractive correlation of the speckle patterns of the deformed and undeformed yields the derivatives of the displacement profile. Figure 7 shows the schematic of a fiber optic Shearography system. A double image of the laser illuminated object is made on the CCD camera. A small shear is introduced between the two images by tilting one of the mirrors. Incorporation of fiber optics makes the system very compactand the technique applicable to objects at inaccessible locations. Shearography is a very useful tool in experimental stress analysis and NDT as well. With the use of phase shifting techniques, the fringe patterns can also be automatically processed by the computer to obtainquantitative 3-dimensional plots . Figure 8 shows the results of an NDT application of Shearography to detect delamination in glass fiber reinforcedplastic (GFRP). The GFRP specimens were prepared withunidirectional glass fiber mat and epoxy resin with and without programmed defects. The defects were introduced by placing a thin Teflon film of 10 mm diameter and thickness 0.23mm between the layers of glass fiber mat during the lamination. Four layers of Glass fiber mat were used to make the laminate. The specimens were made in the form of circular diaphragm. The diaphragm was clamped along the edgesanFig. 8 : Slope fringes obtained on a circular GFRP specimen which was (a) Defect free (b) Having a programmed delaminationloaded mechanically at the center. The optical configuration of Fig. 8 was used, which is sensitive to the slope of the out- of-plane displacement. Figure 8(a) shows the fringes obtained with a defect-free specimen, while Fig. 8(b) shows the fringeswhen a delamination was introduced between the third and fourth layers. The defect site could be easily seen as a localized fringe. 全息无损检测主要还是采用全息干涉计量技术的三种方法进行,即实时全息干涉法,两次曝光全息法和时间平均全息干涉法。