财务报表分析中英文对照外文翻译文献编辑
财务管理财务分析中英文对照外文翻译文献

覆盖大量的可供选择的债券工具。由于债券市场的改革,出现了由企业发行的可供选择形式的债券工具。在第15章中,向你介绍了三种工具。我们然后致力于第一章提出的由企业负债发行的最具流动性的可供选择企业债券,企业首次发行的资产有价证券。
(文档含英文原文和中文翻译)
附录A
财务管理和财务分析作为财务学科中应用工具。本书的写作目的在于交流基本的财务管理和财务分析。本书用于那些有能力的财务初学者了解财务决策和企业如何做出财务决策。
通过对本书的学习,你将了解我们是如何理解财务的。我们所说的财务决策作为公司所做决策的一部分,不是一个被分离出来的功能。财务决策的做出协调了企业会计部、市场部和生产部。
1财务管理与分析的介绍
财务是经济学原理的应用的概念,用于商业决策和问题的解决。财务被认为有三部分组成:财务管理,投资,和金融机构:
■财务管理有时被称为公司理财或者企业理财。财务的范围就企业单位的财务决策的重要性划分的。财务管理决策包括保持现金流平衡,延长信用,获得其他公司借款,银行的借款和发行股票和基金。
覆盖项目租赁和项目资金融资。我们提供深度的项目租赁的内容在本书的第27章,阐明项目租赁的利弊,你在本书中会频繁的看到和专业的项目资金融资。项目融资的增长十分重要不仅对企业而言,对为了追求发展基础设施的国家也十分的重要。在第28章,本书提供了便于理解项目融资的基本原理。
早期介绍衍生工具。衍生工具(期货、交换物、期权)在理财中发挥着重要作用。在第4章向你介绍这些工具。而衍生工具被看作是复杂的工具,通过介绍将让你明确它们的基础投资工具特征。在早期介绍的衍生工具时,你可以接受那些评估隐含期权带来的困难(第9章)那些在资本预算中隐含的期权(第14章),以及如何运用隐含期权来减少成本及负债(第15章)。
财务报表分析中英文对照外文翻译文献
中英文对照外文翻译文献(文档含英文原文和中文翻译)原文:ANALYSIS OF FINANCIAL STATEMENTSWe need to use financial ratios in analyzing financial statements.—— The analysis of comparative financial statements cannot be made really effective unless it takes the form of a study of relationships between items in the statements. It is of little value, for example, to know that, on a given date, the Smith Company has a cash balance of $1oooo. But suppose we know that this balance is only -IV per cent of all current liabilities whereas a year ago cash was 25 per cent of all current liabilities. Since the bankers for the company usually require a cash balance against bank lines, used or unused, of 20 per cent, we can see at once that the firm's cash condition is exhibiting a questionable tendency.We may make comparisons between items in the comparative financial statements as follows:1. Between items in the comparative balance sheeta) Between items in the balance sheet for one date, e.g., cash may be compared with current liabilitiesb) Between an item in the balance sheet for one date and the same item in the balance sheet for another date, e.g., cash today may be compared with cash a year agoc) Of ratios, or mathematical proportions, between two items in the balance sheet for one date and a like ratio in the balance sheet for another date, e.g., the ratio of cash to current liabilities today may be compared with a like ratio a year ago and the trend of cash condition noted2. Between items in the comparative statement of income and expensea) Between items in the statement for a given periodb) Between one item in this period's statement and the same item in last period's statementc) Of ratios between items in this period's statement and similar ratios in last period's statement3. Between items in the comparative balance sheet and items in the comparative statement of income and expensea) Between items in these statements for a given period, e.g., net profit for this year may be calculated as a percentage of net worth for this yearb) Of ratios between items in the two statements for a period of years, e.g., the ratio of net profit to net worth this year may-be compared with like ratios for last year, and for the years preceding thatOur comparative analysis will gain in significance if we take the foregoing comparisons or ratios and; in turn, compare them with:I. Such data as are absent from the comparative statements but are of importance in judging a concern's financial history and condition, for example, the stage of the business cycle2. Similar ratios derived from analysis of the comparative statements of competing concerns or of concerns in similar lines of business What financialratios are used in analyzing financial statements.- Comparative analysis of comparative financial statements may be expressed by mathematical ratios between the items compared, for example, a concern's cash position may be tested by dividing the item of cash by the total of current liability items and using the quotient to express the result of the test. Each ratio may be expressed in two ways, for example, the ratio of sales to fixed assets may be expressed as the ratio of fixed assets to sales. We shall express each ratio in such a way that increases from period to period will be favorable and decreases unfavorable to financial condition.We shall use the following financial ratios in analyzing comparative financial statements:I. Working-capital ratios1. The ratio of current assets to current liabilities2. The ratio of cash to total current liabilities3. The ratio of cash, salable securities, notes and accounts receivable to total current liabilities4. The ratio of sales to receivables, i.e., the turnover of receivables5. The ratio of cost of goods sold to merchandise inventory, i.e., the turnover of inventory6. The ratio of accounts receivable to notes receivable7. The ratio of receivables to inventory8. The ratio of net working capital to inventory9. The ratio of notes payable to accounts payableIO. The ratio of inventory to accounts payableII. Fixed and intangible capital ratios1. The ratio of sales to fixed assets, i.e., the turnover of fixed capital2. The ratio of sales to intangible assets, i.e., the turnover of intangibles3. The ratio of annual depreciation and obsolescence charges to the assetsagainst which depreciation is written off4. The ratio of net worth to fixed assetsIII. Capitalization ratios1. The ratio of net worth to debt.2. The ratio of capital stock to total capitalization .3. The ratio of fixed assets to funded debtIV. Income and expense ratios1. The ratio of net operating profit to sales2. The ratio of net operating profit to total capital3. The ratio of sales to operating costs and expenses4. The ratio of net profit to sales5. The ratio of net profit to net worth6. The ratio of sales to financial expenses7. The ratio of borrowed capital to capital costs8. The ratio of income on investments to investments9. The ratio of non-operating income to net operating profit10. The ratio of net operating profit to non-operating expense11. The ratio of net profit to capital stock12. The ratio of net profit reinvested to total net profit available for dividends on common stock13. The ratio of profit available for interest to interest expensesThis classification of financial ratios is permanent not exhaustive. -Other ratios may be used for purposes later indicated. Furthermore, some of the ratios reflect the efficiency with which a business has used its capital while others reflect efficiency in financing capital needs. The ratios of sales to receivables, inventory, fixed and intangible capital; the ratios of net operating profit to total capital and to sales; and the ratios of sales to operating costs and expenses reflect efficiency in the use of capital.' Most of the other ratios reflect financial efficiency.B. Technique of Financial Statement AnalysisAre the statements adequate in general?-Before attempting comparative analysis of given financial statements we wish to be sure that the statements are reasonably adequate for the purpose. They should, of course, be as complete as possible. They should also be of recent date. If not, their use must be limited to the period which they cover. Conclusions concerning 1923 conditions cannot safely be based upon 1921 statements.Does the comparative balance sheet reflect a seasonable situation? If so, it is important to know financial conditions at both the high and low points of the season. We must avoid unduly favorable judgment of the business at the low point when assets are very liquid and debt is low, and unduly unfavorable judgment at the high point when assets are less liquid and debt likely to be relatively high.Does the balance sheet for any date reflect the estimated financial condition after the sale of a proposed new issue of securities? If so, in order to ascertain the actual financial condition at that date it is necessary to subtract the amount of the security issue from net worth, if the. issue is of stock, or from liabilities, if bonds are to be sold. A like amount must also be subtracted from assets or liabilities depending upon how the estimated proceeds of the issue are reflected in the statement.Are the statements audited or unaudited? It is often said that audited statements, that is, complete audits rather than statements "rubber stamped" by certified public accountants, are desirable when they can be obtained. This is true, but the statement analyst should be certain that the given auditing film's reputation is beyond reproach.Is working-capital situation favorable ?-If the comparative statements to be analyzed are reasonably adequate for the purpose, the next step is to analyze the concern's working-capital trend and position. We may begin by ascertaining the ratio of current assets to current liabilities. This ratioaffords-a test of the concern's probable ability to pay current obligations without impairing its net working capital. It is, in part, a measure of ability to borrow additional working capital or to renew short-term loans without difficulty. The larger the excess of current assets over current liabilities the smaller the risk of loss to short-term creditors and the better the credit of the business, other things being equal. A ratio of two dollars of current assets to one dollar of current liabilities is the "rule-of-thumb" ratio generally considered satisfactory, assuming all current assets are conservatively valued and all current liabilities revealed.The rule-of-thumb current ratio is not a satisfactory test ofworking-capital position and trend. A current ratio of less than two dollars for one dollar may be adequate, or a current ratio of more than two dollars for one dollar may be inadequate. It depends, for one thing, upon the liquidity of the current assets.The liquidity of current assets varies with cash position.-The larger the proportion of current assets in the form of cash the more liquid are the current assets as a whole. Generally speaking, cash should equal at least 20 per cent of total current liabilities (divide cash by total current liabilities). Bankers typically require a concern to maintain bank balances equal to 20 per cent of credit lines whether used or unused. Open-credit lines are not shown on the balance sheet, hence the total of current liabilities (instead of notes payable to banks) is used in testing cash position. Like the two-for-one current ratio, the 20 per cent cash ratio is more or less a rule-of-thumb standard.The cash balance that will be satisfactory depends upon terms of sale, terms of purchase, and upon inventory turnover. A firm selling goods for cash will find cash inflow more nearly meeting cash outflow than will a firm selling goods on credit. A business which pays cash for all purchases will need more ready money than one which buys on long terms of credit. The more rapidly the inventory is sold the more nearly will cash inflow equal cash outflow, other things equal.Needs for cash balances will be affected by the stage of the business cycle. Heavy cash balances help to sustain bank credit and pay expenses when a period of liquidation and depression depletes working capital and brings a slump in sales. The greater the effects of changes in the cycle upon a given concern the more thought the financial executive will need to give to the size of his cash balances.Differences in financial policies between different concerns will affect the size of cash balances carried. One concern may deem it good policy to carry as many open-bank lines as it can get, while another may carry only enough lines to meet reasonably certain needs for loans. The cash balance of the first firm is likely to be much larger than that of the second firm.The liquidity of current assets varies with ability to meet "acid test."- Liquidity of current assets varies with the ratio of cash, salable securities, notes and accounts receivable (less adequate reserves for bad debts), to total current liabilities (divide the total of the first four items by total current liabilities). This is the so-called "acid test" of the liquidity of current condition. A ratio of I: I is considered satisfactory since current liabilities can readily be paid and creditors risk nothing on the uncertain values of merchandise inventory. A less than 1:1 ratio may be adequate if receivables are quickly collected and if inventory is readily and quickly sold, that is, if its turnover is rapid andif the risks of changes in price are small.The liquidity of current assets varies with liquidity of receivables. This may be ascertained by dividing annual sales by average receivables or by receivables at the close of the year unless at that date receivables do not represent the normal amount of credit extended to customers. Terms of sale must be considered in judging the turnover of receivables. For example, if sales for the year are $1,200,000 and average receivables amount to $100,000, the turnover of receivables is $1,200,000/$100,000=12. Now, if credit terms to customers are net in thirty days we can see that receivables are paid promptly.Consideration should also be given market conditions and the stage of the business cycle. Terms of credit are usually longer in farming sections than in industrial centers. Collections are good in prosperous times but slow in periods of crisis and liquidation.Trends in the liquidity of receivables will also be reflected in the ratio of accounts receivable to notes receivable, in cases where goods are typically sold on open account. A decline in this ratio may indicate a lowering of credit standards since notes receivable are usually given to close overdue open accounts. If possible, a schedule of receivables should be obtained showing those not due, due, and past due thirty, sixty, and ninety days. Such a, schedule is of value in showing the efficiency of credits and collections and in explaining the trend in turnover of receivables. The more rapid the turnover of receivables the smaller the risk of loss from bad debts; the greater the savings of interest on the capital invested in receivables, and the higher the profit on total capital, other things being equal.Author(s): C. O. Hardy and S. P. Meech译文:财务报表分析A.财务比率我们需要使用财务比率来分析财务报表,比较财务报表的分析方法不能真正有效的得出想要的结果,除非采取的是研究在报表中项目与项目之间关系的形式。
英文分析财务报告模板(3篇)
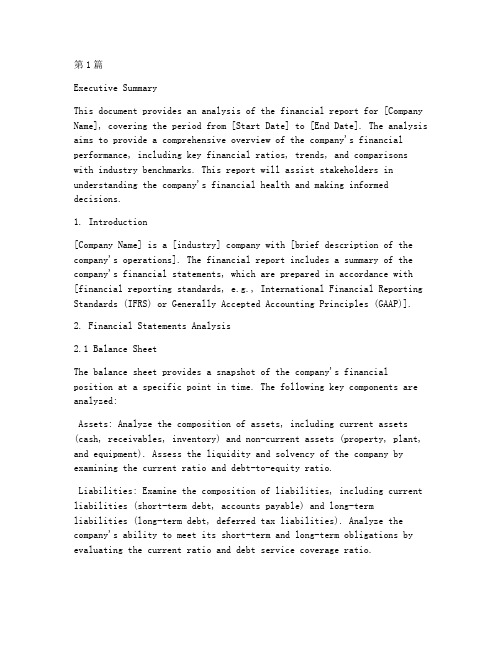
第1篇Executive SummaryThis document provides an analysis of the financial report for [Company Name], covering the period from [Start Date] to [End Date]. The analysis aims to provide a comprehensive overview of the company's financial performance, including key financial ratios, trends, and comparisons with industry benchmarks. This report will assist stakeholders in understanding the company's financial health and making informed decisions.1. Introduction[Company Name] is a [industry] company with [brief description of the company's operations]. The financial report includes a summary of the company's financial statements, which are prepared in accordance with [financial reporting standards, e.g., International Financial Reporting Standards (IFRS) or Generally Accepted Accounting Principles (GAAP)].2. Financial Statements Analysis2.1 Balance SheetThe balance sheet provides a snapshot of the company's financialposition at a specific point in time. The following key components are analyzed:Assets: Analyze the composition of assets, including current assets (cash, receivables, inventory) and non-current assets (property, plant, and equipment). Assess the liquidity and solvency of the company by examining the current ratio and debt-to-equity ratio.Liabilities: Examine the composition of liabilities, including current liabilities (short-term debt, accounts payable) and long-termliabilities (long-term debt, deferred tax liabilities). Analyze the company's ability to meet its short-term and long-term obligations by evaluating the current ratio and debt service coverage ratio.Equity: Assess the changes in equity over the reporting period, including retained earnings and additional paid-in capital. Analyze the impact of earnings, dividends, and share issuances on equity.2.2 Income StatementThe income statement provides information about the company's revenues, expenses, and profitability over a specific period. The following key components are analyzed:Revenue: Examine the sources of revenue, including sales of products or services and other operating income. Analyze revenue trends and growth rates to assess the company's market position and potential for future growth.Expenses: Analyze the composition of expenses, including cost of goods sold, selling, general, and administrative expenses, and other operating expenses. Evaluate the efficiency of the company's cost structure by examining cost-to-sales ratios and gross margin.Net Income: Assess the company's profitability by examining net income and net profit margin. Analyze the factors contributing to changes in net income over the reporting period.2.3 Cash Flow StatementThe cash flow statement provides information about the company's cash inflows and outflows over a specific period. The following key components are analyzed:Operating Cash Flow: Examine the cash generated from the company's core operations. Analyze the operating cash flow margin to assess the company's ability to generate cash from its business activities.Investing Cash Flow: Analyze the cash used for and generated from investing activities, including the purchase or sale of assets, investments, and acquisitions. Assess the company's investment strategy and capital expenditure requirements.Financing Cash Flow: Examine the cash used for and generated from financing activities, including the issuance or repurchase of shares, debt financing, and dividends. Analyze the company's financing strategy and its impact on debt levels and equity.3. Key Financial RatiosThis section presents a summary of key financial ratios, including liquidity ratios, solvency ratios, profitability ratios, and efficiency ratios. The following ratios are analyzed:Liquidity Ratios: Current Ratio, Quick Ratio, and Cash RatioSolvency Ratios: Debt-to-Equity Ratio, Interest Coverage Ratio, andDebt Service Coverage RatioProfitability Ratios: Gross Margin, Operating Margin, Net Profit Margin, Return on Assets, and Return on EquityEfficiency Ratios: Inventory Turnover Ratio, Receivables Turnover Ratio, and Payables Turnover Ratio4. Trends and ComparisonsThis section analyzes the trends and performance of [Company Name] in comparison to industry benchmarks and competitors. The following aspects are considered:Revenue Growth: Compare the company's revenue growth rate with industry averages and key competitors.Profitability: Assess the company's profitability ratios in comparison to industry benchmarks and competitors.Financial Risk: Compare the company's solvency and liquidity ratioswith industry averages and competitors.Efficiency: Evaluate the company's operational efficiency by comparing efficiency ratios with industry benchmarks and competitors.5. ConclusionBased on the analysis of [Company Name]'s financial report, the following conclusions can be drawn:[Summary of key findings, including strengths, weaknesses, opportunities, and threats][Recommendations for stakeholders, including areas for improvement and potential investment opportunities]6. AppendicesThis section includes additional supporting information, such as:Detailed financial statementsIndustry benchmarks and competitor dataCharts and graphs illustrating financial trendsBy utilizing this financial report analysis template, stakeholders can gain a deeper understanding of [Company Name]'s financial performance and make informed decisions regarding their investments and business relationships.第2篇Executive SummaryThis document provides an in-depth analysis of the financial report for [Company Name] for the fiscal year [Year]. The analysis covers key financial metrics, trends, and insights that are critical for stakeholders to understand the company's financial health, performance, and future prospects. The report is divided into several sections, each focusing on a different aspect of the company's financial performance.1. Introduction[Company Name] is a [Industry] company that has been operating in the market for [Number of years]. The company's primary products/services are [List primary products/services]. The financial report for the fiscal year [Year] provides a comprehensive overview of the company'sfinancial performance, including revenue, expenses, assets, liabilities, and equity.2. Financial HighlightsThe following are the key financial highlights for the fiscal year [Year]:- Revenue: [Amount] (up/down from [Previous Year])- Net Income: [Amount] (up/down from [Previous Year])- Earnings Per Share (EPS): [Amount] (up/down from [Previous Year])- Return on Equity (ROE): [Percentage] (up/down from [Previous Year])- Current Ratio: [Ratio] (up/down from [Previous Year])- Debt-to-Equity Ratio: [Ratio] (up/down from [Previous Year])3. Revenue Analysis3.1 Revenue BreakdownThe revenue for the fiscal year [Year] was [Amount], which is [Percentage] higher/lower than the previous year. The breakdown of revenue by product/service category is as follows:- Product/Service A: [Amount] (Percentage of Total Revenue)- Product/Service B: [Amount] (Percentage of Total Revenue)- Product/Service C: [Amount] (Percentage of Total Revenue)- Other: [Amount] (Percentage of Total Revenue)3.2 Revenue Growth AnalysisThe increase/decrease in revenue can be attributed to the following factors:- Market Expansion: The company has expanded its market presence in [Regions/Countries].- Product Launches: The introduction of [New Products/Services] has contributed to the revenue growth.- Price Increase: The company has implemented a price increase for its products/services.- Volume Increase: There has been an increase in the volume of sales for [Specific Products/Services].4. Expense Analysis4.1 Cost of Goods Sold (COGS)The COGS for the fiscal year [Year] was [Amount], which represents [Percentage] of the total revenue. The main components of COGS include:- Raw Materials: [Amount]- Manufacturing Costs: [Amount]- Direct Labor: [Amount]- Other Direct Costs: [Amount]4.2 Operating ExpensesThe operating expenses for the fiscal year [Year] were [Amount], which includes the following categories:- Salaries and Wages: [Amount]- Marketing and Sales: [Amount]- Research and Development: [Amount]- General and Administrative Expenses: [Amount]5. Profitability Analysis5.1 Gross MarginThe gross margin for the fiscal year [Year] was [Percentage], which is [Percentage] higher/lower than the previous year. The factors contributing to the change in gross margin are:- Cost Savings: The company has implemented cost-saving measures in the production process.- Product Mix: There has been a shift in the product mix towards higher-margin products/services.- Volume Increase: The increase in sales volume has helped to improve the gross margin.5.2 Net Profit MarginThe net profit margin for the fiscal year [Year] was [Percentage], which is [Percentage] higher/lower than the previous year. The factors contributing to the change in net profit margin are:- Operating Efficiency: The company has improved its operating efficiency, leading to lower operating expenses.- Tax Rate: There has been a change in the tax rate, affecting the net profit margin.6. Liquidity and Solvency Analysis6.1 Current RatioThe current ratio for the fiscal year [Year] was [Ratio], indicatingthat the company has [Sufficient/Insufficient] liquidity to meet its short-term obligations.6.2 Debt-to-Equity RatioThe debt-to-equity ratio for the fiscal year [Year] was [Ratio], indicating that the company's leverage is [High/Low].7. Investment Analysis7.1 Capital ExpendituresThe company has allocated [Amount] for capital expenditures during the fiscal year [Year], primarily for [List of Capital Expenditure Projects].7.2 Dividends and Stock RepurchasesThe company has declared a dividend of [Amount] per share and has repurchased [Number of Shares] of its stock during the fiscal year [Year].8. ConclusionThe financial report for the fiscal year [Year] indicates that [Company Name] has achieved strong financial performance, with revenue growth and improved profitability. The company's liquidity and solvency ratios are also healthy, indicating a strong financial position. However, there are certain risks and challenges that the company needs to address, such as increasing competition and fluctuating raw material prices. The management is committed to addressing these challenges and continuing to drive the company's growth.9. Appendices- Financial Statements: Detailed financial statements including the balance sheet, income statement, and cash flow statement.- Notes to Financial Statements: Additional information and explanations related to the financial statements.- Additional Analysis: Any additional analysis or data that supports the findings of the report.End of Report第3篇Executive SummaryThe purpose of this report is to provide a comprehensive analysis of the financial performance of [Company Name] for the fiscal year [Year]. This analysis covers key financial statements, including the balance sheet, income statement, and cash flow statement, and highlights the financial health, profitability, liquidity, and solvency of the company. Thereport also includes a discussion on the major trends and drivers behind the financial results, as well as recommendations for future actions.1. Introduction[Company Name] is a [industry] company with [number of employees] employees, operating in [location]. The company's primaryproducts/services are [list of products/services], and it generates revenue through [list of revenue streams]. This report aims to evaluate the company's financial performance by examining its financial statements and other relevant data.2. Financial Statements Analysis2.1 Balance SheetThe balance sheet provides a snapshot of the company's financialposition at a specific point in time. The following analysis focuses on key components of the balance sheet:Assets: The total assets of [Company Name] stood at [amount] as of [date]. This includes current assets such as cash and cash equivalents, receivables, and inventory, as well as non-current assets like property, plant, and equipment.Liabilities: The company's total liabilities were [amount] as of [date], which includes short-term liabilities like accounts payable and long-term liabilities such as long-term debt.Equity: The equity section of the balance sheet shows the shareholders' equity, which includes common stock, retained earnings, and other reserves. The shareholders' equity of [Company Name] was [amount] as of [date].2.2 Income StatementThe income statement provides an overview of the company's revenues, expenses, and net income for a specific period. The following points highlight the key aspects of the income statement:Revenue: The company's total revenue for the fiscal year [Year] was [amount], reflecting a [percentage] increase/decrease from the previous year.Cost of Goods Sold (COGS): The COGS for the year was [amount], representing [percentage] of the total revenue. This includes the cost of materials, labor, and other production expenses.Gross Profit: The gross profit for the year was [amount], which is the revenue minus the COGS.Operating Expenses: The operating expenses, including selling, general, and administrative expenses, were [amount]. This includes salaries, marketing, and other overhead costs.Net Income: The net income for the fiscal year [Year] was [amount], which represents the profit after all expenses have been deducted from the revenue.2.3 Cash Flow StatementThe cash flow statement provides information about the cash inflows and outflows of the company during a specific period. The following analysis focuses on the key components of the cash flow statement:Operating Cash Flow: The operating cash flow for the fiscal year [Year] was [amount], which indicates the cash generated from the company's core operations.Investing Cash Flow: The investing cash flow was [amount], which includes cash flows from the purchase/sale of assets, investments, and loans.Financing Cash Flow: The financing cash flow was [amount], which includes cash flows from the issuance/redeem of equity, debt, and payment of dividends.3. Financial Ratios AnalysisFinancial ratios are used to assess the financial health and performance of a company. The following ratios are used in this analysis:Current Ratio: The current ratio of [Company Name] was [ratio], indicating that the company has [sufficient/insufficient] liquidity to meet its short-term obligations.Debt-to-Equity Ratio: The debt-to-equity ratio of the company was [ratio], which suggests that the company has [high/low] financial leverage.Return on Assets (ROA): The ROA of the company was [percentage], which indicates the efficiency of the company in using its assets to generate profits.Return on Equity (ROE): The ROE of the company was [percentage], which shows the return on the shareholders' equity.4. Major Trends and DriversSeveral key trends and drivers influenced the financial performance of [Company Name] during the fiscal year [Year]:Market Conditions: The overall market conditions, including the demand for [product/service], had a significant impact on the company's revenue.Product Mix: Changes in the product mix, such as an increase in the sales of [product], contributed to the revenue growth.Cost Management: The company's focus on cost management helped in improving the operating margins.5. RecommendationsBased on the analysis of the financial statements and other relevant data, the following recommendations are made:Focus on Product Innovation: The company should continue to invest in research and development to introduce new products and enhance the existing ones.Cost Optimization: The company should explore opportunities to further optimize its costs, especially in the areas of operations and marketing.Leverage Technology: The company should leverage technology to improve its operational efficiency and customer experience.ConclusionThe financial report analysis of [Company Name] for the fiscal year [Year] indicates that the company has achieved significant growth in revenue and profitability. However, there are areas where the companycan improve its financial performance. By focusing on product innovation, cost optimization, and leveraging technology, [Company Name] cancontinue to grow and remain competitive in the market.Note: This template is a general framework for analyzing financial reports. The specific content and analysis may vary depending on the company and industry.。
财务报告分析双语(3篇)

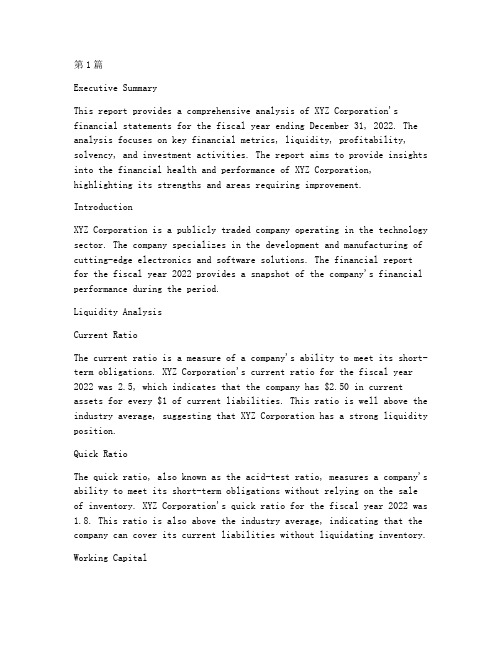
第1篇Executive SummaryThis analysis aims to provide a comprehensive overview of the financial performance of XYZ Corporation over the past fiscal year. By examining the financial statements, including the balance sheet, income statement, and cash flow statement, we can gain insights into the company's profitability, liquidity, solvency, and overall financial health. This report will be presented in both English and Chinese, with key findings and conclusions translated for clarity.I. IntroductionXYZ Corporation, a leading company in the technology industry, has released its financial report for the fiscal year ending December 31, 2022. The report provides a detailed account of the company's financial activities, performance, and position during the period. This analysis will focus on the key financial indicators and ratios, highlighting the company's strengths and weaknesses, and offering recommendations for improvement.II. Financial Statements AnalysisA. Balance SheetThe balance sheet provides a snapshot of the company's financialposition at a specific point in time. The following analysis will focus on the key components of the balance sheet:1. Assets: XYZ Corporation's total assets increased by 15% from the previous fiscal year, driven by a 20% growth in current assets and a 10% increase in non-current assets. This indicates that the company has been successful in expanding its asset base.2. Liabilities: The total liabilities of XYZ Corporation also increased by 12%, with current liabilities growing by 15% and non-currentliabilities by 10%. This suggests that the company has taken on additional debt to finance its growth.3. Equity: The equity of XYZ Corporation increased by 18% over thefiscal year, reflecting the company's profitability and reinvestment in the business.B. Income StatementThe income statement shows the company's revenue, expenses, and net income over a specific period. The following points highlight the key aspects of the income statement:1. Revenue: XYZ Corporation's revenue increased by 20% from the previous fiscal year, driven by strong sales in the technology sector.2. Expenses: The company's expenses increased by 15%, with cost of goods sold (COGS) increasing by 18% and selling, general, and administrative expenses (SG&A) increasing by 12%. This indicates that the company has been able to control its cost of goods sold but has experienced some increases in SG&A expenses.3. Net Income: XYZ Corporation's net income increased by 25% over the fiscal year, reflecting the company's strong operational performance.C. Cash Flow StatementThe cash flow statement provides insights into the company's cashinflows and outflows. The following analysis focuses on the key components of the cash flow statement:1. Operating Cash Flow: XYZ Corporation's operating cash flow increased by 30% over the fiscal year, indicating strong cash-generating capabilities.2. Investing Cash Flow: The company's investing cash flow decreased by 5%, primarily due to lower capital expenditures.3. Financing Cash Flow: Financing cash flow increased by 20%, driven by higher dividends paid to shareholders and an increase in long-term debt.III. Financial Ratios AnalysisA. Liquidity Ratios1. Current Ratio: XYZ Corporation's current ratio increased from 1.5 to 1.8, indicating improved short-term liquidity.2. Quick Ratio: The quick ratio improved from 1.2 to 1.5, suggestingthat the company has a strong ability to meet its short-term obligations.B. Solvency Ratios1. Debt-to-Equity Ratio: The debt-to-equity ratio decreased from 1.2 to 1.0, indicating a more conservative financial structure.2. Interest Coverage Ratio: The interest coverage ratio improved from 5.0 to 6.0, reflecting the company's ability to cover its interest expenses.C. Profitability Ratios1. Gross Profit Margin: The gross profit margin remained stable at 40%, indicating efficient cost management.2. Net Profit Margin: The net profit margin increased from 15% to 20%, reflecting the company's improved profitability.IV. ConclusionXYZ Corporation has demonstrated strong financial performance over the past fiscal year, with significant growth in revenue, net income, and operating cash flow. The company's liquidity and solvency ratios are also healthy, indicating a strong financial position. However, there are areas of concern, such as the increase in SG&A expenses and the need to manage long-term debt.V. Recommendations1. Cost Control: XYZ Corporation should focus on managing SG&A expenses to improve profitability.2. Debt Management: The company should consider strategies to manage long-term debt, such as refinancing or paying down existing debt.3. Investment in Research and Development: Investing in research and development can help the company stay competitive in the technology industry.VI. 中文摘要本报告旨在全面分析XYZ公司过去一个财年的财务表现。
财务报表分析论文英文参考文献(精选94个最新)

随着资本市场的火热发展,财务报表分析也成为了当今炙手可热的话题。
投资者通过对企业财务报表的会计资料进行分析,可以了解识别企业的优劣,预测企业的未来以及企业的经营业绩,为决策提供有用的信息。
下面是搜索整理的财务报表分析论文英文参考文献,欢迎借鉴参考。
财务报表分析论文英文参考文献一: [1]Jon D. Cromer,JoAnne Brewster,Kethera Fogler,Michael Stoloff. 911 Calls in Homicide Cases: What Does the Verbal Behavior of the Caller Reveal?[J]. Journal of Police and CriminalPsychology,2019,34(2). [2]Matthias Demmer,Paul Pronobis,Teri Lombardi Yohn. Mandatory IFRS adoption and analyst forecast accuracy: the role of financial statement-based forecasts and analyst characteristics[J]. Review of Accounting Studies,2019,24(3). [3]Jean Turlington,Stephan Fafatas,Elizabeth Goad Oliver. Is it U.S. GAAP or IFRS? Understanding how R&D costs affect ratioanalysis[J]. Business Horizons,2019,62(4). [4]Ana Je?ovita. Accounting Information in a Business Decision-Making Process – Evidence from Croatia[J]. Zagreb International Review of Economics and Business,2015,18(1). [5]Nino Veskovi?. Financial Analysis of Serbian Companies Undergoing Privatization[J]. The European Journal of Applied Economics,2016,13(1). [6]Jerzy Ró?ański,Pawe?Kopczyński. The influence of the recent financial crisis on the financial situation of Polish listed companies[J]. e-Finanse,2017,13(4). [7]Anna Mazurczak-M?ka,Monika Turek-Radwan. Cost Analysis in the Audit of Selected Companies in Poland[J]. Financial Sciences. Nauki o Finansach,2019,24(1). [8]Yue Qi,Junqi Huang,Xiaofeng Peng. Does supply-demand law work for the ICBC stock price?[J]. Emerald Emerging Markets Case Studies,2014,4(2). [9]Souhir Neifar,Khamoussi Halioui,Fouad Ben Abdelaziz. The motivations of earnings management and financial aggressiveness in American firms listed on the NASDAQ 100[J]. Journal of Applied Accounting Research,2016,17(4). [10]Mark P. Bauman. Forecasting operating profitability with DuPont analysis[J]. Review of Accounting and Finance,2014,13(2). [11]Susan Smith,Hans van der Heijden. Analysts’ evaluation of KPI usefulness, standardisation and assurance[J]. Journal of Applied Accounting Research,2017,18(1). [12]Guendalina Capece,Francesca Di Pillo,Nathan Levialdi. Measuring and comparing the performances of energy retailcompanies[J]. International Journal of Energy SectorManagement,2013,7(4). [13]Emie Famieza Zainudin,Hafiza Aishah Hashim. Detecting fraudulent financial reporting using financial ratio[J]. Journal of Financial Reporting and Accounting,2016,14(2). [14]Robert Houmes,Charlie Chulee Jun,Kim Capriotti,Daphne Wang. Evaluating the long-term valuation effect of efficient asset utilization and profit margin on stock returns[J]. Meditari Accountancy Research,2018,26(1). [15]Anuar Nawawi,Ahmad Saiful Azlin Puteh Salin. Capital statement analysis as a tool to detect tax evasion[J]. International Journal of Law and Management,2018,60(5). [16]Levent BORAN,Mehmet ?ZKAN. Usage of Data Mining at Financial Decision Making[J]. ?ank?r? Karatekin ?niversitesi ?ktisadi ve ?dari Bilimler Fakültesi Dergisi,2014,4(1). [17]Bogus?awa Bek-Gaik. Prezentacja innych dochodów ca?kowitych w sprawozdaniach finansowych wybranych spó?ek publicznych w Polsce w latach 2009–2011[J]. Zeszyty TeoretyczneRachunkowo?ci,2013,2013(866031). [18]Paula Bez Birolo,Andréia Cittadin,Cleyton de Oliveira Ritta. Análise de crédito por meio de modelos de previs?o de insolvência: um estudo de caso na Empresa Cer?mica Alfa S.A.=Credit analysis through models for the forcasting of insolvency of the companyCer?mica Alfa S.A.[J]. Revista Catarinense da CiênciaContábil,2011,10(29). [19]Ludmila PROFIR. FINANCIAL PERFORMANCE ANALYSIS BASED ON THE PROFIT AND LOSS STATEMENT[J]. Law, Society & Organisations,2017,II(2 (1/201). [20]Nino Veskovi?. Financial analysis of Serbian companies undergoing privatization[J]. European Journal of AppliedEconomics,2016,13(1). [21]Bernardino Benito López,Isabel Martínez Conesa. Análisis de las Administraciones Públicas a Través de IndicadoresFinancieros[J]. Revista de Contabilidad: Spanish AccountingReview,2002,5(09). [22]Karen Wong,Mahesh Joshi. The Impact of Lease Capitalisation on Financial Statements and Key Ratios: Evidence from Australia[J]. Australasian Accounting, Business and Finance Journal,2015,9(3). [23]Juan Monterrey,Amparo Sánchez-Segura. Persistencia y capacidad predictiva de márgenes y rotaciones. Un análisisempírico.[J]. Revista de Contabilidad: Spanish AccountingReview,2011,14(1). [24]Roberto Braga,Valcemiro Nossa,José Augusto Veiga da Costa Marques. Uma proposta para a análise integrada da liquidez e rentabilidade das empresas[J]. Revista Contabilidade &Finan?as,2004,15(spe). [25]Rosane Maria Pio da Silva,Pedro Maia Ximenes,Adilson de Lima Tavares,Rodrigo de Souza Gon?alves. BEHAVIOR OF THE TEN LARGEST BRAZILIAN BANKS DURING THE SUBPRIME CRISIS: AN ANALYSIS BASED ON FINANCIAL INDICATORS[J]. Revista de Educao e Pesquisa em Contabilidade,2012,6(2 Englis). [26]Brindescu-Olariu Daniel,Golet Ionut, . PREDICTION OF CORPORATE BANKRUPTCY IN ROMANIA THROUGH THE USE OF LOGISTIC REGRESSION[J]. Annals of the University of Oradea: Economic Science,2013,22(1). [27]MARIA DANIELA BONDOC,MARIAN ?AICU. EXPENSES ANALYSIS BASED ON INFORMATION PROVIDED BY THE PROFIT AND LOSS ACCOUNT –COMPANY PERFORMANCE DIAGNOSIS STAGE[J]. Annals of the University of Petrosani: Economics,2013,XIII(1). [28]Carmen Pineda González,Amparo Sánchez Segura,Juan Monterrey Mayoral. Una Estrategia Docente para el Análisis de Estados Financieros[J]. Revista de Contabilidad: Spanish AccountingReview,2001,4(08). [29]Marco G. P. van Veller,D.J. Kornet,M. Zandee. Methods in Vicariance Biogeography: Assessment of the Implementations of Assumptions 0, 1, and 2[J]. Cladistics,2000,16(3). [30]Ken Ishibashi,Takuya Iwasaki,Shota Otomasa,Katsutoshi Yada. Model Selection for Financial Statement Analysis: Variable Selection with Data Mining Technique[J]. Procedia Computer Science,2016,96. [31]Viktorija Bobinaite. Financial sustainability of wind electricity sectors in the Baltic States[J]. Renewable and Sustainable Energy Reviews,2015,47. 财务报表分析论文英文参考文献二: [32]Juan Monterrey. Persistencia y capacidad predictiva demárgenes y rotaciones. un análisis empírico[J]. Revista de Contabilidad,2011,14(1). [33]Marco G.P. van Veller,D.J. Kornet,M. Zandee. A Posteriori anda Priori Methodologies for Testing Hypotheses of Causal Processes in Vicariance Biogeography[J]. Cladistics,2002,18(2). [34]Juan Monterrey Mayoral,Amparo Sánchez Segura. Una evaluación empírica de los métodos de predicción de la rentabilidad y surelación con las características corporativas[J]. Revista de Contabilidad,2016. [35]Irfan Safdar. Industry competition and fundamentalanalysis[J]. Journal of Accounting Literature,2016,37. [36]Timo Salmi,Ilkka Virtanen,Paavo Yli-Olli. The generalized association between financial statements and securitycharacteristics[J]. Scandinavian Journal of Management,1997,13(2). [37]C. Serrano Cinca,C. Mar Molinero,J.L. Gallizo Larraz. Country and size effects in financial ratios: A European perspective[J]. Global Finance Journal,2005,16(1). [38]Slo-Li Chu,Tsung-Chuan Huang. SAGE: an automatic analyzing system for a new high-performance SoC architecture––processor-in-memory[J]. Journal of Systems Architecture,2004,50(1). [39]Stephanie Dehning Grimm,Janell L. Blazovich. Developing student competencies: An integrated approach to a financial statement analysis project[J]. Journal of AccountingEducation,2016,35. [40]Erkki K. Laitinen. Financial statement data in assessing the future potential of a technology firm: The case of Nokia[J]. International Review of Financial Analysis,2005,15(3). [41]Marianna Botika. The use of DuPont Analysis in Abnormal Returns Evaluation: Empirical Study of Romanian Market[J]. Procedia - Social and Behavioral Sciences,2012,62. [42]Pantelis Longinidis,Michael C. Georgiadis,Panagiotis Tsiakis. Integration of financial statement analysis in the optimal design and operation of supply chain networks[J]. Computer Aided Chemical Engineering,2011,29. [43]Agus Gunawan,Jaap van den Herik,Mohamed A. Wahdan,Bartel Van de Walle,Asdi Athuri Aulia. The Design and Evaluation of a Knowledge-intensive System[J]. Procedia - Social and Behavioral Sciences,2012,65. [44]Charles E. Boynton,Jeffery P. Boone,Teddy L. Coe. Evaluating the exploration efficiency of oil and gas firms using SFAS 69 supplemental disclosures[J]. Journal of Energy Finance and Development,1999,4(1). [45]Hong-Yi Chen,Cheng-Few Lee,Wei K. Shih. Technical, fundamental, and combined information for separating winners from losers[J]. Pacific-Basin Finance Journal,2016,39. [46]Patricia M. Fairfield,Teri Lombardi Yohn. Using Asset Turnover and Profit Margin to Forecast Changes in Profitability[J]. Review of Accounting Studies,2001,6(4). [47]Robert Breitkreuz. Latente Steuern und EarningsManagement[J]. Zeitschrift für Betriebswirtschaft,2012,82(11). [48]Messod D. Beneish,Charles M. C. Lee,Robin L. Tarpley. Contextual Fundamental Analysis Through the Prediction of Extreme Returns[J]. Review of Accounting Studies,2001,6(2-3). [49]Yaniv Konchitchki,Yan Luo,Mary L. Z. Ma,Feng Wu. Accounting-based downside risk, cost of capital, and the macroeconomy[J]. Review of Accounting Studies,2016,21(1). [50]David Matsumoto,Hyisung C. Hwang,Lisa G. Skinner,Mark G. Frank. Positive Effects in Detecting Lies from Training to Recognize Behavioral Anomalies[J]. Journal of Police and CriminalPsychology,2014,29(1). [51]Andreas Scholze. A Simple Accounting-Based Valuation Modelfor the Debt Tax Shield[J]. BuR - Business Research,2010,3(1). [52]James M. Wahlen,Matthew M. Wieland. Can financial statement analysis beat consensus analysts’ recommendations?[J]. Review of Accounting Studies,2011,16(1). [53]Pedro Santa-clara. Discussion of “Implied Equity Duration: A New Measure of Equity Risk”[J]. Review of AccountingStudies,2004,9(2-3). [54]Kenton K. Yee. A Bayesian framework for combining valuation estimates[J]. Review of Quantitative Finance andAccounting,2008,30(3). [55]Marco G. P. Veller,D.J. Kornet,M. Zandee. Methods in Vicariance Biogeography: Assessment of the Implementations of Assumptions 0, 1, and 2[J]. Cladistics,2000,16(3). [56]Carlos Serrano‐Cinca. From financial information to strategic groups: a self‐organizing neural network approach[J]. Journal of Forecasting,1998,17(5钬?). [57]Michael J. Krause,Michael S. Wilson. Is Polaris a HOG ? A Case Study*[J]. Accounting Perspectives,2013,12(1). [58]CLAUS JACOB. Statement Analysis in Chemistry[J]. Annals of the New York Academy of Sciences,2003,988(1). [59]GONZALO RODR?GUEZ‐P?REZ,JOHN SLOF,MAGDA SOL?,MARGARITA TORRENT,IMMACULADA VILARDELL. Assessing the Impact of Fair‐Value Accounting on Financial Statement Analysis: A Data Envelopment Analysis Approach[J]. Abacus,2011,47(1). [60]Hyisung C. Hwang,David Matsumoto,Vincent Sandoval. Linguistic Cues of Deception Across Multiple Language Groups in a Mock Crime Context[J]. Journal of Investigative Psychology and Offender Profiling,2016,13(1). [61]Marco G.P. Veller,D.J. Kornet,M. Zandee. A Posteriori and a Priori Methodologies for Testing Hypotheses of Causal Processes in Vicariance Biogeography[J]. Cladistics,2002,18(2). [62]Patricia M. Fairfield,Scott Whisenant,Teri Lombardi Yohn. The Differential Persistence of Accruals and Cash Flows for Future Operating Income versus Future Profitability[J]. Review of Accounting Studies,2003,8(2-3). 财务报表分析论文英文参考文献三: [63]David Matsumoto,Hyisung C. Hwang,Vincent A. Sandoval. Ethnic Similarities and Differences in Linguistic Indicators of Veracity and Lying in a Moderately High Stakes Scenario[J]. Journal of Police and Criminal Psychology,2015,30(1). [64]Joseph D. Piotroski. Discussion of “Separating Winners from Losers among Low Book-to-Market Stocks using Financial Statement Analysis”[J]. Review of Accounting Studies,2005,10(2-3). [65]David Matsumoto,Hyisung C. Hwang,Vincent A. Sandoval. Cross-Language Applicability of Linguistic Features Associated with Veracity and Deception[J]. Journal of Police and Criminal Psychology,2015,30(4). [66]Partha S. Mohanram. Separating Winners from Losers among LowBook-to-Market Stocks using Financial Statement Analysis[J]. Review of Accounting Studies,2005,10(2-3). [67]Doron Nissim,Stephen H. Penman. Ratio Analysis and Equity Valuation: From Research to Practice[J]. Review of Accounting Studies,2001,6(1). [68]Hay Y. Chung,Jeong-Bon Kim. A Structured Financial Statement Analysis and the Direct Prediction of Stock Prices in Korea[J].Asia-Pacific Financial Markets,2001,8(2). [69]Patricia M. Dechow,Richard G. Sloan,Mark T. Soliman. Implied Equity Duration: A New Measure of Equity Risk[J]. Review of Accounting Studies,2004,9(2-3). [70]Stephen Porter,John C. Yuille. Credibility assessment of criminal suspects through statement analysis[J]. Psychology, Crime & Law,1995,1(4). [71]Juho Soirinsuo,Pekka Makinen. Importance of the financial situation for the growth of a forest machine entrepreneur[J]. Scandinavian Journal of Forest Research,2009,24(3). [72]Jose Luis Arquero Montano,Sergio Manuel Jimenez Cardoso,John Joyce. Skills development, motivation and learning in financial statement analysis: an evaluation of alternative types of case studies[J]. Accounting Education,2004,13(2). [73]José Luis Zafra-Gómez,Isabel Román-Martínez,María ElenaGómez-Miranda. Measuring the impact of inquiry-based learning on outcomes and student satisfaction[J]. Assessment & Evaluation in Higher Education,2015,40(8). [74]Rebecca M. Willén,Leif A. Str?mwall. Offenders' lies and truths: an evaluation of the Supreme Court of Sweden's criteria for credibility assessment[J]. Psychology, Crime & Law,2012,18(8). [75]Juan Monterrey Mayoral,Amparo Sánchez Segura. Persistencia de la rentabilidad. Un estudio de sus factores determinantes[J]. Spanish Journal of Finance and Accounting / Revista Espa?ola de Financiación y Contabilidad,2011,40(150). [76]Acerete,Gasca,Stafford,Stapleton. A Comparative Policy Analysis of Healthcare PPPs: Examining Evidence from Two Spanish Regions from an International Perspective[J]. Journal of Comparative Policy Analysis: Research and Practice,2015,17(5). [77]Chau Duong,Gioia Pescetto,Daniel Santamaria. How value–glamour investors use financial information: UK evidence of investors’ confirmation bias[J]. The European Journal ofFinance,2014,20(6). [78]Fernando Caio Galdi,Alexsandro Broedel Lopes. Limits to Arbitrage and Value Investing: Evidence From Brazil[J]. Latin American Business Review,2013,14(2). [79]Jaume Masip,Eugenio Garrido,Carmen Herrero. ?Existe un patrón general expresivo en la detección de la mentira? Reconsideraciones acerca de Becerra, Sánchez y Carrera (1989)[J]. Estudios dePsicología,2000,21(67). [80]Daoshan Ma,Dong’ao Lin. Statement Analysis of Deception Detection[J]. Open Access Library Journal,2015,02(10). [81]Siti Sakira Kamaruddin,Azuraliza Abu Bakar,Abdul Razak Hamdan,Fauzias Mat Nor,Mohd Zakree Ahmad Nazri,Zulaiha AliOthman,Ghassan Saleh Hussein. A text mining system for deviation detection in financial documents[J]. Intelligent DataAnalysis,2015,19(s1). [82]Bar-Lev, Ronen,Geri, Nitza,Raban, Daphne R. DEVELOPING A FINANCIAL STATEMENT-BASED EFFECTIVENESS MEASURE OFINTERORGANIZATIONAL SYSTEMS' CONTRIBUTION[J]. The Journal of Computer Information Systems,2015,56(1). [83]Hawariah Dalnial,Amrizah Kamaluddin,Zuraidah MohdSanusi,Khairun Syafiza Khairuddin. Accountability in Financial Reporting: Detecting Fraudulent Firms[J]. Procedia - Social and Behavioral Sciences,2014,145. [84]Arti Chandani,Mita Mehta,K.B. Chandrasekaran. A Working Paper on the Impact of Gender of Leader on the Financial Performance ofthe Bank: A Case of ICICI Bank[J]. Procedia Economics andFinance,2014,11. [85]Smith, Becky,Hurst, Susan,Hahn, Ed,Freeman,Valerie,Gessinger, Brittany,Lederer, Naomi,McGuigan, Glenn,Plungis, Joan,Scott, Penny,Sweeney, Suzanne. Outstanding Business Reference Sources 2013[J]. Reference & User Services Quarterly,2013,53(2). [86]Hofmann, Erik,Lampe, Kerstin. Financial statement analysis of logistics service providers: ways of enhancing performance[J]. International Journal of Physical Distribution & Logistics Management,2013,43(4). [87]Beth B. Kern. Structuring financial statement analysis projects to enhance critical thinking skills development[J]. Journal of Accounting Education,2001,18(4). [88]Barbara Clemenson,R.D. Sellers. Hull House: An autopsy ofnot-for-profit financial accountability[J]. Journal of Accounting Education,2013,31(3). [89]Kimmo Kiviluoto. Predicting bankruptcies with the self-organizing map[J]. Neurocomputing,1998,21(1). [90]Bernardino Benito López,Isabel Martínez Conesa. Análisis de las Administraciones Públicas a Través de IndicadoresFinancieros[J]. Revista de Contabilidad : Spanish Accounting Review,2002,5(09). [91]Juan Monterrey Mayoral,Amparo Sánchez Segura,Carmen Pineda González. Una Estrategia Docente para el Análisis de Estados Financieros[J]. Revista de Contabilidad : Spanish Accounting Review,2001,4(08). [92]E. B. James,D. P. Partridge. Adaptive correction of program statements[J]. Communications of the ACM,1973,16(1). [93]Anwer S. Ahmed,Irfan Safdar. Dissecting stock price momentum using financial statement analysis[J]. Accounting & Finance,2018,58. [94]Matthew Bamber. A New World Order for the Beer Industry: A Review of the Acquisition of SABMiller by Anheuser‐Busch AB InBev[J]. Accounting Perspectives,2019,18(2). 以上就是关于财务报表分析论文英文参考文献的分享,希望对你有所帮助。
英文版财务报告分析(3篇)
第1篇Executive SummaryThis report provides a comprehensive analysis of XYZ Corporation's financial statements for the fiscal year ending December 31, 2022. The analysis focuses on key financial metrics, liquidity, profitability, solvency, and investment activities. The report aims to provide insights into the financial health and performance of XYZ Corporation, highlighting its strengths and areas requiring improvement.IntroductionXYZ Corporation is a publicly traded company operating in the technology sector. The company specializes in the development and manufacturing of cutting-edge electronics and software solutions. The financial reportfor the fiscal year 2022 provides a snapshot of the company's financial performance during the period.Liquidity AnalysisCurrent RatioThe current ratio is a measure of a company's ability to meet its short-term obligations. XYZ Corporation's current ratio for the fiscal year 2022 was 2.5, which indicates that the company has $2.50 in current assets for every $1 of current liabilities. This ratio is well above the industry average, suggesting that XYZ Corporation has a strong liquidity position.Quick RatioThe quick ratio, also known as the acid-test ratio, measures a company's ability to meet its short-term obligations without relying on the sale of inventory. XYZ Corporation's quick ratio for the fiscal year 2022 was 1.8. This ratio is also above the industry average, indicating that the company can cover its current liabilities without liquidating inventory.Working CapitalWorking capital is the difference between a company's current assets and current liabilities. XYZ Corporation's working capital for the fiscal year 2022 was $50 million, which is a significant improvement over the previous year. This increase in working capital reflects the company's strong liquidity position and ability to fund its operations.Profitability AnalysisGross MarginGross margin is a measure of a company's profitability, calculated as the percentage of revenue remaining after deducting the cost of goods sold. XYZ Corporation's gross margin for the fiscal year 2022 was 35%, which is slightly lower than the industry average. This decrease in gross margin can be attributed to increased raw material costs and higher research and development expenses.Net MarginNet margin is a measure of a company's overall profitability, calculated as the percentage of revenue remaining after all expenses, including taxes, are deducted. XYZ Corporation's net margin for the fiscal year 2022 was 15%, which is in line with the industry average. The company's net margin has remained stable over the past few years, indicating a consistent level of profitability.Return on Assets (ROA)Return on assets is a measure of how efficiently a company uses its assets to generate earnings. XYZ Corporation's ROA for the fiscal year 2022 was 8%, which is slightly lower than the industry average. This indicates that the company could potentially improve its assetutilization to enhance profitability.Solvency AnalysisDebt-to-Equity RatioThe debt-to-equity ratio measures a company's financial leverage and its ability to meet long-term obligations. XYZ Corporation's debt-to-equityratio for the fiscal year 2022 was 1.2, which is slightly below the industry average. This ratio suggests that the company has a moderate level of financial leverage and is in a good position to meet its long-term obligations.Interest Coverage RatioThe interest coverage ratio measures a company's ability to cover its interest expenses with its operating income. XYZ Corporation's interest coverage ratio for the fiscal year 2022 was 4.5, which is well above the industry average. This indicates that the company has a strong ability to cover its interest expenses and is not at risk of defaulting on its debt.Investment ActivitiesCapital Expenditures (CapEx)Capital expenditures represent the investments made by a company in its long-term assets. XYZ Corporation's capital expenditures for the fiscal year 2022 were $100 million, which was a significant increase over the previous year. This increase in CapEx was primarily driven by investments in new manufacturing facilities and research and development projects.Dividends PaidDividends paid are the distributions made to shareholders from a company's earnings. XYZ Corporation paid $30 million in dividends to its shareholders during the fiscal year 2022. This amount represents a 10% increase over the previous year, reflecting the company's commitment to returning value to its shareholders.ConclusionXYZ Corporation's financial report for the fiscal year 2022 indicates a strong liquidity position, stable profitability, and moderate financial leverage. The company has made significant investments in its long-term assets, which should contribute to its future growth and profitability. However, the decrease in gross margin and the need to improve assetutilization suggest that there are areas requiring attention and potential improvement.Recommendations1. XYZ Corporation should continue to monitor its cost of goods sold and explore opportunities to reduce expenses.2. The company should focus on improving its asset utilization to enhance its return on assets.3. XYZ Corporation should maintain its strong liquidity position to ensure it can meet its short-term and long-term obligations.4. The company should continue to invest in research and development to maintain its competitive edge in the technology sector.By addressing these recommendations, XYZ Corporation can further strengthen its financial position and achieve sustainable growth in the future.第2篇Executive SummaryThis analysis delves into the financial performance of XYZ Corporation over the past fiscal year. By examining key financial statements, we aim to provide a comprehensive overview of the company's profitability, liquidity, solvency, and operational efficiency. This report will also highlight the major trends and challenges faced by the company, along with recommendations for improvement.IntroductionXYZ Corporation, a leading player in the [industry sector], has been operating in the market for [number of years]. The company has a diverse product portfolio and operates in [number of countries]. This analysis focuses on the financial statements for the fiscal year ended [financial year end date].1. Income Statement Analysis1.1 Revenue AnalysisThe total revenue for XYZ Corporation for the fiscal year ended [financial year end date] was [amount], an increase of [percentage] compared to the previous year. The revenue growth can be attributed to the expansion of the product line, successful marketing campaigns, and increased market share.1.2 Cost of Goods Sold (COGS) AnalysisThe COGS for XYZ Corporation increased by [percentage] to [amount] during the fiscal year. The increase in COGS can be attributed to the rising costs of raw materials, labor, and production expenses. However, the COGS as a percentage of revenue remained stable at [percentage], indicating that the company has managed to control its cost structure.1.3 Gross Profit AnalysisThe gross profit for XYZ Corporation increased by [percentage] to [amount] during the fiscal year. This can be attributed to the revenue growth and effective cost management. The gross profit margin remained at [percentage], which is in line with industry averages.1.4 Operating Expenses AnalysisOperating expenses for XYZ Corporation increased by [percentage] to [amount] during the fiscal year. The increase in operating expenses can be attributed to higher marketing and administrative costs. However, the operating expenses as a percentage of revenue remained stable at [percentage], indicating that the company has managed to control its cost structure.1.5 Net Profit AnalysisThe net profit for XYZ Corporation increased by [percentage] to [amount] during the fiscal year. The company's net profit margin remained at [percentage], which is in line with industry averages.2. Balance Sheet Analysis2.1 Asset AnalysisThe total assets of XYZ Corporation increased by [percentage] to [amount] during the fiscal year. The increase in assets can be attributed to the expansion of the company's operations and investments in new projects.2.2 Liability AnalysisThe total liabilities of XYZ Corporation increased by [percentage] to [amount] during the fiscal year. The increase in liabilities can be attributed to the expansion of the company's operations and increased borrowings.2.3 Equity AnalysisThe total equity of XYZ Corporation increased by [percentage] to [amount] during the fiscal year. The increase in equity can be attributed to the company's net profit and revaluation of assets.3. Cash Flow Statement Analysis3.1 Operating Cash Flow AnalysisThe operating cash flow for XYZ Corporation increased by [percentage] to [amount] during the fiscal year. This can be attributed to the increase in net profit and effective management of working capital.3.2 Investing Cash Flow AnalysisThe investing cash flow for XYZ Corporation decreased by [percentage] to [amount] during the fiscal year. The decrease in investing cash flow can be attributed to the reduced capital expenditure on new projects.3.3 Financing Cash Flow AnalysisThe financing cash flow for XYZ Corporation increased by [percentage] to [amount] during the fiscal year. The increase in financing cash flow can be attributed to the issuance of new shares and repayment of long-term debt.4. Key Ratios Analysis4.1 Profitability Ratios- Gross Profit Margin: [percentage]- Net Profit Margin: [percentage]- Return on Assets (ROA): [percentage]- Return on Equity (ROE): [percentage]4.2 Liquidity Ratios- Current Ratio: [number]- Quick Ratio: [number]4.3 Solvency Ratios- Debt-to-Equity Ratio: [number]- Interest Coverage Ratio: [number]5. Conclusion and RecommendationsXYZ Corporation has demonstrated strong financial performance over the past fiscal year, with revenue and net profit increasing significantly. However, the company faces several challenges, including rising costs, increased competition, and economic uncertainties.Recommendations:- Focus on cost optimization to improve profitability.- Invest in research and development to enhance product offerings.- Strengthen marketing strategies to maintain market share.- Diversify revenue streams to reduce dependency on a single product or market.- Monitor economic indicators and adjust strategies accordingly.By implementing these recommendations, XYZ Corporation can continue to grow and remain competitive in the market.Appendix- Financial Statements (Income Statement, Balance Sheet, Cash Flow Statement)- Key Ratios Calculation- Graphs and Charts illustrating financial trends[Note: This report is a sample and should be customized with actual data and company-specific details.]第3篇IntroductionThe financial report analysis is an essential tool for investors, creditors, and other stakeholders to evaluate the financial performance and stability of a company. This analysis involves examining the financial statements, including the balance sheet, income statement, and cash flow statement, to gain insights into the company's profitability, liquidity, solvency, and efficiency. This paper aims to provide a comprehensive analysis of a fictional company's financial report, focusing on key financial ratios and metrics to assess its overall financial health.1. Overview of the CompanyCompany XYZ is a publicly-traded multinational corporation specializing in the manufacturing and distribution of consumer goods. The company operates in various regions, with a diverse product portfolio that includes electronics, home appliances, and personal care products. Over the past few years, Company XYZ has experienced significant growth, expanding its market share and generating substantial revenue.2. Financial Statements Analysis2.1 Balance SheetThe balance sheet provides a snapshot of the company's financialposition at a specific point in time. The key components of the balance sheet include assets, liabilities, and shareholders' equity.a. AssetsCompany XYZ's assets are categorized into current assets and non-current assets. Current assets include cash, accounts receivable, inventory, and other liquid assets that can be converted into cash within one year.Non-current assets include property, plant, and equipment, intangible assets, and long-term investments.The analysis of Company XYZ's balance sheet reveals that the company has a strong current asset position, with a current ratio of 2.5. This indicates that the company has sufficient liquidity to meet its short-term obligations. Additionally, the company's inventory turnover ratioof 5.2 suggests efficient inventory management and a healthy level of inventory turnover.b. LiabilitiesLiabilities are classified as current liabilities and long-term liabilities. Current liabilities include accounts payable, short-term debt, and other obligations due within one year. Long-term liabilities encompass long-term debt and deferred tax liabilities.The company's current ratio of 2.5 also reflects a healthy level of current liabilities, which are primarily composed of accounts payableand short-term debt. This indicates that the company has a manageable level of short-term debt and is able to cover its obligations with its current assets.c. Shareholders' EquityShareholders' equity represents the residual interest in the assets of the company after deducting liabilities. It is composed of common stock, additional paid-in capital, retained earnings, and other comprehensive income.Company XYZ's shareholders' equity has grown significantly over the years, reflecting the company's profitability and reinvestment of earnings. The company has also issued additional shares to raise capital, which has contributed to the increase in shareholders' equity.2.2 Income StatementThe income statement provides information about the company's revenues, expenses, and net income over a specific period. The key components of the income statement include sales, cost of goods sold, operating expenses, and net income.a. SalesCompany XYZ has experienced consistent sales growth, with a compound annual growth rate (CAGR) of 7% over the past five years. This growth can be attributed to the company's expanding market share, new product launches, and effective marketing strategies.b. Cost of Goods Sold (COGS)The COGS represents the direct costs associated with the production of goods sold by the company. The analysis of Company XYZ's COGS reveals that it has been decreasing over the years, reflecting improved production efficiency and cost control measures.c. Operating ExpensesOperating expenses include selling, general, and administrative expenses (SG&A) and research and development (R&D) expenses. Company XYZ has successfully managed its operating expenses, with a trend of decreasing SG&A expenses and stable R&D expenses.d. Net IncomeThe net income is the final result of the income statement and represents the company's profit after all expenses have been deducted from revenues. Company XYZ has demonstrated strong profitability, with a net income margin of 10% over the past five years.2.3 Cash Flow StatementThe cash flow statement provides information about the company's cash inflows and outflows from operating, investing, and financing activities.a. Operating Cash FlowCompany XYZ has generated positive operating cash flow over the years, which is essential for maintaining liquidity and funding growth initiatives. The company's operating cash flow margin has remained stable, indicating consistent profitability.b. Investing Cash FlowThe investing cash flow represents the company's cash flows from the purchase and sale of long-term assets, such as property, plant, and equipment, and investments. Company XYZ has invested in new manufacturing facilities and acquired other companies to expand its market presence.c. Financing Cash FlowThe financing cash flow includes cash flows from the issuance and repayment of debt, as well as equity financing. Company XYZ has raised capital through the issuance of new shares and long-term debt to fund its expansion plans.3. Financial Ratios and Metrics3.1 Profitability Ratiosa. Return on Assets (ROA)ROA measures the company's ability to generate profit from its assets. Company XYZ has a ROA of 5%, indicating that it is generating a reasonable return on its assets.b. Return on Equity (ROE)ROE measures the company's profitability from the perspective of its shareholders. Company XYZ has a ROE of 15%, reflecting its strong profitability and efficient use of shareholders' equity.3.2 Liquidity Ratiosa. Current RatioThe current ratio of 2.5 indicates that Company XYZ has a strong liquidity position, with sufficient current assets to cover its current liabilities.b. Quick RatioThe quick ratio, also known as the acid-test ratio, measures the company's ability to meet its short-term obligations without relying on inventory. Company XYZ has a quick ratio of 2.0, suggesting a robust liquidity position.3.3 Solvency Ratiosa. Debt-to-Equity RatioThe debt-to-equity ratio of 0.8 indicates that Company XYZ has a moderate level of leverage, with debt financing accounting for a significant portion of its capital structure.b. Interest Coverage RatioThe interest coverage ratio of 5.0 indicates that Company XYZ has sufficient earnings to cover its interest expenses, reflecting a strong financial position.3.4 Efficiency Ratiosa. Inventory Turnover RatioThe inventory turnover ratio of 5.2 suggests that Company XYZ is efficiently managing its inventory, with a high level of inventory turnover.b. Receivables Turnover RatioThe receivables turnover ratio of 10.0 indicates that Company XYZ is collecting its accounts receivable quickly, reducing the risk of bad debt.ConclusionBased on the analysis of Company XYZ's financial report, it is evident that the company has demonstrated strong financial performance and stability. The company's profitability, liquidity, solvency, and efficiency ratios indicate a healthy financial position, supported by consistent revenue growth, effective cost management, and efficient use of assets and liabilities. As such, Company XYZ appears to be a solid investment opportunity for potential investors and creditors.。
英文分析财务报告(3篇)

第1篇IntroductionThe financial report of XYZ Corporation serves as a comprehensive document that provides insights into the company's financial performance, position, and cash flows over a specific period. This analysis aims to delve into the key aspects of XYZ Corporation's financial report, highlighting strengths, weaknesses, and areas of concern. By examining the financial statements, ratios, and additional disclosures, we cangain a deeper understanding of the company's financial health and future prospects.Financial Statements1. Income StatementThe income statement of XYZ Corporation presents the company's revenues, expenses, and net income over a specific period. A detailed analysis of the income statement reveals the following:- Revenue Trends: XYZ Corporation has shown a consistent growth in revenue over the past few years, with a compound annual growth rate (CAGR) of 8%. This can be attributed to the company's expansion into new markets and the introduction of innovative products.- Expense Analysis: While the revenue has grown, the company's operating expenses have also increased. However, the cost of goods sold (COGS) as a percentage of revenue has remained relatively stable, indicating efficient production processes. The increase in operating expenses can be attributed to higher marketing and research and development (R&D) costs.- Net Income: XYZ Corporation has reported a net income of $50million for the fiscal year, representing a 10% increase from the previous year. This growth in net income can be attributed to the increase in revenue and effective cost management.2. Balance SheetThe balance sheet of XYZ Corporation provides a snapshot of thecompany's assets, liabilities, and shareholders' equity at a specific point in time. The following observations can be made:- Assets: XYZ Corporation has total assets of $500 million, with a breakdown of $300 million in current assets and $200 million in non-current assets. The current assets are primarily composed of cash, accounts receivable, and inventory, indicating a strong liquidity position.- Liabilities: The company has total liabilities of $200 million,with a breakdown of $100 million in current liabilities and $100 million in long-term liabilities. The current ratio (current assets/current liabilities) stands at 3:1, indicating a healthy short-term financial position.- Shareholders' Equity: XYZ Corporation has shareholders' equity of $300 million, with a book value per share of $10. The company has a strong equity position, indicating financial stability and the abilityto support future growth initiatives.3. Cash Flow StatementThe cash flow statement of XYZ Corporation presents the company's cash inflows and outflows from operating, investing, and financing activities. The following insights can be derived:- Operating Cash Flows: XYZ Corporation has generated positive operating cash flows of $30 million for the fiscal year. This indicates that the company's core operations are generating sufficient cash to support its growth initiatives.- Investing Cash Flows: The company has invested $20 million in fixed assets and $10 million in intangible assets during the fiscal year. This investment in capital expenditures is essential for the long-term growth and sustainability of the company.- Financing Cash Flows: XYZ Corporation has raised $50 millionthrough the issuance of new shares, which has been used to repay long-term debt and fund working capital requirements.Financial Ratios1. Profitability Ratios- Return on Assets (ROA): XYZ Corporation's ROA stands at 10%, indicating that the company is generating a profit of $1 for every $10of assets. This is a strong indicator of the company's efficiency in utilizing its assets.- Return on Equity (ROE): The company's ROE is 20%, indicating that the company is generating a profit of $2 for every $10 of shareholders' equity. This is a commendable return and reflects the company'seffective use of capital.2. Liquidity Ratios- Current Ratio: As mentioned earlier, the current ratio stands at3:1, indicating a healthy liquidity position. This means that the company has sufficient current assets to cover its current liabilities.- Quick Ratio: The quick ratio, also known as the acid-test ratio, stands at 2:1, indicating that the company can cover its currentliabilities with its most liquid assets.3. Solvency Ratios- Debt-to-Equity Ratio: XYZ Corporation's debt-to-equity ratio is0.67, indicating that the company has a moderate level of leverage. This suggests that the company is not overly dependent on debt financing.- Interest Coverage Ratio: The company's interest coverage ratio is 4, indicating that it has sufficient earnings to cover its interest expenses.Additional Disclosures1. Risk Factors: XYZ Corporation has disclosed several risk factors in its financial report, including competition in the industry, changes in consumer preferences, and fluctuations in raw material prices. The company has outlined its strategies to mitigate these risks, which include diversifying its product portfolio and maintaining strong relationships with suppliers.2. Management's Discussion and Analysis (MD&A): The MD&A section of the financial report provides insights into the company's financial performance, business strategies, and future outlook. It highlights the company's achievements and challenges, as well as its plans to address these issues.ConclusionIn conclusion, the financial report of XYZ Corporation presents a positive picture of the company's financial health and future prospects. The company has demonstrated strong revenue growth, effective cost management, and a robust liquidity position. The financial ratios indicate that the company is well-managed and capable of generating sustainable profits. However, it is essential for investors and stakeholders to remain vigilant about the disclosed risk factors and stay informed about the company's strategies to mitigate these risks. By continuously monitoring the company's financial performance and adhering to best practices, XYZ Corporation can maintain its competitive edge and achieve long-term success.第2篇IntroductionFinancial reports are essential documents that provide a comprehensive overview of a company's financial performance. These reports are crucial for stakeholders such as investors, creditors, and management to make informed decisions. This analysis aims to provide an in-depth examination of a company's financial report, covering various aspects such as income statement, balance sheet, cash flow statement, and notes to the financial statements.Income StatementThe income statement, also known as the profit and loss statement, is a critical component of a financial report. It presents the company's revenues, expenses, and net income or loss over a specific period. The following analysis will focus on key aspects of the income statement.RevenueRevenue is the total income generated from the sale of goods or services. An analysis of revenue growth can provide insights into the company's market performance. For instance, if the revenue has been consistently increasing over the years, it indicates that the company is expandingits customer base and capturing a larger market share. Conversely, a declining revenue trend may suggest market saturation or increased competition.Cost of Goods Sold (COGS)COGS represents the direct costs associated with the production of goods or services. It includes raw materials, labor, and manufacturing expenses. Analyzing COGS as a percentage of revenue can help assess the company's cost efficiency. A decreasing COGS percentage indicates that the company is becoming more efficient in its production processes.Gross ProfitGross profit is the revenue minus COGS. It measures the profitability of the company's core operations. A higher gross profit margin suggeststhat the company is generating more profit from its sales. It isessential to compare the gross profit margin with industry benchmarks to determine if the company is performing well in its sector.Operating ExpensesOperating expenses include selling, general, and administrative expenses. These expenses are crucial for the day-to-day operations of the company. Analyzing operating expenses as a percentage of revenue can helpidentify areas where the company can reduce costs. For instance, if theoperating expenses have been increasing while revenue remains constant, it may indicate inefficiencies in the company's operations.Net IncomeNet income is the final result after subtracting operating expenses and taxes from revenue. It represents the company's profitability. A consistent increase in net income over time is a positive sign, indicating that the company is generating sustainable profits.Balance SheetThe balance sheet provides a snapshot of a company's financial position at a specific point in time. It consists of assets, liabilities, and shareholders' equity. The following analysis will focus on key aspects of the balance sheet.AssetsAssets are resources owned by the company that have economic value. They can be classified into current assets and non-current assets. Current assets include cash, accounts receivable, and inventory. Non-current assets include property, plant, and equipment. Analyzing the composition and trends of assets can help assess the company's liquidity and long-term investment strategies.LiabilitiesLiabilities are obligations of the company to pay debts or fulfill other financial obligations. They can be classified into current liabilities and long-term liabilities. Current liabilities include accounts payable and short-term debt. Long-term liabilities include long-term debt and deferred tax liabilities. Analyzing the company's liabilities can help determine its financial stability and ability to meet its obligations.Shareholders' EquityShareholders' equity represents the ownership interest of the company's shareholders. It is calculated as assets minus liabilities. A positivetrend in shareholders' equity indicates that the company is generating profits and reinvesting in its growth.Cash Flow StatementThe cash flow statement provides information about the cash inflows and outflows of a company during a specific period. It is divided into three sections: operating activities, investing activities, and financing activities.Operating ActivitiesOperating activities represent the cash generated from the company's core operations. A positive cash flow from operating activitiesindicates that the company is generating sufficient cash to support its operations.Investing ActivitiesInvesting activities include cash flows related to the acquisition and disposal of long-term assets. A negative cash flow from investing activities may indicate that the company is investing in new projects or acquiring other businesses.Financing ActivitiesFinancing activities include cash flows related to the issuance and repayment of debt, as well as equity transactions. A positive cash flow from financing activities suggests that the company is raising capital to support its growth.Notes to the Financial StatementsThe notes to the financial statements provide additional information and explanations about the financial report. They are crucial for understanding the assumptions, estimates, and accounting policies used in preparing the financial statements.ConclusionIn conclusion, analyzing a company's financial report involves a thorough examination of its income statement, balance sheet, cash flow statement, and notes to the financial statements. By assessing key financial metrics and trends, stakeholders can gain valuable insights into the company's financial performance, stability, and growth prospects. It is essential to compare the company's performance with industry benchmarks and historical data to make informed decisions.第3篇Introduction:Financial reporting is a crucial aspect of any business, providing stakeholders with insights into the company's financial performance and position. This analysis aims to delve into the financial report of a hypothetical company, evaluating its profitability, liquidity, solvency, and efficiency. By examining key financial ratios and trends, this paper will provide a comprehensive overview of the company's financial health.1. Introduction to the Companya. Company Overviewb. Industry Analysisc. Financial Report Context2. Revenue and Profitability Analysisa. Revenue Trends1. Sales Revenue2. Service Revenue3. Product Revenueb. Profitability Ratios1. Gross Profit Margin2. Operating Profit Margin3. Net Profit Marginc. Profitability Analysis1. Factors Contributing to Profitability2. Factors Affecting Profitability3. Liquidity Analysisa. Current Ratiob. Quick Ratioc. Operating Cash Flowd. Liquidity Analysis1. Factors Affecting Liquidity2. Importance of Liquidity4. Solvency Analysisa. Debt-to-Equity Ratiob. Interest Coverage Ratioc. Solvency Analysis1. Factors Affecting Solvency2. Importance of Solvency5. Efficiency Analysisa. Inventory Turnover Ratiob. Accounts Receivable Turnover Ratioc. Accounts Payable Turnover Ratiod. Efficiency Analysis1. Factors Affecting Efficiency2. Importance of Efficiency6. Financial Ratios and Comparisonsa. Comparison with Industry Averagesb. Comparison with Peersc. Strengths and Weaknesses7. Conclusiona. Summary of Key Findingsb. Recommendations for Improvementc. Future Outlook1. Introduction to the Companya. Company Overview:The hypothetical company, XYZ Corp., is a multinational corporation operating in the technology sector. It specializes in the development and manufacturing of cutting-edge electronic devices and software solutions. The company has been in operation for the past 20 years and has a strong presence in various global markets.b. Industry Analysis:The technology industry is characterized by rapid innovation, high competition, and continuous technological advancements. It is a highly dynamic sector, with companies constantly striving to stay ahead of the curve. The industry is also known for its high growth potential and volatility.c. Financial Report Context:The financial report analyzed in this paper covers a period of three years, from 2019 to 2021. The report includes the company's income statement, balance sheet, and cash flow statement. The data used in this analysis are derived from the annual reports of XYZ Corp.2. Revenue and Profitability Analysisa. Revenue Trends:i. Sales Revenue: XYZ Corp.'s sales revenue has shown a steady increase over the past three years, growing from $5 billion in 2019 to $6.2billion in 2021.ii. Service Revenue: The company's service revenue has also seen a consistent growth rate, increasing from $1.5 billion in 2019 to $1.9 billion in 2021.iii. Product Revenue: The product revenue has experienced a moderate growth, rising from $3.5 billion in 2019 to $4.3 billion in 2021.b. Profitability Ratios:i. Gross Profit Margin: The gross profit margin has fluctuated slightly over the three-year period, ranging from 38% in 2019 to 40% in 2021.ii. Operating Profit Margin: The operating profit margin has remained relatively stable, with an average of 25% over the three years.iii. Net Profit Margin: The net profit margin has seen a slight decline, decreasing from 15% in 2019 to 13% in 2021.c. Profitability Analysis:i. Factors Contributing to Profitability: XYZ Corp.'s profitability can be attributed to its strong brand presence, innovative products, and efficient cost management.ii. Factors Affecting Profitability: The increasing competition and rising raw material costs have posed challenges to the company's profitability.3. Liquidity Analysisa. Current Ratio: The current ratio of XYZ Corp. has remained above 1.5 throughout the three-year period, indicating a healthy liquidity position.b. Quick Ratio: The quick ratio has also been favorable, averaging 1.2 over the three years.c. Operating Cash Flow: The company's operating cash flow has been positive, with an average of $500 million per year.d. Liquidity Analysis:i. Factors Affecting Liquidity: XYZ Corp. has managed its liquidity effectively by maintaining a strong current ratio and a positive operating cash flow.ii. Importance of Liquidity: Adequate liquidity ensures that the company can meet its short-term obligations and maintain smooth operations.4. Solvency Analysisa. Debt-to-Equity Ratio: The debt-to-equity ratio of XYZ Corp. has remained relatively stable, averaging 1.2 over the three-year period.b. Interest Coverage Ratio: The interest coverage ratio has been favorable, with an average of 5 over the three years.c. Solvency Analysis:i. Factors Affecting Solvency: XYZ Corp. has maintained a moderate level of debt and a strong interest coverage ratio, ensuring a healthy solvency position.ii. Importance of Solvency: Adequate solvency is crucial for the company's long-term sustainability and access to financing.5. Efficiency Analysisa. Inventory Turnover Ratio: The inventory turnover ratio has fluctuated slightly over the three-year period, ranging from 8 to 10 times.b. Accounts Receivable Turnover Ratio: The accounts receivable turnover ratio has remained stable, averaging 15 times over the three years.c. Accounts Payable Turnover Ratio: The accounts payable turnover ratio has also been stable, averaging 20 times over the three years.d. Efficiency Analysis:i. Factors Affecting Efficiency: XYZ Corp. has managed its inventory and accounts receivable efficiently, resulting in a stable turnover ratio.ii. Importance of Efficiency: Efficient management of assets andliabilities ensures optimal utilization of resources and reduces costs.6. Financial Ratios and Comparisonsa. Comparison with Industry Averages:i. XYZ Corp.'s gross profit margin, operating profit margin, and net profit margin are in line with the industry averages.ii. The company's current ratio and quick ratio are slightly higher than the industry averages, indicating a stronger liquidity position.iii. The debt-to-equity ratio and interest coverage ratio of XYZ Corp. are also in line with the industry averages.b. Comparison with Peers:i. XYZ Corp.'s profitability ratios are comparable to its peers in the technology sector.ii. The company's liquidity and solvency ratios are slightly better than its peers, indicating a stronger financial position.iii. XYZ Corp.'s efficiency ratios are also comparable to its peers.c. Strengths and Weaknesses:i. Strengths: XYZ Corp. has a strong brand presence, innovative products, and efficient cost management.ii. Weaknesses: The company faces increasing competition and rising raw material costs, which could impact its profitability.7. Conclusiona. Summary of Key Findings:i. XYZ Corp. has demonstrated consistent revenue growth andprofitability over the past three years.ii. The company has a healthy liquidity, solvency, and efficiency position.iii. XYZ Corp.'s financial ratios are comparable to industry averages and its peers.b. Recommendations for Improvement:i. The company should focus on cost management to mitigate the impact of rising raw material costs.ii. XYZ Corp. should continue investing in research and development to maintain its competitive edge.iii. The company should explore new markets and diversify its product offerings to reduce dependency on existing markets.c. Future Outlook:i. The technology industry is expected to experience moderate growth over the next few years.ii. XYZ Corp. is well-positioned to capitalize on this growth and maintain its competitive advantage.iii. By implementing the recommended improvements, the company can further strengthen its financial position and achieve sustainable growth.This comprehensive analysis of XYZ Corp.'s financial report provides valuable insights into the company's financial performance and position. By evaluating key financial ratios and trends, stakeholders can make informed decisions regarding their investment in the company.。
会计学财务报表中英文对照外文翻译文献

会计学财务报表中英文对照外文翻译文献(文档含英文原文和中文翻译)译文:中美财务报表的区别(1)财务报告内容构成上的区别1)美国的财务报告包括三个基本的财务报表,除此之外,典型的美国大公司财务报告还包括以下成分:股东权益、收益与综合收益、管理报告、独立审计报告、选取的5-10年数据的管理讨论与分析以及选取的季度数据。
2)我国财务报告不注重其解释,而美国在财务报告的内容、方法、多样性上都比较充分。
中国的评价部分包括会计报表和财务报表,财务报表是最主要的报表,它包括前述各项与账面不符的描述、财会政策与变化、财会评估的变化、会计差错等问题,资产负债表日期,关联方关系和交易活动等等,揭示方法是注意底部和旁注。
美国的财务范围在内容上比财务报表更加丰富,包括会计政策、技巧、添加特定项目的报告, 报告格式很难反映内容和商业环境等等,对违反一致性、可比性原则问题,评论也需要披露的,但也揭示了许多方面,比如旁注、底注、括号内、补充声明、时间表和信息分析报告。
(2)财务报表格式上的比较1)从资产负债表的格式来看,美国的资产负债表有账户类型和报告样式两项描述,而我国是使用固定的账户类型。
另外,我们的资产负债表在项目的使用上过于标准化,不能够很好的反映出特殊的商业项目或者不适用于特殊类型的企业。
而美国的资产负债表项目是多样化的,除此之外,财务会计准则也是建立在资产负债表中资产所有者投资和支出两项要素基础上的,这一点也是中国的财会准则中没有的。
2)从损益表格式的角度来看,美国采用的是多步式,损益表项目分为两部分,营业利润和非营业利润,但是意义不同。
我国的营业利润在范围上比美国的小,例如投资收益在美国是归类为营业利润的而在我国则不属于营业利润。
另外,我国的损益表项目较美国的更加规范和严格,美国校准损益表仅仅依赖于类别和项目。
报告收可以与销售收入及其他收入相联系,也可以和利息收益、租赁收入和单项投资收益相联系;在成本方面,并不是严格的划分为管理成本、财务成本、和市场成本,并且经常性销售费用、综合管理费用以及利息费用、净利息收益都要分别折旧。
- 1、下载文档前请自行甄别文档内容的完整性,平台不提供额外的编辑、内容补充、找答案等附加服务。
- 2、"仅部分预览"的文档,不可在线预览部分如存在完整性等问题,可反馈申请退款(可完整预览的文档不适用该条件!)。
- 3、如文档侵犯您的权益,请联系客服反馈,我们会尽快为您处理(人工客服工作时间:9:00-18:30)。
文献信息:文献标题:The Need Of Financial Statement Analysis In A Firm orAn Orgnization(企业或机构财务报表分析的必要性)国外作者:Suneetha G文献出处:《International Journal of Science Engineering and AdvanceI Technology(JSEAT)》,2017,5(6):731-735.字数统计:2541 单词,15110 字符;中文 4377 汉字外文文献:The Need Of Financial Statement AnalysisIn A Firm Or An OrgnizationAbstract Financial statement analysis play a dominate role in setting the frame watt of managerial decisions through analysis and interpretation of financial statement. This paper discusses about financial … strength and weakness of the company by properly establishing relationship between the items of balance shed and profit and loss account. In order to judge the profitability and financial soundness of the company horizontal, and vertical analyze or done. The various technique used in analyzing financial statement included 'comparative statement, common size statement, trend analysis and ratio analysis. The results suggest that the ratio approach is a highly useful tool in financial statement analysis, especially when a set of ratios is used to evaluate a firm's performance.Key words: Financial statement analysis, to evaluate a firm's performance.'Comparative statement. Common size statement, trend analysis and ratio analysis.1.IntroductionThe basis for financial analysis , planning and decision making is financial information/a business firm has to prepares its financial accounts viz., balance sheet , profit and loss account which provides useful financial information for the purpose of decision making . Financial information is needed to predict. Compare and evaluate the fin's earnings ability. The formers statements viz. profit and loss account shows that operating activities of the concern and the later balance sheet depicts the balance value of the acquired assets and of liabilities at a particular point of time. However these statements don't disclose all of the necessary for ascertaining the financial strengths and weaknesses of an enterprise. it is necessary to analyze the data depicted in the financial statements. The finance manager has certain analytical tools which helps is financial analysis and planning. [Doron nissim, stephen h. Penman, (2003), FinancialStatement Analysis of Leverage and How it Informs About Profitability and Price-to-Book Ratios. Survey of Accounting Studies, Kluwer Academic Publishers] As per examine by 'Doron Nissim. Stephen H. Penman' on Financial proclamation investigation of Leverage and how it illuminates about gainfulness and cost to book proportions, money related explanation examination that recognizes use that emerges in financing exercises from use that emerges in operations. The examination yields two utilizing conditions. one for getting to back operations and one for obtaining over the span of operations. This examination demonstrates that the budgetary explanation investigation clarifies cross-sectional contrasts in present and future rates of return and additionally cost to-snare proportions, which depend on expected rates of profit for value. This investigation helps in understanding working influence contrasts in productivity in the cross-areas. changes in future productivity from current benefit and legally binding working liabilities from evaluated liabilities. [Yating Van, H.W. Chuang,(2010) Financial Ratio Adjustment Process: Evidencefrom Taiwan and North America,1SSN 1450-2887 Issue 43 (2010)0 Euro Journals Publishing, Inc. 2010]2.Financial statements analysisIt is a process of identifying the financial strengths and weaknesses of a firm from the available accounting data and financial statements. The analysis is done by properly establishing the relationship between the items of balance sheet and profit and loss account. The first task of the financial analyst is to determine the information relevant the decision under consideration from the total information contained in financial statement. The second step is to arrange information in a way to highlight significant relationships. The final step is interpretation and drawing of inferences and conclusions. Thus financial analysis is the process of selection, relating and evaluation of the accounting data or information.Purpose of financial statements analysisFinancial statements analysis is the meaningful interpretation of 'financial statements 'for panics demanding financial information. It is not necessary for the proprietors alone. In general, the purpose of financial statements analysis is to aid decision making between the users of accounts•To evaluate past performance and financial position•To predict future performanceTools and techniques of financial analysis:•Comparative balance sheet•Common size balance sheet•Trend analysis•Ratio analysis•Comparative balance sheetComparative financial statements is a statement of the financial position of a business so designed as to facilitate comparison of different accounting variables for drawing useful inferences. Financial statements of two or more business enter prices may be compared over period of years. This is known as inter firm comparison Financial statements of the particular business enter pries may be compared over two periods of years. This is known inter period comparisonCommon size statementsIt facilities the comparison of two or more business entities with a common base .in case of balance sheet, total assets or liabilities or capital can be taken as a common base. These statements are called common measurements or components percentage or 100 percent statements. Since each statement is representated as a %of the total of 100 which in variably serves as the base.In this manner the announcements arranged to draw out the proportion of every benefit of risk to the aggregate of the monetary record and the proportion of every thing of cost or incomes to net deals known as the basic size articulations.Pattern investigationEven examination of money related explanations can likewise be completed by figuring pattern rates. Pattern rate expresses quite a long while's budgetary information as far as a base year. The base year rises to 100 %, with every single other year expressed in some rate of this baseProportion investigationProportion investigation is the technique or process by which the relationship of things or gatherings of things in the budgetary proclamations are registered. decided and introduced. Proportion investigation is an endeavor to determine quantitativemeasures or aides concerning the money related wellbeing and benefit of the business venture. Proportion investigation can be utilized both in pattern and static examination. There are a few proportions at the examiner yet the gathering of proportions he would incline toward relies upon the reason and the destinations of the investigation.Bookkeeping proportions are viable apparatuses of examination; they are pointers of administrative and over all operational productivity. Proportions, when appropriately utilized are fit for giving valuable data. proportion examination is characterized as the deliberate utilization of proportions to decipher the money related explanations with the goal that the qualities and shortcomings of a firm and in addition its chronicled execution and current monetary condition can be resolved the term proportion alludes to the numerical or quantitative connection between things factors this relationship can be communicated as:(1)Fraction(2)Percentages(3)Proportion of numbersThese option strategies for communicating things which are identified with each other are, for reason for money related investigation, alluded to as proportion examination. It ought to be seen that processing the proportion does not include any data in the figures of benefit or deals. What the proportions do is that they uncover the relationship in a more important manner in order to empower us to reach inferences from them.As indicated by look into by the Yating yang and 11.W. Chuang. on 'Monetary Ratio Adjustment Process: Evidence from Taiwan and North America'. measurable legitimacy of the proportion strategy in monetary articulation examination is researched. The outcomes hence recommend that the proportion approach is a valuable instrument in monetary explanation investigation, particularly when an arrangement of proportions is utilized to assess an association's execution. Thestraightforwardness of this strategy additionally underpins the utilization of proportions in money related basic leadership.3.Money related proportions in perspective of GAAPGAAP is the arrangement of standard systems for recording business exchanges and detailing accounting report passages. The components of GAAP incorporate norms for how to figure income, how to arrange things on a monetary record, and how to ascertain exceptional offer estimations. The models fused into (MAP give general consistency in assumes that are thusly used to ascertain imperative money related proportions that financial specialists and investigators use to assess the organization. Indeed, even agreeable monetary records can be trying to unravel, yet without a framework characterizing every class of section, corporate money related articulations would be basically dark and useless.There are seven fundamental rule that guide the foundation of the Generally Accepted Accounting Principles. The standards of normality, consistency, perpetual quality and genuineness go towards the urging organizations to utilize the same legitimate bookkeeping hones quarter after quarter in a decent confidence push to demonstrate the genuine money related state of the organization. None remuneration, judiciousness and progression build up rules for how to set up a monetary record, by and large to report the budgetary status of the organization as it is without treating resources in irregular ways that distort the operations of the organization just to balance different sections. The rule of periodicity basic implies that salary to be gotten extra time ought to be recorded as it is booked to be gotten, not in a singular amount in advance.The brought together arrangement of bookkeeping in this manner has various advantages. Not exclusively does it give a specific level of straightforwardness into an organization's funds. it likewise makes for generally simple examinations betweenorganizations. Subsequently, GAAP empowers venture by helping financial specialists pick shrewdly. GAAP gives America organizations preference over remote ones where financial specialists, unless they have a cozy comprehension of the business, may have a great deal more trouble figuring the potential dangers and prizes of a venture. GAAP applies to U.S.- based enterprises just, however every other real nation has bookkeeping measures set up for their local organizations. Now and again, remote bookkeeping is genuinely like U.S. GAAP, changing in just minor and effectively represented ways. In different cases, the models change fundamentally making direct examinations questionable, best case scenario.4.Advantages and Limitations of Financial Ratio AnalysisFinancial ratio analysis is a useful tool for users of financial statement. It has following advantages:Focal points•It improves the money related proclamations.•It helps in contrasting organizations of various size and each other.•It helps in drift examination which includes looking at a solitary organization over a period.•It highlights imperative data in basic frame rapidly. A client can judge an organization by simply taking a gander at few number as opposed to perusing of the entire monetary explanations.RestrictionsRegardless of convenience, finance.ial proportion examination has a few burdens. Some key faults of budgetary proportion examination are:•Different organizations work in various enterprises each having distinctivenatural conditions, for example, control, showcase structure, and so on. Such factors curve so huge that a correlation of two organizations from various ventures may be deceiving.•Financial bookkeeping data is influenced by assessments and presumptions. Bookkeeping principles permit diverse bookkeeping arrangements, which disables likeness and subsequently proportion examination is less helpful in such circumstances.• Ratio investigation clarifies connections between past data while clients are more worried about present and future data.The investigation helps for breaking down the alteration procedure of money related proportions; the model states three impacts which circular segment an association's interior impact, expansive impact, and key administration. It encourages us to clarify(1)That a company's budgetary proportions reflect unforeseen changes in the business.(2)Active endeavors to accomplish the coveted focus by administration and(3)An individual association's money related proportion development.DialogMonetary proclamations investigation is the way toward looking at connections among components of the organization's 'bookkeeping articulations" or money related explanations (accounting report, salary articulation. proclamation of income and the announcement of held profit) and making correlations with pertinent data. It is a significant instrument utilized by financial specialists. leasers, monetary investigators. proprietors. administrators and others in their basic leadership handle The most well known sorts of money related explanations examination curve:•Horizontal Analysis: monetary data are thought about for at least two years for asolitary organization:•Vertical Analysis: every thing on a solitary monetary explanation is figured as a rate of an aggregate for a solitary organization;•Ratio Analysis: analyze things on a solitary budgetary articulation or look at the connections between things on two monetary proclamations.Money related proportions examination is the most widely recognized type of budgetary explanations investigation. Monetary proportions delineate connections between various parts of an organization's operations and give relative measures of the company's conditions and execution. Monetary proportions may give intimations and side effects of the money related condition and signs of potential issue regions. It by and large holds no importance unless they are looked at against something else, as past execution, another organization/contender or industry normal. In this way, the proportions of firms in various enterprises, which confront distinctive conditions, are generally difficult to analyze.Money related proportions can be a critical instrument for entrepreneurs and administrators to gauge their advance toward achieving organization objectives, and toward contending with bigger organizations inside an industry; likewise, following different proportions after some time is an intense approach to recognize patterns. Proportion examination, when performed routinely after some time, can likewise give assistance independent ventures perceive and adjust to patterns influencing their operations.Money related proportions are additionally utilized by financiers. Speculators and business experts to survey different traits of an organization's monetary quality or working outcomes, this is another motivation behind why entrepreneurs need to comprehend money related proportions in light of the fact that, all the time, a business' capacity to get financing or value financing will rely upon the organization's budgetary proportions. Money related proportions are ordered by the monetary part ofthe business which the proportion measures. Liquidity proportions look at the accessibility of organization's money to pay obligation. Productivity proportions measure the organization's utilization of its benefits and control of its costs to create a satisfactory rate of return. Use proportions look at the organization's techniques for financing and measure its capacity to meet budgetary commitments. Productivity proportions measure how rapidly a firm changes over non-money resources for money resources. Market proportions measure financial specialist reaction to owning an organization's stock and furthermore the cost of issuing stock.5.ConclusionProportion Analysis is a type of Financial Statement Analysis that is utilized to acquire a snappy sign of an association's money related execution in a few key territories. Proportion investigation is utilized to assess connections among money related proclamation things. The proportions are utilized to distinguish inclines after some time for one organization or to look at least two organizations at one point in time. Money related explanation proportion investigation concentrates on three key parts of a business: liquidity, benefit, and dissolvability.The proportions are sorted as Short-term Solvency Ratios, Debt Management Ratios, and Asset Management Ratios. Productivity Ratios, and Market Value Ratios. Proportion Analysis as an instrument has a few vital elements. The information, which are given by budgetary proclamations. are promptly accessible. The calculation of proportions encourages the examination of firms which contrast in measure. Proportions can be utilized to contrast an association's money related execution and industry midpoints. What's more, proportions can be utilized as a part of a type of pattern investigation to recognize zones where execution has enhanced or crumbled after some time. Since Ratio Analysis depends on bookkeeping data, its adequacy is restricted by the bends which emerge in budgetary explanations because of such things as Historical Cost Accounting and swelling. Thusly, Ratio Analysis should justbe utilized as an initial phase in money related examination, to get a snappy sign of an association's execution and to distinguish territories which should be explored further.中文译文:企业或机构财务报表分析的必要性摘要财务报表分析在制定管理决策框架方面起着主导作用,其方法是通过对财务报表进行分析和解释。