2.FluorCam叶绿素荧光成像技术
Fluorcam多光谱荧光成像技术及其应用
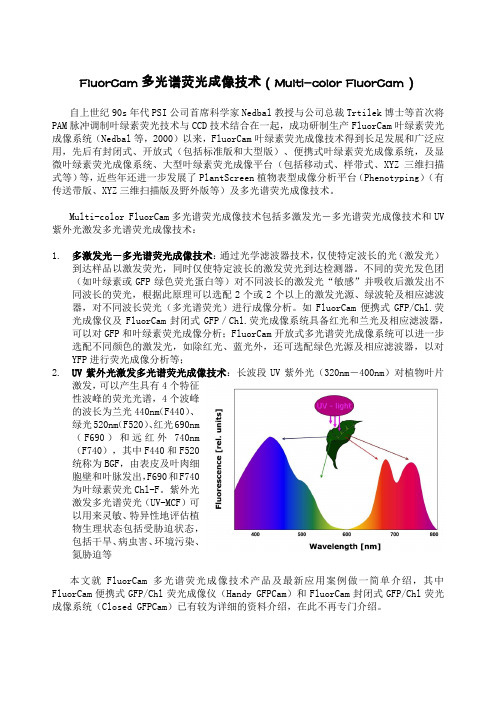
FluorCam多光谱荧光成像技术(Multi-color FluorCam)自上世纪90s年代PSI公司首席科学家Nedbal教授与公司总裁Trtilek博士等首次将PAM脉冲调制叶绿素荧光技术与CCD技术结合在一起,成功研制生产FluorCam叶绿素荧光成像系统(Nedbal等,2000)以来,FluorCam叶绿素荧光成像技术得到长足发展和广泛应用,先后有封闭式、开放式(包括标准版和大型版)、便携式叶绿素荧光成像系统,及显微叶绿素荧光成像系统、大型叶绿素荧光成像平台(包括移动式、样带式、XYZ三维扫描式等)等,近些年还进一步发展了PlantScreen植物表型成像分析平台(Phenotyping)(有传送带版、XYZ三维扫描版及野外版等)及多光谱荧光成像技术。
Multi-color FluorCam多光谱荧光成像技术包括多激发光-多光谱荧光成像技术和UV 紫外光激发多光谱荧光成像技术:1.多激发光-多光谱荧光成像技术:通过光学滤波器技术,仅使特定波长的光(激发光)到达样品以激发荧光,同时仅使特定波长的激发荧光到达检测器。
不同的荧光发色团(如叶绿素或GFP绿色荧光蛋白等)对不同波长的激发光“敏感”并吸收后激发出不同波长的荧光,根据此原理可以选配2个或2个以上的激发光源、绿波轮及相应滤波器,对不同波长荧光(多光谱荧光)进行成像分析。
如FluorCam便携式GFP/Chl.荧光成像仪及FluorCam封闭式GFP/Chl.荧光成像系统具备红光和兰光及相应滤波器,可以对GFP和叶绿素荧光成像分析;FluorCam开放式多光谱荧光成像系统可以进一步选配不同颜色的激发光,如除红光、蓝光外,还可选配绿色光源及相应滤波器,以对YFP进行荧光成像分析等;2.UV紫外光激发多光谱荧光成像技术:长波段UV紫外光(320nm-400nm)对植物叶片激发,可以产生具有4个特征性波峰的荧光光谱,4个波峰的波长为兰光440nm(F440)、绿光520nm(F520)、红光690nm(F690)和远红外740nm(F740),其中F440和F520统称为BGF,由表皮及叶肉细胞壁和叶脉发出,F690和F740为叶绿素荧光Chl-F。
植物表型组学研究技术(一)FluorCam 叶绿素荧光成像技术
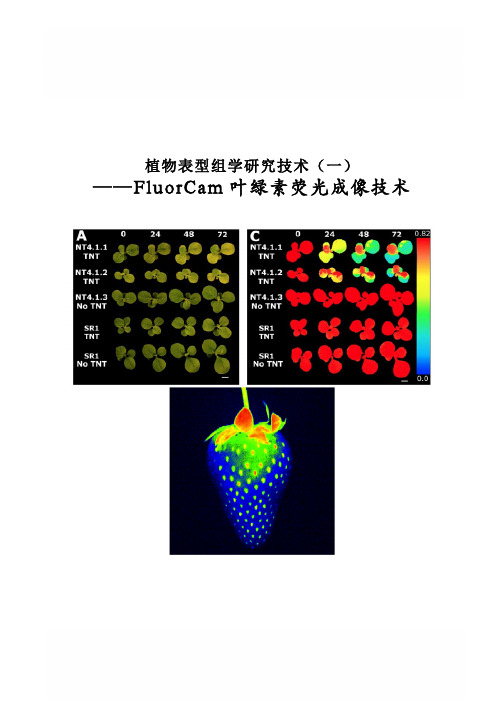
植物表型组学研究技术(一) ——FluorCam叶绿素荧光成像技术FluorCam叶绿素荧光成像技术Rousseau等(High throughput quantitative phenotyping of plant resistance using chlorophyll fluorescence image analysis.Plant Methods, 2013, 9:17),利用FluorCam开放式叶绿素荧光成像系统作为高通量表型分析平台,采用图像阈值分割等分析方法,对植物病原体感染进行了定量分析检测,根据Fv/Fm将感染分为不同阶段/等级,特别是可以将用其它方法难以分辨出来的感染前期加以分辨,并对5个品种的菜豆对普通细菌性疫病的抗性进行了定量分析评价。
PSI公司首席科学家Nedbal教授与公司总裁Trtilek博士等首次将PAM叶绿素荧光技术(Pulse Amplitude Modulated technique——脉冲调制技术)与CCD技术结合在一起,于1996年在世界上成功研制生产出FluorCam叶绿素荧光成像系统(Heck等,1999;Nedbal等,2000;Govindjee and Nedbal, 2000)。
FluorCam叶绿素荧光成像技术成为上世纪90年代叶绿素荧光技术的重要突破,使科学家对光合作用与叶绿素荧光的研究一下子进入二维世界和显微世界,广泛应用于植物生理生态、植物胁迫与抗性监测、作物育种、植物表型分析等。
不同于其它成像分析技术,FluorCam叶绿素荧光成像只对叶绿素荧光波段敏感,可以有效避免环境光的干扰,特异性、高灵敏度反映植物生理生态状况。
主要功能特点如下:1)高灵敏度CCD,时间分辨率可达50帧/秒,有效抓取叶绿素荧光瞬变;可选配高分辨率CCD,分辨率1392x1040像素,用于气孔功能成像分析、稳态荧光如GFP荧光测量等2)具备完备的自动测量程序(protocol),可自由对自动测量程序进行编辑:a)Fv/Fm:测量参数包括Fo,Fm,Fv,QY等b)Kautsky诱导效应:Fo,Fp,Fv,Ft_Lss,QY,Rfd等荧光参数c)荧光淬灭分析:Fo,,Fm,Fp,Fs,Fv,QY,ΦIINPQ,Qp,Rfd,qL等50多个参数d)光响应曲线LC:Fo,Fm,QY,QY_Ln等荧光参数e)PAR吸收f)GFP等静态荧光测量g)OJIP与JIP-test(FKM与封闭式荧光成像系统):Fo,Fj,Fi,P 或Fm,Mo(OJIP曲线初始斜率)、OJIP固定面积、Sm(对关闭所有光反应中心所需能量的量度)、QY、PI等26个参数3)自动重复实验功能,可无人值守自动循环完成选定的实验程序,重复次数及间隔时间客户自定义,成像测量数据自动按时间日期存入计算机4)FluorCam成像分析软件:具在线功能(Live)、实验程序选配功能(Protocols)、成像预处理功能(Pre-processing)及成像分析结果展示报告功能(Result)四大功能模块a)在线功能(live):可对仪器和样品进行在线测试调试、快照、显示实验进度、在线显示荧光瞬变动态视频等b)实验程序选配功能(protocols):可选配不同的实验程序,并可对实验程序进行编辑、设置、储存(以备以后使用同样的实验程序)等c)成像预处理功能:可浏览整个测量视频及任何点、任何区域的荧光动态变化曲线,可进行“选区操作”或“分级操作”(图像阈值分割功能);选区操作可对成像进行自动或手动选区(ROI),还可使用“模具”包括多孔板模具、培养皿模具、桌面模具进行模具选区;分级操作具备荧光强度刻度标尺和四个“游标”,通过移动4个游标可以将成像按不同强度划分成不同的荧光范围组进行分析处理,可设置不同的阈值进行图像阈值分割d)结果展示报告功能:可展示所有选区(ROI)的叶绿素荧光参数值及其图像、每个参数的频率直方图及每个ROI的荧光动态图等,可对原数据(kinetic)、叶绿素荧光参数等导出到excel表,还可对每个参数成像图存储成位图5)数据分析具备“信号计算再平均”模式(算数平均值)和“信号平均再计算模式”两种功能模式,在高信噪比的情况下选用“信号计算再平均”模式,在低信噪比的情况下选择“信号平均再计算”模式以过滤掉噪音带来的误差FluorCam叶绿素荧光参数:参数符号概念描述Size 面积(像素值),经校准可测量实际面积Fo 暗适应后的最小荧光Fo_Dn 暗松弛最小荧光,红外光诱导PSIFo_Ln 光适应后的最小荧光,红外光诱导PSIFo_Lss 光适应后稳态最小荧光,红外光诱导PSIFm 暗适应后最大荧光Fm_Dn 暗松弛最大荧光Fm_Ln 光适应最大荧光Fm_Lss 光适应稳态最大荧光Fp Kautsky诱导效应最大荧光Ft_Dn 暗松弛即时荧光Ft_Ln 光适应即时荧光Ft_Lss 光适应稳态荧光Fv Fm-FoNPQ_Dn 暗松弛非光化荧光淬灭,=(Fm-Fm_Dn)/Fm_DnNPQ_Ln 光适应非光化荧光淬灭,=(Fm-Fm_Ln)/Fm_LnNPQ_Lss 稳态非光化荧光淬灭,=(Fm-Fm_Lss)/Fm_LssqP_Dn 暗松弛光化学荧光淬灭,=(Fm_Dn−Ft_Dn)/Fm_Dn−Fo_DnqP_Ln 光适应光化学淬灭,=(Fm_Ln−Ft_Ln)/(Fm_Ln−Fo_Ln)qP_Lss 稳态光适应光化学淬灭,=(Fm_Lss−Ft_Lss)/(Fm_Lss−Fo_Lss)qL_Ln 基于“Lake”模型的光适应光化学淬灭qL_Lss 基于“Lake”模型的稳态光适应光化学淬灭QY_Dn 暗松弛光量子效率,=(Fm_Dn−Ft_Dn)/Fm_DnQY_Ln或ΔF/Fm 光适应光量子效率,=(Fm_Ln−Ft_Ln)/Fm_LnQY_Lss 稳态光量子效率,=(Fm_Lss−Ft_Lss)/Fm_LssFv/Fm或QY_max 最大光量子效率Fv/Fm_Ln 光适应光量子效率,=(Fm_Ln−Fo_Lss)/Fm_LnFv/Fm_Lss 稳态光量子效率,=(Fm_Lss−Fo_Lss)/Fm_LssRfd_Ln 光适应荧光衰减率,用于评估植物活力,=(Fp−Ft_Ln)/Ft_LnRfd_Lss 稳态荧光衰减率,用于评估植物活力,=(Fp−Ft_Lss)/Ft_Lss除上述叶绿素荧光参数外,还可以成像测量PAR吸收、植物光谱反射指数NDVI等,叶片大小(或植物大小)可以反映植物的生长等。
FluorCam叶绿素荧光成像文献 2012 Genetic Analysis of the Hox Hydrogenase

Genetic Analysis of the Hox Hydrogenase in theCyanobacterium Synechocystis sp.PCC 6803Reveals Subunit Roles in Association,Assembly,Maturation,and Function *□SReceived for publication,June 15,2012,and in revised form,November 7,2012Published,JBC Papers in Press,November 8,2012,DOI 10.1074/jbc.M112.392407Carrie Eckert ‡1,Marko Boehm ‡§,Damian Carrieri ‡,Jianping Yu ‡,Alexandra Dubini ‡,Peter J.Nixon §,and Pin-Ching Maness ‡From the ‡Biosciences Center,National Renewable Energy Laboratory,Golden,Colorado 80401and the §Department of Life Sciences,Imperial College London,South Kensington Campus,London SW72AZ,United KingdomHydrogenases are metalloenzymes that catalyze 2H ؉؉2e ؊7H 2.A multisubunit,bidirectional [NiFe]-hydrogenase has been identified and characterized in a number of bacteria,including cyanobacteria,where it is hypothesized to function as an electron valve,balancing reductant in the cell.In cyanobac-teria,this Hox hydrogenase consists of five proteins in two func-tional moieties:a hydrogenase moiety (HoxYH)with homology to heterodimeric [NiFe]-hydrogenases and a diaphorase moiety (HoxEFU)with homology to NuoEFG of respiratory Complex I,linking NAD(P)H 7NAD(P)؉as a source/sink for electrons.Here,we present an extensive study of Hox hydrogenase in the cyanobacterium Synechocystis sp.PCC 6803.We identify the presence of HoxEFUYH,HoxFUYH,HoxEFU,HoxFU,and HoxYH subcomplexes as well as association of the immature,unprocessed large subunit (HoxH)with other Hox subunits and unidentified factors,providing a basis for understanding Hox maturation and assembly.The analysis of mutants containing individual and combined hox gene deletions in a common parental strain reveals apparent alterations in subunit abun-dance and highlights an essential role for HoxF and HoxU in complex/subcomplex association.In addition,analysis of indi-vidual and combined hox mutant phenotypes in a single strain background provides a clear view of the function of each subunit in hydrogenase activity and presents evidence that its physiolog-ical function is more complicated than previously reported,with no outward defects apparent in growth or photosynthesis under various growth conditions.Hydrogenase enzymes are a unique and diverse family of metalloenzymes widely distributed throughout Archaea,Pro-karyotes,and some unicellular Eukaryotes that catalyze the reduction/oxidation of H ϩ/H 2.These enzymes are classified by their metal-containing active sites and include [Fe]-hydroge-nases,[FeFe]-hydrogenases,and [NiFe]-hydrogenases (1).The [NiFe]-hydrogenases are minimally heterodimeric,consisting of a large catalytic subunit and a small subunit containing at least one [FeS]cluster that functions in electron transfer to and from the large subunit (1).The maturation of [NiFe]-hydroge-nases involves at least six maturation proteins (HypABCDEF)essential for the assembly of the [NiFe]active site.Some [NiFe]-hydrogenases additionally require a specialized protease that cleaves the large subunit’s C terminus,a step required for hydrogenase function (2).Research in Escherichia coli suggests that the hydrogenase small subunit only associates with the large subunit after it is fully processed (3).Among the diverse hydrogenases,the bidirectional [NiFe]-hydrogenase (Hox)in cyanobacteria is of great interest for basic biological study as well as for the development of solar hydrogen production technologies (4–6).NAD(P)-linked Hox hydrogenases have been identified and characterized in cyano-bacteria (4,5),the Gram-positive bacterium Rhodococcus opacus (7,8),the Gram-negative bacterium Ralstonia eutropha (6),and the purple sulfur photosynthetic bacteria Thiocapsa roseopersicina and Allochromatium vinosum (9–12).These Hox hydrogenases are multimeric with at least four related sub-units expressed from a single operon.HoxH and HoxY form the hydrogenase moiety and are homologous to the large and small subunits of prototypical heterodimeric [NiFe]-hydrogenases,respectively (1).The [FeS]cluster-containing subunits HoxF,HoxU,and,in some organisms,HoxE form the diaphorase moi-ety (13,14)that catalyzes the oxidation/reduction of NAD(P)H/NAD(P)ϩ(via FMN and NAD binding sites in HoxF)coupled to the hydrogenase moiety (HoxYH)(10,12–15).The R.eutropha Hox hydrogenase does not contain HoxE and instead harbors an unrelated fifth subunit,HoxI,which functions in linkage to NADPH (16).*This work was supported by the National Renewable Energy Laboratory’sLaboratory Directed Research and Development Program (to P.M.,J.Y.,C.E.,and D.C.),the United States Department of Energy Fuel Cell Technol-ogies Program (contract number DE-AC36-08-GO28308)(to P.M.and J.Y.),the United States Department of Energy Biological and Environmental Research Program (contract KP160103)(to M.B.and A.D.),and Engineer-ing and Physical Sciences Research Council Grant (EP/F002070X/1)(to M.B.and P.N.).□SThis article contains supplemental Table 1and Figs.1–5.1To whom correspondence should be addressed:Biosciences Center,NREL,15013Denver West Pkwy.,Golden,CO 80401.Tel.:303-384-6891;Fax:303-384-7836;E-mail:carrie.eckert@.THE JOURNAL OF BIOLOGICAL CHEMISTRY VOL.287,NO.52,pp.43502–43515,December 21,2012Published in the U.S.A.at NATL RENEWABLE ENERGY, on January 16, 2013 Downloaded from /content/suppl/2012/11/08/M112.392407.DC1.htmlSupplemental Material can be found at:Purification of the Hox hydrogenase has been performed in some of the organisms it has been characterized in with varied results.In R.eutropha,the purified Hox complex is Hox-FUYHI2,although HoxI(not present in other characterized Hox hydrogenases)dissociates easily upon more stringent puri-fication conditions(which is why the complex was initially characterized as HoxFUYH)(16).Other purifications in R.eutropha utilizing gene knockouts and ectopic expression demonstrate that HoxYH and HoxFU subcomplexes can be iso-lated,although these subcomplexes were reportedly unstable (13).In A.vinosum(12)and the cyanobacterium Gleocapsa alpicola CALU743(17),attempted purifications of native com-plex resulted in isolation of only HoxYH,whereas in T.roseop-ersicina(18)and Synechocystis(19,20),intact HoxEFUYH complexes were purified.Purification of the Synechocystis Hox hydrogenase by Schmitz et al.(19)resulted in a dimer of a 1:1:1:1:1HoxE/F/U/Y/H complex via a series of column chro-matography steps,whereas Germer et al.(20)purified a com-plex with a0.2:2:2:1:1HoxE/F/U/Y/H ratio using a StrepII-tagged HoxF,raising questions about Hox complex assembly and association in vivo.The physiological role of Hox hydrogenase varies,depending on the organism in which it is present,but it generally functions in anoxic/micro-oxic conditions due to a reversible inactivationby O2(1).In T.roseopersicina,Hox hydrogenase catalyzes H2production under dark,fermentative conditions and in lightwhen thiosulfate is present and alternatively functions in H2 uptake in light when O2is absent(11).The Hox hydrogenase ofR.eutropha(soluble hydrogenase)functions in H2oxidation linked to the regeneration of NADH in support of carbon fixa-tion(6).In cyanobacteria,Hox hydrogenase is expressed under both anaerobic and aerobic conditions(4,21)but is only active under dark,fermentative conditions and in the transition fromdark to light prior to inhibition by O2generated during photo-synthesis(22–24).Respiration and nitrate assimilation mutantsexhibit increased H2photoevolution rates under low O2condi-tions,whereas defects in photosynthetic reactions/ratios have been reported in Hox hydrogenase mutants(15,22–26).There-fore,it is hypothesized that the Hox hydrogenase functions as an electron valve for cells by H2production/oxidation in response to changes in redox states(25,26).HoxEFU are the only homologs for NuoEFG of respiratory complex I in cyano-bacteria,but there is no evidence to date that these diaphorase subunits play any role in respiration(14,27–30).In this work,we generated a series of Hox hydrogenase mutants in a common parental strain,deleting individual hox genes or combinations of hox genes in the unicellular cyanobac-terium Synechocystis sp.PCC6803.This comprehensive collec-tion of hox mutants enabled us to perform systematic studies of mutation effects on complex/subcomplex formation and com-position,subunit abundance,and hydrogenase activity.In addi-tion,we also provide data for growth,photosynthesis,and fer-mentation in a hox operon deletion mutant compared with wild type(WT),revealing that some previously reported hox mutant phenotypes may have been due to differences in strain back-grounds(31,32).EXPERIMENTAL PROCEDURESStrain Background/Construction—All hox mutants weregenerated in a Synechocystis sp.PCC6803glucose-tolerant strain from Teruo Ogawa,who also provided the whole operon deletion,hoxϪ::hygromycin resistance.The hoxHϪdeletion was constructed in a pSMART LC-Amp vector(Lucigen,Inc.) containing a3.6-kb region spanning hoxY and hoxH cut with SspI(removing816bp of hoxH)to insert the kanamycin resist-ance cassette from pUC4K.All remaining hox deletion strains were created by two-step fusion PCR(33)for open reading frame(ORF)replacement,combiningϳ600-bp5Ј-and3Ј-flanking regions for each hox gene ORF replaced with the fol-lowing antibiotic resistance gene ORFs:hoxEϪ::aac3ia(gen-tamicin resistance),hoxFϪ::ermC(erythromycin resistance), hoxUϪ::aph(kanamycin resistance),and hoxYϪ::dfra17(spec-tinomycin resistance).An slr0168neutral site integration vec-tor containing a plastocyanin(petE)promoter for ectopic gene expression(34)was altered by the addition of a225-bp frag-ment from pETDuet containing the T7terminator into the PpuMI restriction site.PCR primers to amplify HoxYH or HoxH from genomic DNA were constructed with sequence encoding His6/HRV3C protease site at the N terminus and5Ј-and3Ј-specific SapI sites for insertion behind the petE pro-moter following restriction digestion and ligation.The pPSBA2KS vector for the integration behind the psbAII pro-moter(35)was altered by removal of a SalI site via partial digest and blunting to allow for retention of the kanamycin resistance gene.PCR primers were designed for amplification and inser-tion of an N-terminal His6-tagged hoxE gene between NdeI and SalI sites.Transformations were conducted by incubatingϳ1g of linear purified fusion PCR products or targeted integra-tion vectors with200l of cells(adjusted to OD730ϭ2.5fromcell cultures at OD730ϭ0.2–0.5)for6h,followed by the addi-tion of2ml of BG11,24-h outgrowth in culture tubes under standard growth conditions,and plating of200l on BG11 plates with antibiotics as required for selection(200g/ml hygromycin or kanamycin,100g/ml gentamicin,erythromy-cin,spectinomycin,or chloramphenicol).Strain Growth—Cultures were inoculated into BG11medium(ATCC medium616)supplemented with3M NiCl2,20m M TES(unbuffered),100m M NaHCO3,and antibiotics as required(one-half concentrations as used on plates listedabove)at an initial OD730ϭ0.05and were grown by shaking inculture flasks with5%CO2under50microeinsteins2(E)mϪ2 sϪ1continuous light from cool white fluorescent bulbs.Cul-tures were generally grown to logarithmic/linear growth phase(OD730ϭ0.2–0.8)for analysis.FPLC Analysis of Synechocystis sp.PCC6803WT Soluble Extract—Soluble extract was prepared from a WT50-ml liquidculture at an OD730Ͼ1(stationary phase).Cells were har-vested,resuspended,and washed twice in ACA buffer(750m M ⑀-amino caproic acid,50m M BisTris/HCl,pH7.0,0.5m M EDTA).Approximately200l of glass beads(150–212m;2The abbreviations used are:E,microeinsteins;MV,methyl viologen;BN,blue native;PSI and PSII,photosystem I and II,respectively;ETR,electron transport rate;BisTris,2-[bis(2-hydroxyethyl)amino]-2-(hydroxymethyl)propane-1,3-diol.Cyanobacterial Hox Hydrogenase Complex Association and Functionat NATL RENEWABLE ENERGY, on January 16, Downloaded fromSigma-Aldrich)were added to the cell suspension(ϳ500l), and cells were broken using a Disruptor Genie digital multi-place vortexer(Scientific Industries)at4°C for5min,setting 3,000,followed by centrifugation for10min at maximum speed in a microcentrifuge.Subsequently,2l of DNase I(10,000 units/ml,Thermo Scientific)was added,and the sample was spun again in an ultracentrifuge at100,000ϫg for30min at 4°C.For FPLC,the resulting supernatant was normalized toOD650ϭ10(typically,the OD650of a1:20dilution was mea-sured).To solubilize any remaining thylakoid membrane frag-ments,-dodecyl-D-maltoside was added to a final concentra-tion of0.5%(w/v)from a10%(w/v)stock solution.100l of this soluble extract was loaded onto a Superdex20010/300size exclusion column(GE Healthcare)connected to an Akta Puri-fier FPLC system(GE Healthcare).The sample was run at a flow rate of0.5ml minϪ1with50m M Tris,pH7.5,100m M NaCl,and 0.03%(w/v)-dodecyl-D-maltoside as the buffer.0.5-ml frac-tions were collected by a Frac-950fraction collector(GE Healthcare).A high molecular weight marker mix(GE Health-care)was run as a control for relative protein sizes in the frac-tions(supplemental Fig.1).Protein Preparations,Two-dimensional Blue Native/SDS-PAGE,Affinity Purification,and Western Blotting—Soluble extracts for two-dimensional blue native/SDS-PAGE(BN/ SDS-PAGE)were prepared as described for FPLC analysis above for WT and hox mutant strains,and the extracts werenormalized to an A650ϭ0.6.-Dodecyl-D-maltoside was addedto a final concentration of0.5%(w/v),and the same volume ofCoomassie loading solution(750m M⑀-amino caproic acid,5% (w/v)Coomassie-G)was added to the sample.Subsequently,20l of the sample was loaded per lane and run on a12%(w/v) polyacrylamide BN PAGE first dimension gel.The proteincomplexes in the first dimension gel strips were denatured for1h in solubilization buffer(66m M Na2CO3,2%(w/v)SDS,2%(v/v)-mercaptoethanol,and4M urea)prior to being layered on17.5%(w/v)polyacrylamide,6M urea two-dimensional SDS-polyacrylamide gels(36).The resultant two-dimensional gels were either Coomassie-stained,silver-stained(37),or electro-blotted onto nitrocellulose membranes.For WT and hox mutant one-dimensional Western blots and affinity purifications,cells were resuspended in20m M phos-phate buffer,pH7.4,plus protease inhibitors(Fermentas)and broken by bead disruption as described above.Protein concen-trations were determined by Bradford assay(Fermentas),and levels of each sample were adjusted toϳ100g/ml.For purifi-cation of His6-tagged proteins/complexes,Co2ϩbeads(Pierce)were added to cleared lysates and incubated for1h at4°C,and washes were performed using5times bead volume with20m M phosphate buffer,pH7.4,with or without0.5M NaCl through reloadable columns(Pierce).Beads were resuspended in a50% slurry in buffer.To rule out nonspecific binding of Hox proteins to beads,untagged WT samples were also subjected to the same regime,and a lack of Hox proteins in bead samples was verified by Western blot(data not shown).Samples for SDS-PAGE were boiled in1ϫLaemmli sample buffer(Bio-Rad),and10l of each was loaded onto precast TGX Stain-free Any kDa gels (Bio-Rad)and transferred onto a PVDF membrane(Bio-Rad). For Western blotting,the SnapID system(Millipore)was used according to the manufacturer’s instructions.Membranes were blocked in5%BSA,1ϫPBST,and primary and secondary anti-bodies were diluted in1%BSA,1ϫPBST.Polyclonal rabbit primary antibodies developed for this study were generated usingϳ20-amino acid C-terminal peptides(␣-HoxE,-F,-U,-Y,and-H(C-terminal);␣-HoxF and␣-HoxY from these prepara-tions are not shown but were used in quantitation of one-di-mensional Western blots)and a HoxH internal peptide(amino acids300–318)that allows recognition of both processed and unprocessed HoxH(YenZym,San Francisco,CA).␣-HoxY and ␣-HoxF antibodies were also generated in rabbit using full-length E.coli expressed protein(SeqLab).␣-Rps1(Agrisera;notshown)and␣-PsaD antibodies(38)were used as loading con-trols for normalization of band intensities for relative protein level quantitation.Secondary incubation was performed with Clean Blot HRP(Pierce),and Cell Biosciences ChemiWest or Pierce Dura Chemiluminescent reagents were used for signal development.Images and quantitation analysis were processed using a Cell Biosciences FluoroCam Q Gel imaging system. Hydrogenase Assays—Cells grown to similar logarithmicgrowth densities(OD730ϭ0.2–0.8)were concentrated toOD730ϭ2.5,and200l was added to600l of assay mixture containing Triton X-100(0.05%,w/v),phosphate buffer(50 m M,pH7),and either methyl viologen(MV;1m M final)or NADH(1m M final)in2-ml HPLC vials sealed with anaerobic septa.The mixture was sparged with argon for10min,100l of anaerobic sodium dithionite(10m M final)was added,and the mixture was incubated with shaking for30min at37°C.The reaction was stopped by the addition of100l of20%(w/v) trichloroacetic acid,and100l of the1-ml headspace was ana-lyzed using a gas chromatograph(Agilent1100)equipped with a Molecular Sieve5A column,a thermal conductivity detector,and argon as the carrier gas.To measure in vivo H2production,cells were spun down and resuspended to OD730ϭ2.5in2ml of BG11containing5m M glucose,placed in a15-ml culture tube, sealed with anaerobic septum,sparged with argon for30min, and incubated at30°C in the dark for24h.A100-l sample from the13-ml headspace was analyzed using a gas chromato-graph as above.Determination of Doubling Times—Log phase precultures (10ml)of WT and hoxϪstrains were used to inoculate400-ml capacity Photobioreactor culture vessels(FMT400,Photon System Instruments)without the addition of antibiotic to growth medium.Illumination parameters were programmed as listed in Table1.Optical density was measured every1–5min at wavelength maximum680nm and recorded digitally,alongwith pH and O2concentration(not shown).Culture vessels were maintained at30°C and continuously bubbled at a rate of ϳ250ml/min in air or argon supplemented with2%CO2.Opti-cal density values versus time were fitted to a single exponential function to determine doubling times.Fluorescence Measurements—Dark-adapted quantum effi-ciency(Fv/Fm)and effective quantum efficiency under illumi-nation(⌬F/FmЈ)of WT and hoxϪstrain suspensions from log phase cultures were measured in multiwell plates with a closed FluorCam(FC800-C/1010,Photon System Instruments)and used to calculate effective electron transport rates.⌬F/FmЈwas determined for cells under continuous illumination for at leastCyanobacterial Hox Hydrogenase Complex Association and Functionat NATL RENEWABLE ENERGY, on January 16, Downloaded from3min at each light intensity with dark adaption between exper-iments.Cells were dark-adapted for at least 5min prior to measurement and were measured in biological and technical triplicate (minimum number of samples per type ϭ9).RESULTSComposition of Hox Hydrogenase Protein Complexes —Re-ported subunit composition and stoichiometry of purified Hox hydrogenase varies in the literature (12,16–20),raising ques-tions about its in vivo structure.Therefore,we assessed frac-tionation of the Hox hydrogenase complex by performing size exclusion FPLC analysis of Synechocystis WT soluble extracts followed by Western blotting with Hox subunit-specific anti-bodies (Fig.1).As expected,all five subunits,HoxE (18.8kDa),HoxF (57.8kDa),HoxU (26.2kDa),HoxY (20.0kDa),and HoxH (52.9kDa),clearly co-fractionate (fractions 10–14).The band intensities of the diaphorase (HoxEFU)and hydrogenase (HoxYH)subunits fluctuate in a related manner,consistent with HoxYH and HoxEFU subcomplexes observed in purifica-tions of other Hox hydrogenases (12,16,17).The presence of what is probably monomeric HoxE (fractions 20–22)suggests that HoxE may dissociate relatively easily from the complex.Interestingly,unprocessed,immature HoxH co-fractionates with other Hox proteins,including processed HoxH (fractions 10and 16–18),implying association of unprocessed HoxH withother complex subunits prior to maturation and full complex assembly (Fig.1,HoxH (open arrows )and HoxH (C-terminal)blots).In addition,unprocessed HoxH is clearly present in higher molecular weight complexes (fractions 8and 9),reveal-ing its association with other unknown proteins (possibly mat-uration factors)prior to its cleavage.Results from size exclusion FPLC imply the presence of Hox complexes and possible subcomplexes,but co-fractionation does not provide enough evidence to confirm subunit associa-tion.To verify Hox protein complex/subcomplex associations in soluble extracts,we performed two-dimensional BN/SDS-PAGE followed by Western blotting (Fig.2).Using this approach,we were able to identify a complex containing all five Hox subunits,again consistent with the composition of the purified pentameric complex reported in the literature (19,20).The apparent molecular mass of this complex is ϳ160kDa,close to the calculated mass based on the predicted sizes of the individual subunits (175kDa).We note that no dimer of this pentameric hydrogenase protein complex could be reliably detected in our analysis despite previous reports (19).However,we were able to detect the presence of HoxFUYH,HoxEFU,and HoxFU subcomplexes.We also failed to reliably detect a HoxYH subcomplex,yet there was a weak antibody signal for the HoxH subunit with a higher apparent molecular massthanFIGURE 1.FPLC and Western blot analysis of WT Synechocystis sp.PCC 6803Hox hydrogenase.The crude soluble fraction of WT Synechocystis sp.PCC 6803was separated by FPLC,and the resulting fractions were analyzed by Western blotting.A ,silver-stained TGX Any kDa gradient SDS-polyacrylamide gel (Bio-Rad)of starting material (Sol .Extr .)and fractions 1–22(for the chromatogram at A 280and A 420see supplemental Fig.1).B–G ,Western blotting of FPLC fractions with the indicated Hox subunit-specific antibodies.Arrowheads in F indicate the signal for unprocessed HoxH.Cyanobacterial Hox Hydrogenase Complex Association and Functionat NATL RENEWABLE ENERGY, on January 16, 2013 Downloaded fromthat of the free HoxH protein alone (Fig.2G ,asterisk ),suggest-ing the association of HoxH with another protein.Monomeric subunits were also detected in the low molecular mass region of the Western blots,with the HoxE,HoxH,and HoxU subunits all accumulating to significant levels when compared with lev-els of each associated with subcomplexes.We were unable to consistently detect unprocessed HoxH in any of these sub-complexes,suggesting that its possible association may only be transient.Nevertheless,these data reveal for the first time the presence of various subcomplexes of Synechocystis Hox hydrogenase in vivo .Subunit Abundance in Hox Hydrogenase Mutants —The detection of Hox subcomplexes in the WT strain by FPLC and two-dimensional BN/SDS-PAGE analyses prompted us to con-struct mutants of each hox gene alone and in combination in the same parental WT strain (supplemental Fig.2)to further examine any relationship between complex/subcomplex asso-ciations and relative subunit abundance by Western blotting.All of the mutants except for hox Ϫ(whole operon deletion con-structed by T.Ogawa)and hoxH Ϫ(see “Experimental Proce-dures”and supplemental Fig.2)were created by ORF replace-ment with similar size antibiotic resistance genes to avoid changes in operon transcription from additional promoters in antibiotic resistance cassettes or large alterations in sequencesize.As expected,no detectable Western signal for Hox sub-units was apparent when the respective gene was disrupted,confirming full segregation of gene deletions (cyanobacteria carry multiple genome copies)(Fig.3A ).Interestingly,deletion of hoxE ,the first gene in the operon,led to a 2–3-fold increase in the remaining Hox protein subunits (Fig.3B ).The increase in Hox protein levels in this mutant is probably linked to the first 190bp of the hoxE ORF,whose absence results in increased hox transcript levels and possible enhancement in the rate of trans-lation due to a decrease in minimum free energy in the hoxE Ϫmutant mRNA (see “Discussion”and supplemental Fig.3,A–D ).The overexpression of HoxH in the hoxE Ϫmutant leads to a discernible increase in levels of unprocessed HoxH com-pared with WT and other hox mutants (Fig.3A and supplemen-tal Fig.4),consistent with increased unprocessed large subunit when the hydrogenase is overexpressed without additional maturation factors in previous studies (our unpublished results 3for R.eutropha soluble hydrogenase and Refs.13and 20).All other hox mutants exhibited decreased levels of remain-ing complex subunits (Fig.3B ).Levels of HoxH and HoxY are decreased to 20and 10%of WT in the respective hoxY Ϫand hoxH Ϫmutants,whereas HoxE,HoxF,and HoxU levels are less than 5%of WT in hoxF Ϫand hoxU Ϫmutants,highlighting interdependencies for HoxYH and HoxEFU subcomplex pro-tein abundance.In addition,HoxY and HoxH levels are decreased to 15–90%of WT in HoxEFU subcomplex mutants (most notably in hoxU Ϫmutants),and HoxE,HoxF,and HoxU levels are decreased to 25–70%of WT in HoxYH subcomplex mutants,revealing interdependencies in subunit abundance across subcomplexes as well.Hox Subunit Association in Individual Subunit hox Mutants —Although changes in transcription could be responsible for altered subunit abundance observed in hox mutants,the absence of complex subunits could also lead to instability of the remaining subunits because of an inability to form stable Hox complexes/subcomplexes.To assess the association of the remaining Hox subunits when one of the five subunits is absent,we again performed two-dimensional BN/SDS-PAGE and Western blotting of soluble extracts from single-subunit hox mutants (Fig.4).No notable differences in total protein were observed between the WT and hox mutant strains by Coomass-ie-stained one-dimensional BN or silver-stained two-dimen-sional SDS-polyacrylamide gels (data not shown).In the hoxE Ϫstrain,HoxFUYH and HoxFU subcomplexes accumulated (Fig.4A ),consistent with the observation of those subcomplexes in WT (Fig.2).Despite the increased levels of HoxY and HoxH in our hoxE Ϫstrain (Fig.3A ),we still were not able to observe the expected HoxYH subcomplex (Fig.4A ).Interestingly,none of the Hox subcomplexes are detected in hoxF Ϫor hoxU Ϫstrains,with the remaining Hox proteins observed only as unassembled monomers,indicating that HoxF and HoxU are necessary for stable assembly/maintenance of the full Hox complex and Hox subcomplexes (Fig.4,B and C ).In contrast,the diaphorase sub-units are still able to assemble into HoxEFU and HoxFU sub-complexes in hoxY Ϫor hoxH Ϫstrains (Fig.4,D and E ),con-3C.Eckert,J.Yu,and P.-C.Maness,unpublishedresults.FIGURE 2.Two-dimensional BN/SDS-PAGE and Western blot analysis of WT Synechocystis sp.PCC 6803Hox hydrogenase.A ,the soluble fraction of WT Synechocystis sp.PCC 6803was separated on a 12%(w/v)polyacrylamide BN-polyacrylamide gel followed by two-dimensional separation on a 17.5%(w/v)polyacrylamide SDS-polyacrylamide gel (B )and analysis by Western blotting with the indicated Hox subunit-specific antibodies (C–G ).The first dimension BN-polyacrylamide gel was Coomassie-stained,whereas the sec-ond dimension SDS-polyacrylamide gel was silver-stained.Cyanobacterial Hox Hydrogenase Complex Association and Functionat NATL RENEWABLE ENERGY, on January 16, 2013 Downloaded fromfirming that HoxY and HoxH are not required for the stable association of diaphorase subcomplexes.Pull-down Analysis of Hox Subunit Associations in Hox Hydrogenase Subcomplexes —Additional mutant strains were constructed to ectopically express His 6-tagged Hox subunits to further probe subcomplex associations:1)HoxYH,tagged on HoxY (hox ϪϩHis 6-HoxYH);2)HoxEFUYH,tagged on HoxH(hoxH ϪϩHis 6-HoxH);and 3)HoxEFUYH,tagged on HoxE (hoxE ϪϩHis 6-HoxE).Overexpression of HoxH by ectopic expression (Fig.5,A and B )or in the hoxE Ϫstrain background (Fig.5C )results in clear unprocessed and processed HoxH sig-nal (Fig.5,A–C ,upper and lower bands ,respectively,in HoxH blots and in the HoxH (C-terminal)blot),increasing the likeli-hood that we would see unprocessed HoxH in bead fractions ifFIGURE 3.One-dimensional SDS-PAGE and Western blot analysis of Synechocystis sp.PCC 6803hox mutants.A ,whole cell lysates of WT and individual/combined hox mutants were run on TGX Any kDa gradient SDS-polyacrylamide gels (Bio-Rad),transferred to PVDF,and immunoblotted with Hox subunit-specific antibodies and PsaD and/or Rps1(not shown)as loading controls.B ,relative levels of Hox subunits in each mutant,presented as a percentage of WT.Data represent quantitation of multiple Western blot analyses with error bars depicting variation between separate analyses.Cyanobacterial Hox Hydrogenase Complex Association and Functionat NATL RENEWABLE ENERGY, on January 16, 2013 Downloaded from。
叶绿素荧光成像技术的原理与应用

叶绿素荧光成像技术的原理与应用一、引言叶绿素是植物中最重要的光合色素,是植物进行光合作用的基础。
溶剂化的叶绿素主要吸收蓝色和红色光,在500~600和650~700nm波长范围内,具有两个吸收峰。
叶绿素荧光成像技术是基于叶绿素发出的荧光信号来进行影像测量的一种实时、无创的模拟测量方法。
本文将介绍叶绿素荧光成像技术的原理、实验流程及其应用。
二、原理叶绿素荧光成像技术是基于叶绿素荧光的成像,叶绿素荧光受光强度和环境因素的影响而变化,可以反映植物的生长状态、光合作用效率和叶片生理变化等信息。
叶绿素荧光成像系统具有高时间分辨率、高空间分辨率的特点,可以获取全景、彩色、实时和定量信息。
叶绿素荧光成像技术主要是利用荧光成像仪和其他仪器支持,通过蓝/绿或红/绿激发光、荧光图像采集和分析等步骤,可以获得叶绿素的分布信息。
三、实验叶绿素荧光成像技术的实验主要分为两个步骤:激发和成像。
首先是激发,将叶片放入光合器中,用荧光成像仪对植物叶片进行光激发,根据荧光成像仪的激光幅度,可以调整植物叶片的荧光强度。
之后,进行成像,将植物叶片放到荧光成像仪中进行拍摄,获取叶绿素的发光信号。
最后,通过荧光照片的处理,可以计算叶片荧光强度和叶绿素荧光参数,如最大光化学利用率、植物光合作用效率等。
四、应用叶绿素荧光成像技术的应用非常广泛,主要涉及到生物学、生态学、农业、气象学,特别适用于植物生长状态监测、植物抗性研究、光合作用效率评估等。
一些具体的应用领域可以如下简要介绍:1.光合作用研究叶绿素荧光成像技术可用于研究植物的光合作用效率、光能利用和光保护机制。
典型的光合作用实验是通过比较光照和黑暗条件下植物的荧光变化来确定植物的光合反应和光保护机制。
2.气候变化影响研究在气候变化方面,叶绿素荧光成像技术可用于研究气候变化导致的植物响应和适应。
通过对多个季节的荧光成像分析可以确定气候变化对地上层和植物生长的影响。
3.生态环境研究叶绿素荧光成像技术可用于研究萎缩地区的植被恢复和生态系统的响应。
FluorCam叶绿素荧光成像文献 2009 Feeding enhances photosynthetic efficiency

Feeding enhances photosynthetic efficiency in the carnivorous pitcher plantNepenthes talangensisAndrej Pavlovicˇ*,Lucia Singerova ´,Viktor Demko and Ja ´n Huda ´k Department of Plant Physiology,Faculty of Natural Sciences,Comenius University,Mlynska´dolina B-2,SK-84215,Bratislava,Slovak RepublicReceived:10March 2009Returned for revision:30March 2009Accepted:2April 2009Published electronically:19May 2009†Background and Aims Cost–benefit models predict that carnivory can increase the rate of photosynthesis (A N )by leaves of carnivorous plants as a result of increased nitrogen absorption from prey.However,the cost of car-nivory includes decreased A N and increased respiration rates (R D )of trapping organs.The principal aim of the present study was to assess the costs and benefits of carnivory in the pitcher plant Nepenthes talangensis ,leaves of which are composed of a lamina and a pitcher trap,in response to feeding with beetle larvae.†Methods Pitchers of Nepenthes grown at 200m mol m 22s 21photosynthetically active radiation (PAR)were fed with insect larvae for 2months,and the effects on the photosynthetic processes were then assessed by simul-taneous measurements of gas exchange and chlorophyll fluorescence of laminae and pitchers,which were corre-lated with nitrogen,carbon and total chlorophyll concentrations.†Key Results A N and maximum (F v /F m )and effective quantum yield of photosystem II (F PSII )were greater in the fed than unfed laminae but not in the fed compared with unfed pitchers.Respiration rate was not significantly affected in fed compared with unfed plants.The unfed plants had greater non-photochemical quenching (NPQ)of chlorophyll fluorescence.Higher NPQ in unfed lamina did not compensate for their lower F PSII ,result-ing in lower photochemical quenching (QP)and thus higher excitation pressure on PSII.Biomass and nitrogen and chlorophyll concentration also increased as a result of feeding.The cost of carnivory was shown by lower A N and F PSII in pitchers than in laminae,but R D depended on whether it was expressed on a dry weight or a surface area basis.Correlation between nitrogen and A N in the pitchers was not found.Cost–benefit analysis showed a large beneficial effect on photosynthesis from feeding as light intensity increased from 200to 1000m mol m 22s 21PAR after which it did not increase further.All fed plants began to flower.†Conclusion Feeding pitchers with insect larvae increases A N of leaf laminae,due to higher nutrient acquisition,with strong correlation with nitrogen concentration,but A N of pitchers does not increase,despite increased nitro-gen concentration in their tissue.Increased A N improves growth and reproduction and is likely to increase the competitive advantage of carnivorous over non-carnivorous plants in nutrient-poor habitats.Key words:carnivorous plants,chlorophyll fluorescence,Nepenthes talangensis ,nitrogen,pitcher plant,photosynthetic rate,photosystem II,respiration rate.INTRODUCTIONCarnivorous pitcher plants of the genus Nepenthes are largely found in south-east Asia,principally Borneo,Sumatra,Java and peninsular Malaysia,with scattered populations in India,Sri Lanka,Australia,New Caledonia,Madagascar and the Seychelles.Nepenthes leaves are differentiated into a photo-synthetically active lamina and a pitcher trap,which has evolved to attract,trap and digest prey.The pitchers usually consist of different structural and functional zones:lid,peri-stome,and upper waxy and lower glandular zones within the pitcher (Clarke,1997,2001).Carnivorous plants grow terrestrially in sunny,nutrient-poor and permanently moist habitats.Cost–benefit models of car-nivory predict that in a well-lit environment the nutritional benefits gained from captured prey exceed the costs of modify-ing leaves into photosynthetically inefficient traps (Givnish et al.,1984).Generally,costs of carnivory include energetic demands for growth of traps and their function:either increased rate of dark respiration (R D )as a result of extraenergy requirements for attracting,capturing and digesting the prey,or decreased photosynthetic rate (A N )as a result of leaf adaptation for carnivory,or both.Three potential benefits resulting from increased mineral absorption from prey have been proposed.First,carnivory may increase a plant’s rate of photosynthesis (A N )through improved nutrient supply,particu-larly nitrogen status,although other nutrients (principally phosphate and potassium)may be important.Second,carniv-ory may results in an increased seed production through improved mineral acquisition;and third,carnivory may replace autotrophy partly by heterotrophy (Givnish et al.,1984).Givnish et al.(1984)considered the second benefit as a part of the first,as increased A N should lead to increased seed production.Several authors have dismissed the third benefit,as experimental findings suggest that carnivorous plants do not obtain substantial amounts of carbon from prey and carnivory could not replace autotrophy at low light inten-sity (Chandler and Anderson,1976).However,Rischer et al.(2002)found that Nepenthes incorporated carbon from carniv-ory into organic substances,which raises a question about the importance of facultative heterotrophy.The growth of some*For correspondence.E-mail pavlovic@fns.uniba.sk#The Author 2009.Published by Oxford University Press on behalf of the Annals of Botany Company.All rights reserved.For Permissions,please email:journals.permissions@Annals of Botany 104:307–314,2009doi:10.1093/aob/mcp121,available online atby guest on March 15, 2012/Downloaded fromspecies of carnivorous plants is partly dependent on organiccarbon uptake from prey,as revealed by increased growth without increasing A N (Adamec,1997,2008).With regard to the costs of carnivory,it has been observed that photosynthetic rates of traps are lower than those ofleaves (Knight,1992;Adamec,2006;Pavlovicˇet al.,2007).With regard to the benefits,around 30studies have tested whether the growth of carnivorous plants is enhanced by carnivory.Ellison (2006)concluded that there is a significant positive effect (P ¼0.02)of adding prey on plant growth among different carnivorous genera,supporting the hypothesis that there is a benefit to carnivory.However,he pointed out that this is only indirect evidence,because the cost–benefit model expresses benefits in terms of photosynthetic rates,not in terms of growth.Only three studies have examined the effect of prey capture on A N of terrestrial carnivorous plants directly,and these gave very different results.Convincing evidence that prey availability increased absolute A N in Sarracenia has been provided by Farnsworth andEllison (2008).However,Me´ndez and Karlsson (1999)and Wakefield et al.(2005)did not find any changes in A N in Pinguicula vulgaris and Sarracenia purpurea in response to the capture of prey.Either of two possible results can be expected from feeding prey to carnivorous plants.First,fed plants will have greater biomass but nitrogen (N)concentration (mg N g 21d.wt)will not be affected,despite total N (mg)per plant increasing.This was observed by Moran and Moran (1998)in Nepenthes rafflesiana .In extreme cases,N concentrations per unit dry matter might even decrease due to dilution by increased growth (Karlsson and Carlsson,1984;Adamec,2008).Because N concentration is positively correlated with A N in carnivorous plants (Ellison and Farnsworth,2005;Pavlovicˇet al.,2007),it can be expected that A N will not be enhanced,as found by Me´ndez and Karlsson (1999)in Pinguicula vulgaris .In this case,the cost–benefit model must be considered in terms of growth rate partly due to direct uptake of organic compounds from prey.The second possibility is that fed plants will have higher leaf N concentrations and,therefore,higher A N as predicted by Givnish et al.(1984).This was found by Farnsworth and Ellison (2008)in Sarracenia .The principal aim of the present study was to assess the costs and benefits of carnivory in Nepenthes ,which provides a good experimental model for the study of the cost–benefit model of carnivory because the leaves are divided into photo-synthetically active laminae and a pitcher trap.We assumed that increased photosynthesis is the most important benefit of carnivory,and tested the hypothesis that prey availability would result in increased A N ,photosystem II (PSII)efficiency,biomass,and nutrient and chlorophyll concentrations and that the cost of carnivory would include increased R D and decreased A N and PSII efficiency in the pitcher sensu stricto according to the Givnish hypothesis (Givnish et al.,1984).Tests were made on the pitcher plant Nepenthes talangensis ,a rare,endemic species from Sumatra.This is the first detailed study of photosynthesis in a carnivorous plant,with and without experimental addition of prey,using simultaneous measurements of gas exchange and chlorophyll fluorescence by the saturation pulse method.MATERIALS AND METHODSPlant material and culture conditionsThe pitcher plant Nepenthes talangensis Nerz and Wistuba (1994)grows in mossy forest and stunted upper mountain forest near the summit of Gunung Talang (1800–2500m alt.)in Sumatra (Nerz and Wistuba,1994;Clarke,2001).Its pitchers are light green to yellow in colour with red spots,lack a waxy zone (glandular region covers entire inner surface)and the pitcher fluid is extremely viscous (Clarke,2001).Five-year-old plants,propagated from seeds,were 20–30cm tall,with three or four pitchers up to 5cm long.During the experiments,ten plants were grown under con-trolled conditions in a growth chamber with a photoperiod of 12h dark/12h light [200m mol m 22s 21photosynthetically active radiation (PAR),day/night temperatures of 25/178C and high humidity (80–100%)].They were grown in a Sphagnum /perlite/bark/moss mixture substrate.To prevent entry of prey into pitchers they were plugged,without dama-ging them,with wads of cotton wool moistened in distilled water.Any newly opened pitchers during experiments were treated in the same way.The wads were removed from five plants after 6months.The remaining five plants served as unfed controls.The fed plants were supplied with one live meal worm (Tenebrio molitor )for each pitcher each week for 8weeks (total 2.46+0.05g f.wt worms per plant over 8weeks,N concentration in worms ¼8.7%,78mg N per plant over 8weeks).Fed plants were also able to catch natural prey,mostly sciarid flies,but the contribution of these to the nutrition of fed plants was negligible (,2%of a worm’s weight).Simultaneous measurement of CO 2assimilation and chlorophyll fluorescenceTo assess whether feeding enhanced photosynthetic effi-ciency,we analysed five youngest fully developed laminae (one per plant)with un-formed pitchers that had developed during the 8-week feeding period (‘young lamina without pitcher’),and five older laminae carrying the pitcher (separ-ated into ‘older lamina with pitcher’and ‘pitcher’),which had developed before the feeding experiment had started.Rates of photosynthesis (A N )and chlorophyll fluorescence were measured simultaneously with a CIRAS-2(PP-Systems,Hitchin,UK)and a fluorcam FC 1000-LC (Photon Systems Instruments,Brno,Czech Republic)attached to an infrared gas analyser.Prior to measurements,the plants were dark-adapted overnight to achieve fully relaxed non-photochemical quenching (NPQ).Thereafter,the middle part of the lamina and the lid in the case of the pitcher (2.5cm 2)were enclosed in the leaf cuvette (PLC6,PP-Systems).Once stabilization (15min)was achieved the respiration rate (R D )was recorded.Then the chlorophyll fluorescence was measured.Minimal fluorescence (F 0)and then maximal fluorescence (F m )were measured using a saturation pulse (4000m mol m 22s 21PAR,800-ms duration):maximal quantum yield of PSII (F v /F m )was calculated as F m –F 0/F m .An induction curve of 15min duration was then obtained by switching on an actinic light of 200m mol m 22s 21PAR.For analysis of the quenching mechanism,ten saturation pulses were triggered.Pavlovicˇet al.—Photosynthetic response to feeding in Nepenthes 308 by guest on March 15, 2012/Downloaded fromSimultaneously,stable A N was recorded at a CO 2concentrationof 360m mol mol 21,leaf temperature 23+18C,relative air humidity 65–70%and water vapour deficit 700–1000Pa.Effective quantum yield of photosystem II (F PSII ),photoche-mical quenching (QP)and NPQ were calculated (Maxwell and Johnson,2000).The saturation irradiance(1200m mol m 22s 21PAR)was applied for 15min to allow adaptation,and light response curves were determined.The light intensity was decreased stepwise with irradiation periods of 3min and subsequent saturation pulses were applied until 40m mol m 22s 21PAR was reached.The appar-ent quantum yield of CO 2fixation (F CO2)was determined as the slope of the light response curve between 40and 150m mol m 22s 21PAR (Farquhar et al.,1980).Light response curves of A N ,F PSII and NPQ were recorded simul-taneously.All measurements were taken between 0900and 1200h.Chlorophyll,nitrogen and carbon determinationThe leaves from five fed and unfed plants were removed.Parts of the leaves were dried at 708C for 5days to determine percentage dry weight.Chlorophyll concentrations were deter-mined on the same types of leaves on which A N had been measured.Samples of leaves from young laminae without pitchers,older laminae carrying pitchers and pitchers them-selves were ground in a mortar and pestle with small amount of sand and extracted with 80%(v/v)chilled acetone with MgCO 3to avoid acidification and phaeophytinization of pig-ments.The samples were centrifuged at 8000g for 5min at 48C.Chlorophyll a þb (chl a þb )in supernatant were deter-mined spectrophotometrically (Jenway 6400,London,UK):chl a at 663.2nm,chl b at 646.8nm.Chlorophyll concen-tration (mg L 21)was calculated according to Lichtenthaler (1987)and re-expressed as mg chl a þb g 21d.wt.Leaf tissues from photosynthetic measurements were dried at 708C for 5days and N and C were determined using an EA 1108CHN analyser (Fisons Instruments,Milan,Italy).Nepenthes pitchers were washed using distilled water before drying and analysing to avoid contamination with nitrogen from prey.After N determination,photosynthetic nitrogen use efficiency (PNUE)was calculated for each type of leaf as:PNUE (m mol CO 2mol N 21s 21)¼A Nmax (m mol CO 2g 21d.wt s 21)/N (mol N g 21d.wt).Statistical analysisPrior to statistical tests,data were analysed for normality and homogeneity of variance.When non-homogeneity was present,a t -test was employed with the appropriate corrected degrees of freedom.To evaluate the significance of the data between fed and unfed plants [leaf dry weight,R D ,A Nmax ,sto-matal conductance (g s ),F v /F m ,F PSII ,F CO2,QP,NPQ,C,N,PNUE,chl a þb ,chl a /b ]a t -test was used.Paired data (com-parison between the lamina and the pitcher within the same old leaf carrying the pitcher)were statistically evaluated by a two-tailed paired t -test.The results are expressed as the mean of five replicated measurements.ANCOV A (StatistiXL ver.1.7for Microsoft Excel)was used to test the homogeneity ofslopes of the relationships between A N and N content for lamina and pitcher.RESULTSFeeding the pitchers of Nepenthes with beetle larvae increased the dark and light reactions of photosynthesis.In the laminae,A N increased almost linearly with increasing irradiance at irra-diances less than about 160m mol photon m 22s 21PAR and reached saturation under an irradiance of about 1000m mol photon m 22s 21PAR (Fig.1A,B).The A N of the young fed lamina without pitcher was significantly higher than the unfed control (Table 1).The A Nmax of laminae from unfed plants was about 50%that of fed lamina at saturating irradi-ance (Fig.1A).Consistent with this,effective quantum yield of PSII (F PSII )and apparent quantum yield of CO 2fixation (F CO2)were also higher in young laminae from plants that had been fed (Table 1).F PSII decreased with increasing irradi-ance (Fig.1D).Fed laminae had F v /F m values of about 0.800,significantly greater than those of laminae from unfed plants.The primary electron acceptor from PSII (plastoquinone A,Q A )was more reduced in unfed plants,based on the higher value of QP in fed plants (Table 1).NPQ increased with increasing irradiance:the higher NPQ in laminae from unfed plants suggests greater heat dissipation via the xanthophyll cycle (Fig.1G).Chlorophyll concentrations and chlorophyll a/b ratios were greater in fed plants than in unfed plants (Tables 1and 2),indicating an increased proportion of light-harvesting complexes (LHC II)to reaction centres (RC II)in PSII in unfed plants.This is consistent with higher values of F 0in unfed plants (data not shown).Lamina dry weight,nitro-gen concentration and PNUE were significantly higher in fed plants.Respiration rate was not significantly different,but there was a trend towards slightly greater R D in fed plants in all tissues studied (Table 1).Differences in measured photosynthetic characteristics between fed and unfed plants in the older laminae carrying the pitcher were similar to those of young laminae except their dry weight (Table 2,Fig.1B,E,H).This is not surprising given that the older laminae were fully developed before the feeding experiment started,whereas the young laminae were developing during the feeding experiment.There were no sig-nificant differences in PNUE between the older laminae of fed and unfed plants.In the pitchers,A N was very low and increased linearly with increasing irradiance at irradiances less than about 50m mol photon m 22s 21PAR and reached saturation only at 100m mol photon m 22s 21(Fig.1C).In contrast to laminae,there were no statistical differences between pitchers of fed and unfed plants in A Nmax ,F v /F m ,F PSII ,F CO2,QP,g s or chlor-ophyll concentration (Table 2).However,unfed pitchers had higher NPQ than fed pitchers and lower nitrogen concen-trations,similar to the pattern in young and old laminae.Almost all photosynthetic parameters were significantly lower in pitchers than in laminae (Table 2).The primary acceptor of PSII,Q A ,was maintained at more than 70%oxi-dized in the lamina,but in the pitcher it was only 25–35%oxidized.NPQ was similar in pitchers and laminae,but was strongly dependent on whether the plants were fed or unfed.However,at higher irradiance,laminae had higher NPQPavlovicˇet al.—Photosynthetic response to feeding in Nepenthes 309by guest on March 15, 2012/Downloaded from(Fig.1H).The NPQ was saturated at 300m mol photon m 22s 21PAR in the pitcher (Fig.1I).Stomatal conductance,PNUE,and nitrogen,carbon and chlorophyll concentrations were also significantly lower in the pitcher.The R D per unit surface area was higher in the lamina.By contrast,R D per unit mass was higher in the pitcher (Table 2).Figure 2summarizes the relationship between nitrogen con-centration and A N in lamina and trap separately.It is obvious that there is a strong correlation between nitrogen concen-tration and A N in laminae (P ,0.01)but not in pitchers (P ¼0.06).Furthermore,the relationships do not have similar slopes (P ¼0.013).One year after the feeding experiment all fed plants,but no unfed plants,had begun to flower.DISCUSSIONThe effects of feeding pitchers with beetle larvae on the photo-synthetic activity of the pitcher plant Nepenthes talangensis was investigated,using simultaneous measurement of gas exchange and chlorophyll fluorescence,and relating them to nitrogen and chlorophyll content of the laminae and pitchers.Nepenthes is a good experimental genus for studying the21034500·10·20·30·40·50·60·7–2–101243567PAR (µmol m –2 s –1)N P QφP S I IA N (µm o l C O 2 m –2 s –1)PAR (µmol m –2 s –1)PAR (µmol m –2 s –1)20004006008001000120002004006008001000120020040060080010001200F IG .1.Rate of net photosynthesis (A N ;A–C),effective quantum yield of PSII (F PSII ;D–F)and non-photochemical quenching (NPQ;G–I)in response to irradiance in young lamina without pitcher (A,D,G),older lamina (B,E,H)and pitcher (C,F,I).Fed and unfed plants as indicated,values are means +s.e.PAR,photosynthetically active radiation.T ABLE 1.Leaf biomass,chlorophyll fluorescence,gas exchange,chlorophyll,nitrogen and carbon concentration,and photosynthetic nitrogen use efficiency in young lamina withoutpitcherParameterUnfed Fed Leaf dry weight (mg)104.5+13.7162.0+12.2*R D (m mol CO 2m 22s 21)1.30+0.161.58+0.15ns R D (nmol CO 2g 21d.wt s 21)8.9+2.211.5+2.2ns A Nmax (m mol CO 2m 22s 21)2.8+0.26.0+0.4**A Nmax (nmol CO 2g 21d.wt s 21)16.9+0.6046.1+7.6**g s (mmol m 22s 21)62.1+4.5152.0+8.2**F v /F m 0.758+0.0110.800+0.003*F PSII0.41+0.020.52+0.01**F CO2(mol CO 2mol quanta 21)0.014+0.0010.023+0.002**QP 0.71+0.010.77+0.01**NPQ1.28+0.130.84+0.06*C (mg g 21d.wt)459.8+2.4468.4+3.1*N (mg g 21d.wt)10.6+1.018.6+2.2*PNUE (m mol CO 2mol N 21s 21)23.7+1.632.5+2.4*Chl a þb (mg g 21d.wt)1.21+0.112.72+0.22**Chl a /b1.91+0.32.15+0.03**See Appendix for definitions.Values shown are means +s.e.,n ¼5.Significantly different values (t -test)are indicated:*P ,0.05,**P ,0.01;ns,non-significant differences.Pavlovicˇet al.—Photosynthetic response to feeding in Nepenthes 310by guest on March 15, 2012/Downloaded fromcost–benefit model of carnivory with leaves composed of photosynthetically active laminae and a pitcher trap.The laminae of fed N.talangensis had a greater N concentration as a result of nitrogen absorption from prey (Tables 1and 2).In their natural environment,Nepenthes species are N-limited,and have evolved the pitcher to assist in their uptake of N (Osunkoya et al.,2007).The average N acquired from insects is high:61.5,53.8and 68.1%of the total for N.mirabilis ,N.rafflesiana and N.albomarginata ,respectively (Schulze et al.,1997;Moran et al.,2001).Chlorophyll concen-tration,A N and maximum and effective quantum yield of PSII were higher in fed plants.Two consequences of this are (1)an increase in biomass of new formed laminae and (2)flowering of plants after feeding (Table 1).Because about 50–80%of foliar N is incorporated in photosynthetic proteins (Evans,1989),we suggest that the lower A N of unfed plants is due to lower N and Rubisco concentrations and thus lower capacity for CO 2fixation.The smaller A N was accompanied by a smaller stomatal conductance (g s )in unfed compared with fed plants but intercellular CO 2concentration (C i )was statisti-cally unchanged (data not shown).This indicates that reduced A N was due to reduced carboxylation efficiency rather than to stomatal limitation.Lower F PSII is a secondary consequence of impaired CO 2assimilation.When carbon fixation is inhib-ited,F PSII is often down-regulated to match the reduced requirement for electrons and to minimize the production of reactive oxygen species (Golding and Johnson,2003).Maximum quantum yield of PSII of dark-adapted leaves,which is proportional to the quantum yield of O 2evolution,was slightly lower in unfed plants,reflecting that potentional quantum yields for photochemistry in PSII were also nega-tively affected in prey-deprived plants (Tables 1and 2).When nutrient stress restricts carboxylation,even moderate light may become excessive and may result in destructive photo-oxidative reactions.In the first line of defence against photo-oxidation,xanthophylls transform excessive excitation energy to heat,measured as NPQ of chlorophyll fluorescence (Krause and Jahns,2004).In laminae,NPQ values were higher in unfed plants as a consequence of less light energy being used in photochemistry and through greater heat dissipa-tion by the xanthophyll cycle.This suggests that increased thermal dissipation by the xanthophyll cycle slightly compen-sates for the lower F PSII in unfed lamina,but probably not sufficiently.The decline of F PSII in unfed laminae was not offset by thermal dissipation,leading to a lower QP and higher excitation pressure on PSII and thus higher susceptibility to photoinhibition in unfed plants.The unfed N.talangensis plants exhibited similar symptoms to plants under nitrogen stress.Huang et al.(2004)found lower A N ,g s ,F v /F m ,F PSII ,QP,chl and chl a /b in nitrogen-deprived rice.012345678N concentration (%)A N (µm o l C O 2 m –2 s –1)F IG photosynthetic rate (A N )in relation to leaf nitrogen concentration in lamina and pitcher,as indicated.The lines have different slopes (P ¼0.013);no relationship was found between A N and N in the pitcher (P ¼0.06)but a significant relationship was found in the lamina (P ,0.01).T ABLE 2.Leaf biomass,chlorophyll fluorescence,gas exchange,chlorophyll,nitrogen and carbon concentration,and photosynthetic nitrogen use efficiency in old lamina carrying the pitcherLaminaPitcherParameterUnfed Fed Unfed FedLeaf dry weight (mg)104.7+15.8120.5+19.6ns 141.3+5.2††199.5+47.8ns ††R D (m mol CO 2m 22s 21)0.97+0.021.15+0.06ns 0.43+0.02††0.60+0.1ns ††R D (nmol CO 2g 21d.wt s 21)5.8+0.57.0+0.21ns 6.5+0.4††9.6+1.7ns ††A Nmax (m mol CO 2m 22s 21)3.1+0.36.0+0.5**0.10+0.04††0.15+0.03ns ††A Nmax (nmol CO 2g 21d.wt s 21)19.4+2.037.8+5.4*2.0+0.9††3.5+1.4ns ††g s (mmol m 22s 21)57.0+6.492.7+4.6**37.7+4.4††31.3+1.6ns ††F v /F m 0.770+0.0100.823+0.011*0.715+0.012†0.740+0.008ns ††F PSII0.41+0.020.59+0.02**0.18+0.01††0.16+0.01ns ††F CO2(mol CO 2mol quanta 21)0.011+0.0020.021+0.001**0.001+0.000††0.001+0.000ns ††QP 0.73+0.020.82+0.01**0.34+0.04††0.25+0.03ns ††NPQ1.64+0.140.79+0.03**1.66+0.14ns 0.68+0.14**ns C (mg g 21d.wt)464.2+1.9477.5+5.8*457.1+0.9††462.2+1.2*††N (mg g 21d.wt)11.3+0.420.0+2.8*7.8+0.2††17.0+1.5**†PNUE (m mol CO 2mol N 21s 21)20.7+1.524.8+4.1ns 4.4+1.2††2.7+0.8ns ††Chl a þb (mg g 21d.wt)1.30+0.012.51+0.34**0.93+0.09††1.02+0.05ns ††Chl a /b1.94+0.022.15+0.06**††0.96+0.041.45+0.07**††See Appendix for definitions.Values shown are means +s.e.,n ¼parisons were made (t -test)between fed and unfed lamina or pitcher at *P ,0.05,**P ,0.01,and between fed pitcher and fed lamina or unfed pitcher and unfed lamina respectively at †P ,0.05,††P ,0.01(paired t-test);ns,non-significant differences.Pavlovic ˇet al.—Photosynthetic response to feeding in Nepenthes 311by guest on March 15, 2012/Downloaded fromAll photosynthetic parameters were significantly lower in pitchers than in laminae (Table 2).Nepenthes pitchers have digestive functions and the absence of a positive correlation between N and A N (Table 2,Figs 1and 2)suggests thatfactors other than N limit A N .Pavlovicˇet al.(2007)suggest high diffusional resistance for CO 2uptake in the Nepenthes pitcher due to very low stomatal density and compact meso-phyll.Low PNUE in the pitchers found in this and in our pre-vious study (Pavlovicˇet al.,2007)indicates either high resistance for CO 2uptake or increased allocation of N to struc-tural materials rather than to photosynthetic machinery (Osunkoya et al.,2007,2008).Lower QP (Table 2)and satur-ation of NPQ at relatively low irradiance in the pitchers (Fig 1I)result in increase excitation pressure on PSII and higher susceptibility to photoinhibition.This may explain the reduced longevity of pitchers relative to laminae,which is well documented (Osunkoya et al.,2008).All the above demonstrate a strong adaptation of pitchers to the carnivorous,but not to the assimilation,function.The only study to date that has quantified the effects of nutrient stress in Nepenthes is that of Moran and Moran (1998),who examined foliar reflectance in nutrient-starved N.rafflesiana .They observed no significant differences in root or leaf N concentration,which is inconsistent with the present results.However,N content (concentration Âbiomass)was lower in their prey-deprived plants.They suggested that increased growth upon feeding is a primary adaptation because under conditions of resource limitation,plants are able to maintain critical foliar nutrient concentrations by a reduction in growth rate.Increased A N after feeding was found by Farnsworth and Ellison (2008)in the genus Sarracenia.The well-fed plants had slightly higher foliar N concentration,chlorophyll content and F v /F m .However,these differences were only found in young unfed Sarracenia leaves that were produced subsequent to feeding.Wakefield et al.(2005)found no changes of A N measured on fed leaves of Sarracenia purpurea .This agrees with the findings of Butler and Ellison (2007),who demonstrated that nutrients captured by older pitchers are rapidly translocated to newly formed leaves.In contrast,we found enhanced A N in older lamina carrying the fed pitcher,although the pitcher itself did not increase in photosynthetic efficiency (Fig.2C,F).The results of Schulze et al.(1997)show that not only young developing leaves carrying closed pitchers obtain a high portion of N from captured prey,but also that older fully developed leaves carrying open pitchers also obtain more than 50%of their nitrogen from prey in Nepenthes .Ellison and Gotelli (2002)showed an increase in A N following addition of inorganic nitrogen to Sarracenia purpurea ,but this response resulted from plants producing non-carnivorous phyllodes,which are more efficient in photosynthesis than the carnivorous pitcher.S.purpurea produces trapless phyllodes only during drought,under shade or with increased nutrient availability.In contrast to Nepenthes ,Sarracenia does not have leaves that are differentiated into a photosynthetically active lamina and a pitcher trap,but usually have only a rosette of pitchers that must function in both photosynthesis and prey capture to achieve positive carbon gain,and their photosynthetic efficiency is closer to Nepenthes lamina than to the Nepenthes pitcher(Pavlovicˇet al.,2007).The rate of photosynthesis was not increased as a result ofprey capture in the carnivorous butterwort Pinguicula vulgaris (Me´ndez and Karlsson,1999).However,supplementary feeding in situ increased both rosette size and reproduction,through an increase in flowering frequency and seed pro-duction (Thore´n and Karlsson,1998).Me ´ndez and Karlsson (1999)also concluded that the benefits from capturing prey are larger in reproductive terms than in terms of photosyn-thesis.We also found accelerated flowering in fed Nepenthes plants,but propose that this is an indirect effect of increased A N rather than a direct effect of feeding.Adamec (2008)observed two different responses to feeding in the aquatic carnivorous plants Utricularia australis and Aldrovanda vesi-culosa .Both species,when fed,produced longer shoots and had smaller N concentrations in comparison with control plants.Photosynthetic rate was higher in fed Aldrovanda but lower in fed Utricularia .It was suggested that tissue N in fed plants was diluted by growth processes much more than in unfed controls,so the main physiological effect of catching prey was not based on enhancement of A N ,as was suggested by Givnish et al.(1984),but on providing N and P (and prob-ably C)for essential growth processes.The present study results contrasted with this,as there was a positive correlation between N and A N in lamina (Fig.2),in agreement with the study of Ellison and Farnsworth (2005),but not of Wakefield et al.(2005).The contradictory results concerning feeding experiments discussed above might lie in genotypic differ-ences among plant species.The Givnish model considers not only the ability of carniv-ory to enhance A N ,but also the costs associated with carniv-ory.The costs include a reduced A N and higher R D .The first was confirmed in this and in our previous study of N.alataand N.mirabilis (Pavlovicˇet al.,2007),but the second is prob-ably species-specific.Different results were obtained here depending on the units of measurements.Area-based R D was higher in the lamina,and mass-based R D was higher in the pitcher.This discrepancy is due to different leaf mass area (LMA was higher in lamina)of these two distinct organs.Differences in leaf thickness between lamina and pitcher are well documented in six Nepenthes species (Osunkoya et al.,2007).It appears that the result is influenced more by leaf structure than by specialization for carnivorous or photosyn-thetic function.Reduced A N and higher R D was found in Utricularia bladder.Photosynthetic rate in leaves of six aquatic Utricularia species exceed that in bladders seven-to ten-fold and R D of bladders was 75–200%greater than in leaves (Adamec,2006).The high R D of bladders in Utricularia is consistent with specific amino acid changes (Leu113,Ser114replaced by Cys113,Cys114)in Utricularia cytochrome c-oxidase,the rate-limiting enzyme in the respirat-ory cycle,which accelerates the rate of respiration.These amino acid changes were not confirmed for Nepenthes (Jobson et al.,2004).According to Givnish,there is a trade-off between photosyn-thetic costs and benefits that could lead to the evolution of car-nivory.Enhancement of A N resulting from the addition of nutrients as a result of carnivory should be more rapid in high-light than in shady environments (Givnish et al.,1984;Ellison and Gotelli,2001).However,convincing evidence for this is lacking.From the present data we can calculate the benefit ofPavlovicˇet al.—Photosynthetic response to feeding in Nepenthes 312 by guest on March 15, 2012/Downloaded from。
FlourCam荧光成像系统

仪器使用
• 连接线路 • 连接电脑
1。Usb 2.0 2。部分电脑可能需要专门的usb驱动(可下 载) • 软件安装 可解压直接执行,也可安装使用。
PSI公司软件与相关资料下载地址http://www.psi.cz/ftp/
科研应用
1.光系统II反应中心光化学效率的表征
光化学效率( FV’/Fm’)的变化,反映PSII
反应中心色素
光反应过程
特定波长光能
原初电 接收的光能
子受体
P·A→ P*·A → P+·A-
后 续
原初电子分离
反 应
PSII(700nm)&PSI(680nm)
基态捕光色素
激发态
热能
产生荧光
叶绿素的激发与退激
叶绿素荧光现象
光合作用示意图
蓝光
热
光合
热
红光
荧光
NADP
NADPH
光系统Ⅰ(PSI)能被波长700nm的 光激发,又称P700 光系统Ⅱ(PSⅡ)吸收高峰波长为680nm,又称P680
250 FM
200
150 FV
100
50 F0
0
FM’ FS
-10 0 10 20 30 40 50 60 70 80
TIME, seconds
运用叶绿素荧光技术来表征光 能的利用、传递、耗散,
能够很好地研究植物的光合作 用过程.
Thanks for your interesting and
questions!
光化学淬灭(qp):反映PSII天线色素分子 吸收光能后,用于光化学电子传递的份 额, 因此也反映了色素天线吸收的光能用 于光合电子传递的变化;同时,qp 也反映 PSII初级电子受体(QA)氧化还原状态的变化。 要保持高的光化学淬灭,就要使PSII反应中 心处于开放状态
叶绿素荧光成像技术在植物生长中的应用

叶绿素荧光成像技术在植物生长中的应用叶绿素荧光成像技术,是一种非侵入式的植物生长观测方法。
它可以在不对植物造成任何伤害的情况下,实时地观测植物的光合作用和植物生长状态。
叶绿素荧光成像技术的应用范围十分广泛,包括植物生长研究、环境监测、农业生产等方面。
叶绿素荧光成像技术的基本原理是,利用叶绿素分子在光合作用中产生的荧光信号,来反映叶片的光合效率。
这种荧光信号可以通过特殊的摄像设备,即叶绿素荧光成像仪来采集。
通过对采集到的荧光图像进行处理,可以得到植物的光合作用效率、光能利用率等多项指标,从而揭示植物生长状态和环境条件对植物生长的影响。
在植物生长方面,叶绿素荧光成像技术的应用主要集中在三个方面:一、对不同生长环境下的植物进行光合作用效率观测。
利用叶绿素荧光成像仪可以在植物生长中实时地观测其光合作用的运作情况。
通过在不同环境和条件下对植物进行观测,可以更加准确地了解植物生长的条件和需求,为生产和研究提供参考。
二、对不同植物的生长状态进行监测。
叶绿素荧光成像技术还可以用于对不同植物的生长状态进行监测,从而判断不同的生长阶段、生长速度等。
这对于农业生产和植物育种方面都具有很大的意义,可以指导地面管理、育种选材等方面的工作。
三、对不同生物模型进行生长动态分析。
除了对植物进行观测之外,叶绿素荧光成像技术还可以用于对其他生物模型的生长状态进行监测。
例如,可以将该技术应用于对微生物、食品发酵过程等生物模型进行生长动态分析,从而更好地了解生物系统的生成规律和规律变化,为相关研究提供参考。
总之,叶绿素荧光成像技术的应用具有非常广泛、多样化的特点。
通过该技术可以实时地观测不同生境下植物的生长状态,从而更好地了解植物的光合作用效率、生长阶段等内容。
这对于农业生产、生物育种和环境监测都具有很大的实用价值。
因此,该技术的发展和应用前景十分广阔。
FluorCam叶绿素荧光成像一

FluorCam
荧 光 成 像 : 荧 光 淬 灭 分 析
JIP-‐test(电子传递抑制剂敌草隆对OJIP的影响
叶绿素荧光技术著名厂商
• PSI:捷克Brno(孟德尔在此实验并发现著名的孟德 尔遗传定律),Ladislav Nedbal为首席科学家和主要 股东(另一股东为David Kramer,美国密执根州立 大学教授),1997年为美国华盛顿大学H. Pakrasi教 授研制成了第一台FluorCam荧光成像系统。主要产 品有
Kautsky effect
(资料源自Ecolab实验室荧光成像数据库)
荧光淬灭分析(Quenching Analysis)
1. Fv/Fm, 最大光量子产量 2. Fq’/Fm’,Genty参数、ϕPSII,又称光量子效率,用于光化学过程分析评估, 表示PSII吸收的光辐射用于光化学过程的比率,不需要暗适应,但受自然 光照影响大 3. Fv’/Fm’,开放PSII反应中心的光量子效率,不需暗适应 4. Fq’/Fv’,光化学淬灭qP,大致相当于初级受体QA的再氧化状态 5. (Fm-‐Fm’)/Fm’,非光化荧光淬灭
显微叶绿素荧光成像系统
• 可对植物组织、藻类等细胞或亚亚细 胞结构进行荧光成像测量 • 便携式标准版显微荧光成像系统, Olympus CX31显微镜 • 便携式增强版显微荧光成像系统, Olympus BX40 显微镜及可扩展配件 (通过扩展可测量GFP等) • 多功能显微荧光成像系统,除具备 Olympus BX40 显微镜及可扩展配件外, 还具备6位滤波轮(有机械调节和电 子调节两种模式供选配),因而除可 以成像测量叶绿素荧光外,还可测量 GFP、CY3、CY5等多种稳态荧光或生 物荧光
FluorCam荧光成像系统Protocols(实验程序)
- 1、下载文档前请自行甄别文档内容的完整性,平台不提供额外的编辑、内容补充、找答案等附加服务。
- 2、"仅部分预览"的文档,不可在线预览部分如存在完整性等问题,可反馈申请退款(可完整预览的文档不适用该条件!)。
- 3、如文档侵犯您的权益,请联系客服反馈,我们会尽快为您处理(人工客服工作时间:9:00-18:30)。
• 可进行P、非 光化学荧光淬灭等可以以光谱分辨率测量分析,可以通过选调不同波 长的光源激发天线色素的不同部位。
0.4X0.4mm 曝光时间可达10μs,可选20 μs、33 μs,以及更长 ——适用于快速过程记录 时间分辨率概念:单张曝光时间(远高于50幅每秒)与连 续测量记录(动力学过程连续记录50幅每秒)
高性能CCD
高分辨率镜头
• 可选模式: - 2x2 - 696 x 520 像素, 25幅每秒 - 3x3 - 464 x 344 像素, 20幅每秒 - 4x4 - 348 x 256 像素, 50幅每秒
Micro-FluorCam FC2000-EFW: 6-位滤波器 (插入式)
光谱分辨的荧光成像!
——FKM多功能荧光动态显微观测系统
功能特点:
• PAM脉冲调制模式的叶 绿素荧光动力学测量及 其成像。
• 通过选择不同激发光波 段,对捕光天线的各部 分(如各种不同的藻胆 蛋白vs叶绿素蛋白复合 物)进行选择性激发。 捕光天线的不同部分可 在同一次测量中通过不 同激发波段的自动切换 进行激发和测量。
• 3. Micro-FluorCam FC 2000-MFW 内含: 6位滤波轮; CCD相机;带可更换可扩展组件的机械强化显微镜架 (Olympus BX40);机械强化光学组件;控制单元;PC高性能PC;激发光源;软件包; 使用手册.
• 4. Micro-FluorCam FC 2000-EFW 内含:6位完全软件控制的滤波轮; CCD相机;带可更换可扩展组件的 机械强化显微镜架(Olympus BX40); 机械强化光学组件;控制单元; 高性能PC;激发光源;软件包;使用手册.
显微叶绿素荧光成像
从结构到功能与封闭式荧光成像系统类似,区别仅在于增加了一台显 微镜:
• 1. Micro-FluorCam FC 2000-ST 内含: CCD 相机; 简单显微镜架;光学组件;控制单元;高性能PC;激发光源;软件 包;使用手册.
• 2. Micro-FluorCam FC 2000-EN 内含: CCD 相机;带可更换可扩展组件的机械强化显微镜架(Olympus BX40); 机械强化光学组件;控制单元;高性能PC;激发光源;软件包;使用手册.
Fluorcams荧光成像技术
(一)适用性 (二)测量技术 (三)硬件配置 (四)功能特点 (五)Fluorcam软件功能(下午演示) (六)Fluorcams系列产品 (七)Fluorcams在各领域的应用
(一)Fluorcam的适用性
适用于各种复杂情况 • 测量面积(显微视野到样带成像) • 适用范围(叶绿体——群落) • 从二维成像到三维成像 • 样品大量筛选(条码识别) • 可用于荧光蛋白与荧光素成像 • 弥补普通荧光成像对荧光瞬变过程在时间分辨上
基本参数 • Fo、Fm、Fv/Fm • Fo’、Fm、Fm’、Fs、QY(II)、ETR、Rfd、qP、
NPQ(qN) 基本测量过程 • Kautsky诱导过程 • 荧光淬灭过程 (整个过程都以图像记录,而非只有几个特定时间
点的荧光参数图像)
强化功能与配置选择
PAR致于吸荧非收光正模值常块错状—误态—,,测进公量而式真导推实致导F的E0T’,FR0P’、和AR经Rf吸d验、收吸q系P光、数系N(数P植Q可(物能q经完N历全)胁不等迫适重处用要理,参后会数处导计 算错误)
叶绿素荧光成像+ 荧光标记发光成像
现在多为GFP成像或叶绿素荧光成像,无功能重叠仪器
配置&功能
标准配置:
• 高分辨率CCD镜头 • 光源:4组 LED 发光板:
4 X 470 nm
2 X 447 nm + 2 X 470 nm
2 X 627 nm + 2 X 470 nm • 8位滤波轮 • 条形码识别
统计学分析、多样品比较、区域性分析) • 高级功能(Protocol编辑、checkpoint编辑) • 易于操作(软件设置人性化)
(六)Fluorcams系列产品
封闭式荧光成像
不同使用环境要求
开放式
便携式
移动式
光合联用
不同使用环境要求
3D成像
大通量成像 样带成像
转基因工程?
转基因定位与表达情况 GFP、YFP、BFP、荧光素酶s
FluorCam叶绿素荧光成像技术
北京易科泰生态技术有限公司* info@
叶绿素荧光成像
• 直观、无损、非接触 • 测量区域即足够小又足够大 • 代表性强,荧光仪测量存在取样盲目的问
题。(光纤、微光纤荧光仪)测量点越 小,则盲目性越大。 • 拟南芥等小植物及不规则区域测荧光用成 像更方便
• BFP 主激发峰 384nm,发射峰近448nm. 滤波器建议设置: 激发光400nm短通,469/35nm检测.
(五)Fluorcam软件功能(下午演示)
软件优越性 • 更理想的数据图像(时间分辨率&清晰度) • 测量对象选取(自动&手动,ROI&MASK) • 可选实验过程(Protocol丰富性) • 结果处理的便捷性(视频、图、表、曲线、
功能:
• 叶绿素荧光淬灭 • 荧光诱导过程 • GFP表达成像 • 条形码识别标记
可选配置与功能
额外的紫外光源
• 用于:1.多色荧光,UV可以激发蓝F440、绿F520、红 F680、远红F740;2.作为wtGFP,DAPI的激发光源
额外的青/蓝/绿/黄光源
• 安装在系统上部的额外LED发光板,低于相机,相机物镜 从LED板中间穿过。该光源提供了特殊研究中使用多色激 发光的可能。可用光色:紫外,蓝,青,绿,黄,橙,或 远红。
STF光强度
120,000 µmol(photons)/m².s ,100µs 脉冲(QA 再氧化版)
辅助光源
远红光源
• 用于:1.激发PSI,测量真实F0’;2.测量叶片的真实吸光系数(ETR)
额外的紫外光源
• 用于:1.多色荧光,UV可以激发蓝F440、绿F520、红F680、远红 F740;2.作为wtGFP,DAPI的激发光源
OJIP模块——进行OJIP快速荧光动力学分析(对环境胁迫非常敏感,精 细反映电子激发与传递过程,PI等参数直接反映植物活性)
QA再氧化模块——QA再氧化动力学测定的高级配置,以pump-andprobe 方式工作, 例如以可变的时间延迟测定闪光后的荧光发射情 况,并重复进行。(反映QA-向QB的电子传递过程及其变化:快相、 中相和慢相组分分析,其中慢性组分与反应中心的失活情况密切相关)
高品质LED光源
光源排列与组合
高性能CCD
高速成像镜头: • A/D:12 bit (4096 灰度) • 分辨率:512 x 512像素 • 像素大小:8.2 µm x 8.4 µm • 拍照速度:每秒50幅 • 成像面积:3X3cm;13X13cm;20X20 cm • 单像素代表面积:60X60um;0.25X0.25mm;
额外的青/蓝/绿/黄光源
• 安装在系统上部的额外LED发光板,低于相机,相机物镜从LED板中 间穿过。该光源提供了特殊研究中使用多色激发光的可能。可用光色: 紫外,蓝,青,绿,黄,橙。
• 青色光源:1.用于气孔功能研究, 2. 作为EGFP的激发光源
• 绿色光源:用于YFP的激发光源 (紫外激发的荧光亮度高但持续时间短, 可见光激发的荧光亮度低但持续时间长)
多色荧光测定配置(转基因等,荧光蛋白与荧光素酶):特殊光 源+8位滤波轮(请根据实验设计事先咨询)。
不同荧光蛋白的测量:
• wtGFP 主激发峰 395-397nm,发射峰504 nm. 滤波器建议设置: 激发光420nm短通,532/28 or 530/25 nm检测.
• EGFP 主激发峰 中心波长488nm,发射峰507-509nm. 滤波器建议设置:激发光480nm短通,532/28 or 530/25nm 检测.
光谱分辨的荧光成像
• 整个kautsky诱导过程,包括光化学荧光淬灭和非光化学荧光淬灭过 程都可以进行光谱分辨分析。这种方式可以确定光系统中的哪一个 色素蛋白复合物对光化学淬灭或非光化学淬灭贡献最多,可以用于 光合作用过程中光合机构变化的分析。
• 其它非叶绿素荧光动力学过程分析,可原位监测其它生理学过程, 并与同一细胞的光合作用过程和表现进行比较。与常规显微叶绿素 荧光成像相比,超高灵敏度相机与调制光测量过程使得成像可在不 干扰细胞正常生理代谢的极弱光情况下进行。
多光谱植物荧光成像系统
多光谱植物荧光成像系统可以为一系列应用到绿色荧光 蛋白的分子和细胞生物学研究提供服务。在封闭式荧光成像 系统上安装了完全由软件控制和电动驱动的滤波轮,以及一 系列的滤光片组,可以来对GFP,EGFP、wtGFP、YFP、 BFP或者其它波段荧光蛋白和荧光素进行检测和成像。
仪器的硬件配置使得荧光蛋白与荧光素和叶绿素荧光的 检测和成像间的功能变换成为可能并易于操作。
• 单细胞光谱解析荧光动力学,在细胞水平上解析空间异质性和和荧光 光谱异质性。
• 青色光源:1.用于气孔功能研究, 2. 作为EGFP的激发光源
• 绿色光源:用于YFP的激发光源
叶绿素荧光成像部分可选配置
• PAR吸收模块 • QA再氧化过程分析 • 高达1µs时间分辨率的快速荧光诱导(OJIP)分
析
注:多光谱植物荧光成像系统配置选择较复杂,如 果不是标准配置,请提前咨询。
蓝(能量高&气孔)或白光(贴近自然光照)
光化光强度
标准配置:2,500 µmol(photons)/m².s
升级配置:5,000 µmol(photons)/m².s (光胁迫)