CORRELATION DEPENDENCES DETERMINED BY SIMULTANEOUS MULTISPACECRAFT OBSERVATIONS OF SOLAR WI
descriptive statistics and correlation analysis
descriptive statistics and correlation analysisDescriptive statistics and correlation analysis are two important statistical techniques used to analyze and summarize data. Descriptive statistics involves the use of numerical measures to describe and summarize the main features of a dataset, such as central tendency (mean, median, mode) and variability (standard deviation, range). On the other hand, correlation analysis is used to examine the strength and direction of the relationship between two or more variables. Descriptive statistics is the first step in analyzing data as it provides a clear understanding of the dataset's characteristics. It allows researchers to identify patterns, trends, and outliers within the data. For example, by calculating the mean and standard deviation of a dataset, we can determine the average value and the spread of the data points.Correlation analysis, on the other hand, focuses on examining the relationship between variables. It measures the degree to which changes in one variable are associated with changes in another variable. Correlation coefficients range from -1 to +1, where a positive correlation indicates a direct relationship, a negative correlation indicates an inverserelationship, and a correlation close to zero indicates no relationship.By conducting correlation analysis, researchers can determine if there is a significant relationship between variables. This information is crucial in many fields, such as finance, social sciences, and healthcare. For example, in finance, correlation analysis is used to assess the relationship between different stocks or assets to build diversified portfolios.In addition to measuring the correlation between two variables, correlation analysis can also be extended to examine multiple variables simultaneously through techniques like multiple regression analysis. This allows researchers to identify the independent and dependent variables and predict the outcome based on the relationship between them.Overall, descriptive statistics and correlation analysis are valuable tools in statistical analysis. They provide researchers with a deeper understanding of the data and help draw meaningful conclusions. By utilizing these techniques, researchers can make informed decisions, detect patterns, and identify relationships between variables.。
基于GC-IMS分析采肉次数对鱼糜风味特征的影响

张思瑾,熊雨欣,尤娟,等. 基于GC-IMS 分析采肉次数对鱼糜风味特征的影响[J]. 食品工业科技,2024,45(8):47−56. doi:10.13386/j.issn1002-0306.2023030204ZHANG Sijin, XIONG Yuxin, YOU Juan, et al. Analysis on the Influence of Meat Mincing Times on the Flavor Characteristics of Surimi Based on GC-IMS[J]. Science and Technology of Food Industry, 2024, 45(8): 47−56. (in Chinese with English abstract). doi:10.13386/j.issn1002-0306.2023030204· 研究与探讨 ·基于GC-IMS 分析采肉次数对鱼糜风味特征的影响张思瑾1,熊雨欣1,尤 娟1,2,刘 茹1,2,安玥琦1,2,尹 涛1,2, *,马华威3(1.华中农业大学食品科技学院,湖北武汉 430070;2.国家大宗淡水鱼加工技术研发分中心,湖北武汉 430070;3.广西壮族自治区水产科学研究院,广西南宁 530021)摘 要:为阐明采肉次数对鱼糜风味特征的影响,本研究采用GC-IMS 测定不同采肉次数下(1、2、3、4和5)制备的白鲢鱼糜的挥发性物质,同时测定TBARS 值,并对它们进行相关性分析。
结果显示:5组鱼糜中检测出的挥发性物质均为58种,其中壬醛、乙酸乙酯、2-丙酮、乙醇、2-甲基丁醛的含量相对较高;醛(39.13%~40.91%)、酮(15.52%~21.74%)、醇(19.28%~26.59%)是主要的挥发性物质种类。
随着采肉次数的增加,醛类占比先下降后升高,酮类占比逐渐上升,醇类占比波动变化。
数据分析英语试题及答案
数据分析英语试题及答案一、选择题(每题2分,共10分)1. Which of the following is not a common data type in data analysis?A. NumericalB. CategoricalC. TextualD. Binary2. What is the process of transforming raw data into an understandable format called?A. Data cleaningB. Data transformationC. Data miningD. Data visualization3. In data analysis, what does the term "variance" refer to?A. The average of the data pointsB. The spread of the data points around the meanC. The sum of the data pointsD. The highest value in the data set4. Which statistical measure is used to determine the central tendency of a data set?A. ModeB. MedianC. MeanD. All of the above5. What is the purpose of using a correlation coefficient in data analysis?A. To measure the strength and direction of a linear relationship between two variablesB. To calculate the mean of the data pointsC. To identify outliers in the data setD. To predict future data points二、填空题(每题2分,共10分)6. The process of identifying and correcting (or removing) errors and inconsistencies in data is known as ________.7. A type of data that can be ordered or ranked is called________ data.8. The ________ is a statistical measure that shows the average of a data set.9. A ________ is a graphical representation of data that uses bars to show comparisons among categories.10. When two variables move in opposite directions, the correlation between them is ________.三、简答题(每题5分,共20分)11. Explain the difference between descriptive andinferential statistics.12. What is the significance of a p-value in hypothesis testing?13. Describe the concept of data normalization and its importance in data analysis.14. How can data visualization help in understanding complex data sets?四、计算题(每题10分,共20分)15. Given a data set with the following values: 10, 12, 15, 18, 20, calculate the mean and standard deviation.16. If a data analyst wants to compare the performance of two different marketing campaigns, what type of statistical test might they use and why?五、案例分析题(每题15分,共30分)17. A company wants to analyze the sales data of its products over the last year. What steps should the data analyst take to prepare the data for analysis?18. Discuss the ethical considerations a data analyst should keep in mind when handling sensitive customer data.答案:一、选择题1. D2. B3. B4. D5. A二、填空题6. Data cleaning7. Ordinal8. Mean9. Bar chart10. Negative三、简答题11. Descriptive statistics summarize and describe thefeatures of a data set, while inferential statistics make predictions or inferences about a population based on a sample.12. A p-value indicates the probability of observing the data, or something more extreme, if the null hypothesis is true. A small p-value suggests that the observed data is unlikely under the null hypothesis, leading to its rejection.13. Data normalization is the process of scaling data to a common scale. It is important because it allows formeaningful comparisons between variables and can improve the performance of certain algorithms.14. Data visualization can help in understanding complex data sets by providing a visual representation of the data, making it easier to identify patterns, trends, and outliers.四、计算题15. Mean = (10 + 12 + 15 + 18 + 20) / 5 = 14, Standard Deviation = √[(Σ(xi - mean)^2) / N] = √[(10 + 4 + 1 + 16 + 36) / 5] = √52 / 5 ≈ 3.816. A t-test or ANOVA might be used to compare the means ofthe two campaigns, as these tests can determine if there is a statistically significant difference between the groups.五、案例分析题17. The data analyst should first clean the data by removing any errors or inconsistencies. Then, they should transformthe data into a suitable format for analysis, such ascreating a time series for monthly sales. They might also normalize the data if necessary and perform exploratory data analysis to identify any patterns or trends.18. A data analyst should ensure the confidentiality andprivacy of customer data, comply with relevant data protection laws, and obtain consent where required. They should also be transparent about how the data will be used and take steps to prevent any potential misuse of the data.。
decay of correlation 数学名词

decay of correlation 数学名词Decay of correlation(相关性的衰减)refers to the decrease in correlation between two variables as the distance between them increases. It is a mathematical concept used to quantify the relationship between two variables across different spatial or temporal distances.1. The decay of correlation between rainfall and crop yield was observed as the distance between the two fields increased.雨量与农作物产量之间的相关性随着两个田地之间的距离增加而减弱。
2. The study analyzed the decay of correlation between interest rates and stock market performance over a one-year timespan.该研究分析了利率和股市表现之间的相关性在一年的时间内是如何衰减的。
3. As the distance between two cities increased, thedecay of correlation between their population sizes became more noticeable.随着两个城市之间的距离增加,它们的人口规模之间的相关性衰减变得更加明显。
4. The researchers used statistical methods to determine the decay of correlation between air pollution andrespiratory diseases in different neighborhoods.研究人员使用统计方法来确定不同社区之间空气污染和呼吸道疾病之间的相关性衰减。
股东治理,债权人治理与风险
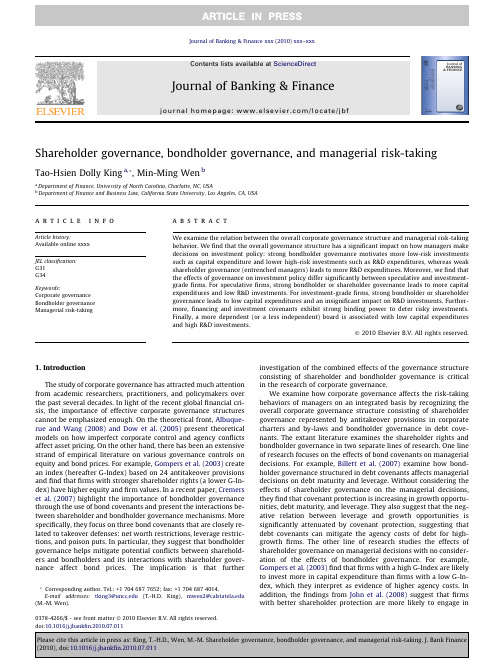
Shareholder governance,bondholder governance,and managerial risk-takingTao-Hsien Dolly King a ,*,Min-Ming Wen ba Department of Finance,University of North Carolina,Charlotte,NC,USAbDepartment of Finance and Business Law,California State University,Los Angeles,CA,USAa r t i c l e i n f o Article history:Available online xxxx JEL classification:G31G34Keywords:Corporate governance Bondholder governance Managerial risk-takinga b s t r a c tWe examine the relation between the overall corporate governance structure and managerial risk-taking behavior.We find that the overall governance structure has a significant impact on how managers make decisions on investment policy:strong bondholder governance motivates more low-risk investments such as capital expenditure and lower high-risk investments such as R&D expenditures,whereas weak shareholder governance (entrenched managers)leads to more R&D expenditures.Moreover,we find that the effects of governance on investment policy differ significantly between speculative and investment-grade firms.For speculative firms,strong bondholder or shareholder governance leads to more capital expenditures and low R&D investments.For investment-grade firms,strong bondholder or shareholder governance leads to low capital expenditures and an insignificant impact on R&D investments.Further-more,financing and investment covenants exhibit strong binding power to deter risky investments.Finally,a more dependent (or a less independent)board is associated with low capital expenditures and high R&D investments.Ó2010Elsevier B.V.All rights reserved.1.IntroductionThe study of corporate governance has attracted much attention from academic researchers,practitioners,and policymakers over the past several decades.In light of the recent global financial cri-sis,the importance of effective corporate governance structures cannot be emphasized enough.On the theoretical front,Albuque-rue and Wang (2008)and Dow et al.(2005)present theoretical models on how imperfect corporate control and agency conflicts affect asset pricing.On the other hand,there has been an extensive strand of empirical literature on various governance controls on equity and bond prices.For example,Gompers et al.(2003)create an index (hereafter G-Index)based on 24antitakeover provisions and find that firms with stronger shareholder rights (a lower G-In-dex)have higher equity and firm values.In a recent paper,Cremers et al.(2007)highlight the importance of bondholder governance through the use of bond covenants and present the interactions be-tween shareholder and bondholder governance mechanisms.More specifically,they focus on three bond covenants that are closely re-lated to takeover defenses:net worth restrictions,leverage restric-tions,and poison puts.In particular,they suggest that bondholder governance helps mitigate potential conflicts between sharehold-ers and bondholders and its interactions with shareholder gover-nance affect bond prices.The implication is that furtherinvestigation of the combined effects of the governance structure consisting of shareholder and bondholder governance is critical in the research of corporate governance.We examine how corporate governance affects the risk-taking behaviors of managers on an integrated basis by recognizing the overall corporate governance structure consisting of shareholder governance represented by antitakeover provisions in corporate charters and by-laws and bondholder governance in debt cove-nants.The extant literature examines the shareholder rights and bondholder governance in two separate lines of research.One line of research focuses on the effects of bond covenants on managerial decisions.For example,Billett et al.(2007)examine how bond-holder governance structured in debt covenants affects managerial decisions on debt maturity and leverage.Without considering the effects of shareholder governance on the managerial decisions,they find that covenant protection is increasing in growth opportu-nities,debt maturity,and leverage.They also suggest that the neg-ative relation between leverage and growth opportunities is significantly attenuated by covenant protection,suggesting that debt covenants can mitigate the agency costs of debt for high-growth firms.The other line of research studies the effects of shareholder governance on managerial decisions with no consider-ation of the effects of bondholder governance.For example,Gompers et al.(2003)find that firms with a high G-Index are likely to invest more in capital expenditure than firms with a low G-In-dex,which they interpret as evidence of higher agency costs.In addition,the findings from John et al.(2008)suggest that firms with better shareholder protection are more likely to engage in0378-4266/$-see front matter Ó2010Elsevier B.V.All rights reserved.doi:10.1016/j.jbankfin.2010.07.011*Corresponding author.Tel.:+17046877652;fax:+17046874014.E-mail addresses:tking3@ (T.-H.D.King),mwen2@ (M.-M.Wen).riskier investment that can create firm value.Moreover,the main focus of the studies on shareholder governance is the effects of shareholder governance on equity prices or debt yields (Klock et al.,2005;Bhojraj and Sengupta,2003;Gompers et al.,2003;Cre-mers and Nair,2005;Jiraporn and Gleason,2007).It is important to examine the protection for both shareholders and bondholders in the corporate governance structure for the fol-lowing reasons.First,current literature suggests that,when exam-ined individually,either shareholder or bondholder governance structure has significant impacts on the wealth of the claimholders.One should examine the overall governance structure consisting of controls implemented by both claimholders.For example,Acharya et al.(2009)suggest that when one examines the impacts of share-holder rights on investment policy,creditor rights need to be con-trolled for.Second,shareholder and bondholder governance structures interact with each other,and managerial decisions are derived from the consideration of such interactions between the two structures.Certain types of shareholder governance can lead to possible wealth transfers between bondholders and sharehold-ers.In the case of buyouts,shareholders prefer fewer takeover de-fenses to attract better monitoring of managers from the market for corporate control or eventually cash out with a substantial gain (Torabzadeh and Bertin,1987;Lehn and Poulsen,1989),and bond-holders generally lose in buyouts,transferring wealth to share-holders (Asquith and Wizman,1990;Baran and King,2010).Alternatively,debt covenants weaken shareholder rights by restricting the managers from making certain value-creating investments (e.g.,positive NPV projects)and guard against oppor-tunistic behavior that decreases firm value (e.g.,over-consumption of perks,overcompensation,shirking,and over-investing).For example,Billett et al.(2009)suggest that the change in the control covenant has a significantly negative effect on the likelihood of the firm being a takeover target.Literature suggests that the design of shareholder governance may harm the bondholders (or vice versa)due to the agency problems between the two stakeholders.The agency problems are summarized as follows:default risk concerns,takeover concerns,and asset substitution concerns.Therefore,shareholder and bondholder governance may overlap or create conflicts depending on their designs.As mentioned above,Cremers et al.(2007)highlight the interactions between shareholder and creditor protection and their impacts on bond yields.In addition to examining the interactions of shareholder and bondholder gov-ernance,we focus on the effects of overall governance on manage-rial risk-taking behavior.More specifically,we follow Coles et al.(2006)and use capital expenditure and R&D expense to represent risk-taking activities.R&D expense relates to the development of new products and services and is regarded as high-risk and long-term investments.On the other hand,capital expenditure on tan-gible assets is considered low-risk investments (Bhagat and Welch,1995;Kothari et al.,2002).Given limited resources,the allocation of capital between R&D and capital expenditure reflects managers’inclination to take risks.Prior research linking governance to bond and equity returns provides a test of an indirect relation.For example,Klock et al.(2005)find that a higher G-Index is associated with lower cost of debt.They suggest that these amendments reduce firm risk and cash flow variability and,therefore,protect the interests of the bondholders.However,they did not examine if corporate gover-nance directly leads to managerial decisions that reduce firm risk.In addition,existing literature suggests that shareholder gover-nance and management compensation influence the risk-taking activities of managers.Stein (1988)develops a model suggesting that when managers are sheltered by antitakeover amendments,they are more likely to engage in long-term projects.However,no empirical evidence has been provided therein.Coles et al.(2006)show a strong causal relation between managerial compen-sation and investment policy,debt policy,and firm risk that define managers’risk-taking behaviors.As managers’risk-taking behav-iors have significant effects on the returns of claimholders,one should study the direct relation between governance structure and investment policy,which is the missing link in the literature.We fill in this gap by studying how the corporate governance struc-ture affects managers’investment policy.Finally,recent literature suggests that shareholder governance,bondholder governance,and managerial policy are interrelated and should be examined jointly.In particular,John and Litov (2009)suggest that entrenched managers are able to secure better financing terms (borrowing costs and covenants)partly due to a more conservative investment policy.Two implications follow.First,while one should examine how shareholder and bondholder governance affect managerial decisions,it is just as important to examine how managerial investment behavior in turn influences governance designs.Second,with respect to the existing literature on how shareholder governance affects financing decisions (Klock et al.,2005;John and Litov,2009;Acharya et al.,2009;Chae et al.,2009),we claim that the use of debt and covenants is an alternative entrenchment device used by managers.We take one additional step to examine the interactions between shareholder governance and covenant design and their combined effects on managerial decisions,which have yet to be examined in the literature.We find that bondholder governance structure varies across industries and becomes stronger over time.Shareholder gover-nance structure,on the other hand,shows little variation across industries and remains relatively constant over time.We posit that the overall corporate governance structure consists of shareholder governance,measured by antitakeover provisions and bondholder governance in covenants.Under the simultaneous equations framework,we examine the relation between the firm’s invest-ment policy and the overall corporate governance structure.We find that strong bondholder governance leads to more low-risk investments such as capital expenditure and lower high-risk investments such as R&D investments.On the other hand,weak shareholder governance (high G-Index)is linked to high R&D expenditures,supporting the management entrenchment hypoth-esis.In addition,strong (weak)bondholder governance is often combined with weak (strong)shareholder governance.The results suggest that a firm’s investment policy is determined by the com-bined and possibly conflicting effects of bondholder and share-holder governance.Risky investments result from a weak overall corporate governance structure,whereas strong overall gover-nance leads to a conservative investment policy.A structure con-taining strong bondholder but weak shareholder governance (entrenched managers)suggests a mixed implication of risk-taking behavior,as bondholders prefer low-risk investments,while en-trenched managers favor long-term projects with high payoffs.A similar implication holds for a structure with weak bondholder and strong shareholder stly,firms with a large insti-tutional ownership and a high-leverage ratio are more likely to have strong bondholder and shareholder governance than those with a small institutional ownership.Regulated firms invest more in low-risk projects and have a weaker bondholder and share-holder governance than non-regulated companies.We further perform sub-sample analyses based on credit risk,financing covenants,and investment covenants,respectively.We find the relation between corporate governance and investment policy to be significantly different between speculative and invest-ment-grade firms.For speculative firms,strong bondholder or shareholder governance leads to low-risk projects in terms of high capital expenditure and low R&D investment.For investment-grade firms,strong bondholder and shareholder governance lead to low capital expenditure and an insignificant impact on R&D.In2T.-H.D.King,M.-M.Wen /Journal of Banking &Finance xxx (2010)xxx–xxxaddition,financing and investment covenants exhibit strong bind-ing power that leads to low-risk investments.Finally,we use dependent board as an alternative measure of shareholder gover-nance,and the results are similar to those using the G-Index.In particular,a more dependent (or a less independent)board leads to low capital expenditure and high R&D expense.This study makes the following significant contributions to the literature.First,we perform a thorough analysis of the overall structure of corporate governance consisting of bondholder and shareholder governance mechanisms and their interactions.Sec-ond,we examine how the overall governance structure affects managers’risk-taking behavior as shown in the firm’s investment policy.By doing so,we explore the complex structure of how the mitigation of agency conflict between shareholders and bondhold-ers (from bond covenants)and agency conflict between sharehold-ers and managers (from antitakeover provisions)is related to managerial decisions on investments.Finally,our findings help bridge the gap in the literature on corporate governance by explor-ing the following implications.(i)A managerial decision on invest-ment is the outcome of considering both shareholder governance and bondholder governance.(ii)A balanced governance structure between shareholders and bondholders should prompt the mana-gerial decisions that can benefit not only the shareholders,but also the bondholders.(iii)A governance structure that is over-weighted toward the shareholders may induce more aggressive risk-taking behavior by managers,which can benefit the shareholders,but harm the bondholders.(iv)A governance structure that is over-weighted toward bondholders may induce conservative manage-rial decisions that are likely to benefit the bondholders,but not the shareholders,or conservative decisions that can benefit neither bondholders nor shareholders.The paper is organized as follows.Section 2presents the litera-ture review and hypotheses.Section 3describes the sample data.In Section 4,we present the measures of corporate governance and their correlations.In Section 5,we discuss the multivariate model for our empirical analysis.Section 6shows the results of the simultaneous regressions for investment policy,shareholder governance,and bondholder governance and Section 7concludes the study.2.Literature review and hypothesesThere are two lines of research that are relevant to our study.The first line of research focuses on the effects of bondholder or shareholder governance on managerial decisions.Billett et al.(2007)discuss the interactions between the choice of debt cove-nants (bondholder protection)and the choice of leverage.In addi-tion,they examine how firm characteristics play a role in determining the overall covenant structure and how the covenant structure helps mitigate the agency cost of debt.Jiraporn and Gleason (2007)study the effects of shareholder governance mech-anisms on capital structure.They find that weaker shareholder rights incur higher agency costs,thereby leading to higher debt.In addition to the effects on financing strategies,shareholder governance also has an impact on managerial actions in terms of extracting private benefits,which,in turn,can affect the firm’s security holders.The managerial entrenchment hypothesis argues that antitakeover amendments are initiated at the expense of shareholders,as the incumbent management is motivated to en-gage in actions for job protection and/or private benefits (Jensen and Meckling,1976).Amihud and Lev (1981)state that managers hold undiversified portfolios,so they tend to engage in job protec-tion in order to reduce their human capital risk.On the other hand,antitakeover provisions can be viewed as a long-term contract for incumbent management that may not be beneficial to shareholdersex post,but are profitable ex ante if they can convey credible levels of commitment.For example,Stein (1988)suggests that if manag-ers are sheltered from takeover risk via antitakeover amendments,they are more likely to engage in long-term projects.In addition,Harris (1990)argues that golden parachutes promote managerial investment in the specialized human capital that is not marketable to other firms.Moreover,Masulis et al.(2007)find that managers at firms protected by a higher number of antitakeover provisions are subject to less monitoring and disciplinary power of the market of corporate control and are more inclined to invest in empire-building acquisitions that may destroy shareholder wealth.This line of research highlights the agency problems between share-holders and managers.The second line of research is the literature that examines the effects of shareholder governance on equity price (Gompers et al.,2003;Cremers and Nair,2005;Johnson et al.,2009)and on bond yield (Klock et al.,2005;Cremers et al.,2007).Gompers et al.(2003)create a governance index (G-Index)and examine the effects of this index on equity returns,firm value,and operating performance.They find that G-Index (measured by antitakeover provisions)is positively related to capital expenditure and nega-tively related to firm value.In other words,firms with more anti-takeover provisions (weaker shareholder rights)are linked to lower firm value.Klock et al.(2005)finds that higher G-Index low-ers the cost of debt financing,and that these antitakeover amend-ments serve as an effective tool to protect the interests of the bondholders.They also argue that antitakeover provisions could reduce firm risk and cash flow variability.In addition,Cremers et al.(2007)examine the effects of the interaction of different shareholder governance mechanisms on bond yields.They find that bondholders require a higher yield when shareholder rights are strong (i.e.,low G-Index).In this case,bondholders are mainly concerned with takeover risk due to the likelihood of increased leverage,restructuring,or asset substitution.They focus on three event risk covenants in bonds and indicate the importance of bondholder governance in aligning the interests of shareholders and bondholders.The concerns about the endogenous relations among the two governance mechanisms and managerial decisions have been raised in the literature and are addressed by applying a simulta-neous equations model.For example,Coles et al.(2009)examine the interactive relationship between management entrenchment and investment policy.John and Litov (2009)consider the endoge-neity between managerial entrenchment and leverage.Billett et al.(2007)consider the endogeneity between leverage and bondholder governance represented by debt covenants.John et al.(2008)argue that firms with entrenched managers (weak shareholder gover-nance)may be willing to render their company safe by adopting conservative investment policies in order to obtain better financing terms including bond covenants and rates.We adopt the same model in our examination of the interactive relationship between shareholder governance,bondholder governance,and managerial investment policy.We follow the literature above to develop the corporate gover-nance structure related to shareholders in designing antitakeover provisions (Gompers et al.,2003;Cremers and Nair,2005;Cremers et al.,2007;Masulis et al.,2007).In addition,we follow Cremers et al.(2007)and Billett et al.(2007)to create the corporate gover-nance structure related to bondholders based on bond covenants.Our study also controls for the effects of institutional ownership on the overall governance structure as suggested by Cremers and Nair (2005),Cremers et al.(2007),and Bhojraj and Sengupta (2003).While shareholder rights have been linked to firm value and security holder returns,we argue that the effects of share-holder rights on security returns should result from managerial decisions on investments.As stated above,we follow the approachT.-H.D.King,M.-M.Wen /Journal of Banking &Finance xxx (2010)xxx–xxx3of Coles et al.(2006)and use capital expenditure and R&D to mea-sure investment policy.Given limited capital,the allocation be-tween capital expenditure and R&D represents a substitution effect and the degree of managerial risk-taking.In particular,Coles et al.(2006)suggest that high R&D expense reflect high levels of risk-taking,while high capital expenditures indicate a conservative investment policy.Finally,Cremers et al.(2007)suggest that fur-ther investigation of the combined effects of the governance struc-ture consisting of shareholder rights and bondholder governance is critical in the research of corporate governance.Thus,we provide significant contributions to the literature by examining the effects of the complete governance structure on managerial risk-taking activities.Our study sheds light on how the agency problems among managers,shareholders,and bondholders are weighed in the determination of investment policy.Extending the extant literature,we develop the following hypotheses on the relation among shareholder governance,bond-holder governance,and managers’risk-taking activities.2.1.Effects of shareholder governance on managerial risk-taking activitiesThe literature provides opposite views on how shareholder gov-ernance affects managerial risk-taking activities.On one hand,agency theory suggests that managers may invest in negative NPV projects to extract private benefits (e.g.,empire building).Jensen and Ruback (1983)and Shleifer and Vishny (1986)suggest that the overinvestment problem becomes severe when managers are protected by antitakeover provisions.In particular,Jensen and Ruback (1983)indicate that managers reduce firm risk to protect their jobs given takeover defenses.Gompers et al.(2003)conclude that firms with a high G-Index (weak shareholder governance)have higher capital expenditures than do low G-Index firms based on the agency explanation.In addition,John et al.(2008)suggest that low G-Index (better shareholder protection)could lead firms to invest in riskier but value-creating projects.They conclude that better shareholder protection mitigates the extraction of private benefits,leading to extreme risk aversion.For example,corpora-tions with poor investor protection often have insiders with large control rights and private benefits,leading to conservative corpo-rate investments (Morck et al.,2005;Stulz,2005).Further,stron-ger shareholder rights make other stakeholders such as creditors,labor groups,and government less effective in reducing manage-rial risk-taking (Morck and Nakamura,1999;Tirole,2001).This view is further supported by Acharya et al.(2009),who find that shareholder interests induce focusing acquisitions (high-risk investments)after controlling for creditor rights.Based on this line of research,we expect that G-Index positively affects capital expenditure (low-risk investments),but negatively affects R&D (high-risk investments).On the other hand,Giroud and Mueller (2010)find that,by reducing the threat of hostile takeovers,business combination (BC)laws weaken corporate governance and increase the opportu-nity for managerial slack.Specifically,weaker corporate gover-nance leads to lower capital expenditure and higher R&D expense.However,Bertrand and Mullainathan (2003)find positive but insignificant effects of business combination law on capital expenditure.1In addition,management entrenchment through anti-takeover amendments (i.e.,the G-Index)helps reduce managerial myopia (DeAngelo and Rice,1983;Stein,1988).Managers invest in projects that have long-term payoffs without worrying about job losses during takeovers.Similarly,Harris (1990)suggests that goldenparachutes allow CEOs to invest in long-term projects and special-ized human capital that is not marketable to other firms.Coles et al.(2009)use the board co-option to measure CEO entrenchment and find that R&D intensity increases in co-option.They use R&D to measure intangible and long-term investments as well as firm-specific human capital that benefit the managers.These studies suggest that,all else being equal,entrenched managers invest more in firm-specific human capital and in projects with long-term pay-offs.Thus,the prediction is that firms with a high G-Index are more likely to have high R&D expense.2.2.Effects of bondholder governance on managerial risk-taking activitiesStrong bondholder protection suggests placing significant restrictions on managers’financing and investment decisions in order to minimize firm risk.Therefore,managers are more likely to invest in low-risk projects.This argument is supported by existing literature.For example,after controlling for shareholder rights,Acharya et al.(2009)suggest that stronger creditor rights induce firms to make risk-reducing investments and undertake lower financial risk.Their findings confirm the argument that strong creditor rights mitigate the agency problem between shareholders and creditors (e.g.,risk-shifting problems).Adler (1992)suggests that stronger creditor rights induce managers to reduce risk to avoid insolvency,but increase risk as the firm ap-proaches default.Similarly,Acharya and Subramanian (2009)sug-gest that stronger creditor rights in bankruptcy induce managers to reduce cash flow risks to lower the likelihood of distress.In addition,Chava and Roberts (2008)and Nini et al.(2009)find that debt covenants and enforcement of covenant violations inhi-bit investments,especially risky assets.In sum,we expect strong bondholder governance to lead to low R&D expenses and high capital expenditures.2.3.Interacted effects between stockholder and bondholder governanceThe extant literature suggests a relation between shareholder and bondholder governance.The first view indicates a negative relation between shareholder and bondholder governance.John and Litov (2009)suggest that entrenched managers (high G-Index and weak shareholder governance)rely more on debt to meet their external financing needs.They find a positive relationship between G-Index and leverage ratio.In addition,managers can use debt as an entrenchment device.Harris and Raviv (1988)argue that debt can be used by the incumbent managers to fend off raiders.If bond covenant protection increases in leverage as suggested by Billett et al.(2007),then we expect a negative relation between share-holder and bondholder governance (or a positive relation between the G-Index and bond covenants).The second view suggests a po-sitive relation between shareholder and bondholder governance.Cremers et al.(2007)suggest that bondholders require a higher yield when shareholder governance is strong (a low G-Index).Bondholders are concerned about takeover risk and thus impose more bond covenants to protect themselves.In addition,Klock et al.(2005)find that high G-Index (weak shareholder rights)re-duces the cost of debt financing that is partially attributed to fewer bond covenants.They conclude that bondholders view antitake-over amendments as an effective tool to protect their interests.As a result,firms with a high G-Index (weak shareholder gover-nance)are expected to have fewer covenants than those with a low G-Index.Therefore,we expect a positive relation between shareholder and bondholder governance (i.e.,a negative relation between the G-Index and bond covenants).1Bertrand and Mullainathan (2003)and Giroud and Mueller (2010)have shown that the passage of state takeover laws has a causal effect on firms’operating performance.4T.-H.D.King,M.-M.Wen /Journal of Banking &Finance xxx (2010)xxx–xxx。
数量依存关系的英文

数量依存关系的英文Quantitative Dependence RelationshipsThe study of quantitative dependence relationships is a fundamental aspect of scientific inquiry and data analysis. These relationships refer to the mathematical or statistical connections between two or more variables, where the value of one variable is influenced by the value of another. Understanding these relationships is crucial for making informed decisions, predicting future outcomes, and gaining insights into complex systems.One of the most common forms of quantitative dependence is linear regression. This statistical technique examines the relationship between a dependent variable and one or more independent variables. The goal is to find the best-fitting straight line that represents the average relationship between the variables. The slope of this line, known as the regression coefficient, indicates the expected change in the dependent variable for a unit change in the independent variable, assuming all other factors remain constant. This information can be used to make predictions or to understand the strength and direction of the relationship between the variables.Another type of quantitative dependence is correlation. Correlation measures the strength and direction of the linear relationship between two variables. The correlation coefficient, denoted as r, ranges from -1 to 1, with -1 indicating a perfect negative linear relationship, 0 indicating no linear relationship, and 1 indicating a perfect positive linear relationship. Correlation analysis is useful for identifying the degree to which two variables are associated, which can inform decision-making and guide further research.Beyond linear relationships, there are other forms of quantitative dependence, such as exponential, logarithmic, and polynomial relationships. Exponential relationships describe situations where the rate of change of one variable is proportional to its current value, leading to rapid growth or decay. Logarithmic relationships are often observed in situations involving scales or ratios, where the dependent variable changes proportionally to the logarithm of the independent variable. Polynomial relationships, which include quadratic and cubic functions, can capture more complex patterns in the data.The study of quantitative dependence relationships is not limited to the natural sciences. It is also widely used in social sciences, economics, and business applications. For example, in economics, the demand for a product may be dependent on its price, the prices of related products, and the income of consumers. Understandingthese relationships can help businesses and policymakers make informed decisions about pricing, production, and resource allocation.In the field of marketing, quantitative dependence relationships can be used to analyze the effectiveness of advertising campaigns. Researchers may investigate the relationship between advertising expenditure and sales, or the impact of various marketing strategies on customer loyalty and brand perception. These insights can guide the development of more effective marketing plans and the allocation of marketing resources.In the realm of public health, quantitative dependence relationships can be used to study the factors that influence disease prevalence or the effectiveness of public health interventions. For instance, researchers may examine the relationship between socioeconomic status, access to healthcare, and the incidence of certain diseases. This information can inform the design and implementation of public health policies and programs.The applications of quantitative dependence relationships are vast and diverse. They are instrumental in scientific discovery, decision-making, and the development of predictive models. As technology advances and data becomes increasingly abundant, the importance of understanding these relationships will only continue to grow. Bymastering the principles of quantitative dependence, researchers, policymakers, and practitioners can make more informed and data-driven decisions, leading to better outcomes for individuals, organizations, and society as a whole.。
correlation 标准流程
correlation 标准流程英文回答:Correlation.Correlation is a statistical measure that expresses the extent to which two variables are linearly related. It is a value between -1 and 1, where -1 indicates a perfect negative correlation, 0 indicates no correlation, and 1 indicates a perfect positive correlation.The correlation coefficient is calculated by dividing the covariance of the two variables by the product of their standard deviations. The covariance is a measure of how much the two variables vary together, and the standard deviation is a measure of how much each variable varies on its own.Correlation is a useful tool for understanding the relationship between two variables. It can be used toidentify trends, make predictions, and test hypotheses. However, it is important to note that correlation does not imply causation. Just because two variables are correlated does not mean that one causes the other.Types of Correlation.There are three main types of correlation:Positive correlation: This type of correlation occurs when two variables increase or decrease together. For example, the number of hours you study for a test and your score on the test are positively correlated.Negative correlation: This type of correlation occurs when one variable increases and the other variable decreases. For example, the amount of money you spend ongas and your car's gas mileage are negatively correlated.No correlation: This type of correlation occurs when there is no relationship between two variables. For example, the number of times you flip a coin and the number of headsyou get are not correlated.Strength of Correlation.The strength of a correlation is determined by the absolute value of the correlation coefficient. The closer the correlation coefficient is to 1 or -1, the stronger the correlation. A correlation coefficient of 0 indicates that there is no correlation between the two variables.Significance of Correlation.The significance of a correlation is determined by the p-value. The p-value is the probability of obtaining a correlation coefficient as large as or larger than the one that was observed, assuming that there is no correlation between the two variables. A p-value less than 0.05 is considered to be statistically significant.Correlation Analysis.Correlation analysis is a statistical technique that isused to identify and measure the relationship between two or more variables. Correlation analysis can be used to:Identify trends.Make predictions.Test hypotheses.Control for confounding variables.Correlation analysis is a valuable tool for understanding the relationships between variables. However, it is important to note that correlation does not imply causation.中文回答:相关性。
Correlation
究, 考虑两个变量之间的联合变动,而且这两个变量都不受实验者 的限制。
相关系数r (Sample Coefficient of Correlation): also known as
Pearson’s Product Moment, A measure of how well one variable is explained by another. The sign of r indicates the direction of the relationship between X and Y. 相关决定系数r2 (Sample Coefficient of Determination):A measure of the strength of a linear relationship between two variables. For example a correlation between X and Y variables with r2 = 0.90 means that 90% of the change in Y variable are explained by the line of the regression. 计算方法:
0.0780 0.0775 0.0770 0.0765 0.0760 0.0755 0.0750 0.0745 0.0740 0.0735 0.0730 0.0725 0.07300 y = 0.9289x + 0.0045 R2 = 0.9651
0.07400
0.07500
0.07600
0.07700
Solution : Stratify data by group, machine, process, etc.
相关分析(Correlate)
相关分析(Correlate)Correlation and dependenceIn statistics, correlation and dependence are any of a broad class of statistical relationships between two or more random variables or observed data values.Correlation is computed(用...计算)into what is known as the correlation coefficient(相关系数), which ranges between -1 and +1. Perfect positive correlation (a correlation co-efficient of +1) implies(意味着)that as one security(证券)moves, either up or down, the other security will move in lockstep(步伐一致的), in the same direction. Alternatively(同样的), perfect negative correlation means that if one security moves in either direction the security that is perfectly negatively correlated will move by an equal amount in the opposite(相反的)direction. If the correlation is 0, the movements of the securities are said to have no correlation; they are completely random(随意、胡乱).There are several correlation coefficients, often denoted(表示、指示)ρ or r, measuring(衡量、测量)the degree of correlation. The most common of these is the Pearson correlation coefficient, which is sensitive only to a linear(只进行两变量线性分析)relationship between two variables (which may exist even if one is a nonlinear function of the other).Other correlation coefficients have been developed to be more robust(有效的、稳健)than the Pearson correlation, or more sensitive to nonlinear relationships.Rank(等级)correlation coefficients, such as Spearman's rank correlation coefficient and Kendall's rank correlation coefficient (τ) measure the extent(范围)to which, as one variable increases, the other variable tends to increase, without requiring(需要、命令)that increase to be represented by a linear relationship. If, as the one variable(变量)increases(增加), the other decreases, the rank correlation coefficients will be negative. It is common to regard these rank correlation coefficients as alternatives to Pearson's coefficient, used either to reduce the amount of calculation or to make the coefficient less sensitive to non-normality in distributions(分布). However, this view has little mathematical basis, as rank correlation coefficients measure a different type of relationship than the Pearson product-moment correlation coefficient, and are best seen as measures of a different type of association, rather than as alternative measure of the population correlation coefficient.Common misconceptions(错误的想法)Correlation and causality(因果关系)The conventional(大会)dictum(声明)that "correlation does not imply causation" means that correlation cannot be used to infer a causal relationship between the variables.Correlation and linearityFour sets of data with the same correlation of 0.816The Pearson correlation coefficient indicates the strength of a linear relationship between two variables, but its value generally does not completely characterize their relationship. In particular, if the conditional mean of Y given X, denoted E(Y|X), is not linear in X, the correlation coefficient will not fully determine the form ofE(Y|X).The image on the right shows scatterplots(散点图)of Anscombe's quartet, a set of four different pairs of variables created by Francis Anscombe. The four y variables have the same mean (7.5), standard deviation (4.12), correlation (0.816) and regression line (y = 3 + 0.5x). However, as can be seen on the plots, the distribution of the variables is very different. The first one (top left) seems to be distributed normally, and corresponds to what one would expect when considering two variables correlated and following the assumption of normality. The second one (top right) is not distributed normally; while an obvious relationship between the two variables can be observed, it is not linear. In this case the Pearson correlation coefficient does not indicate that there is an exact functional relationship: only the extent to which that relationship can be approximated(大概)by a linear relationship. In the third case (bottom left), the linear relationship is perfect, except for one outlier which exerts enough influence to lower the correlation coefficient from 1 to0.816. Finally, the fourth example (bottom right) shows another example when one outlier(异常值)is enough to produce a high correlation coefficient, even though the relationship between the two variables is not linear.(离群值可降低、也可以增加数据的相关性。
皮尔逊相关系数英文
皮尔逊相关系数英文Title: Pearson Correlation CoefficientIntroduction:The Pearson correlation coefficient, also known as Pearson's r, is a statistical measure that quantifies the strength and direction of the linear relationship between two variables. It is widely used in various fields, including psychology, economics, and social sciences. This article aims to provide a concise overview of the Pearson correlation coefficient and its significance.Body:The Pearson correlation coefficient is a numerical value that ranges from -1 to +1. A value of -1 indicates a perfect negative correlation, meaning that as one variable increases, the other decreases in a linear fashion. Conversely, a value of +1 indicates a perfect positive correlation, where both variables increase or decrease together in a linear fashion. A value of 0 suggests no linear relationship between the variables.The calculation of the Pearson correlation coefficient involves comparing the variances and covariances of the two variables. It is computed by dividing the covariance of the variables by the product of their standard deviations. This normalization process ensures that the coefficient remains within the -1 to +1 range.The Pearson correlation coefficient has several important applications. Firstly, it is used to assess the strength and direction of relationships between variables. Researchers often employ this coefficient to determine if there is a significant association between two variables of interest. Additionally, it helps in identifying outliers or influential data points that may affect the overallcorrelation.Furthermore, the Pearson correlation coefficient is useful in predictive modeling. By understanding the relationship between variables, researchers can make more accurate predictions and develop effective strategies. For instance, in finance, this coefficient is used to analyze the relationship between stock prices and market indices, aiding investors in making informed decisions.Conclusion:In summary, the Pearson correlation coefficient is a powerful statistical tool that measures the strength and direction of the linear relationship between two variables. Its range of -1 to +1 provides valuable insights into the nature of the relationship. Understanding this coefficient allows researchers to make informed decisions, develop predictive models, and gain a deeper understanding of the data.。
- 1、下载文档前请自行甄别文档内容的完整性,平台不提供额外的编辑、内容补充、找答案等附加服务。
- 2、"仅部分预览"的文档,不可在线预览部分如存在完整性等问题,可反馈申请退款(可完整预览的文档不适用该条件!)。
- 3、如文档侵犯您的权益,请联系客服反馈,我们会尽快为您处理(人工客服工作时间:9:00-18:30)。
CORRELATION DEPENDENCES DETERMINED BY SIMULTANEOUS MULTISPACECRAFT OBSERV ATIONS OF SOLAR WIND AND IMF
STRUCTURES
P.A.DALIN and G.N.ZASTENKER
Space Research Institute,Profsojuznaia84/32,Moscow,117810,Russia
K.I.PAULARENA and J.D.RICHARDSON
Center for Space Research,M.I.T.,Cambridge,MA,02139U.S.A.
Abstract.Solar wind measurements on board several spacecraft were used to study the two-points correlations of the solar wind plasma structures.The factors having the most influence on the cor-relation level are the density variability and IMF cone angle.The characteristic length of large solar wind structures is estimated at500–1000R E.
1.Available Data and Method
We compared simultaneous ionflux data(1min.resolution)measured by widely-separated spacecraft(INTERBALL-1,IMP8and WIND)in1995–98.Many cases show similar features at each spacecraft,but in some cases plasma parameters behave very disparately.The global(averaged by the large statistics)value of the correlation coefficient is about0.73.
Multifactoral analysis was used to obtain the dependencies of the correlations on the spacecraft separation and the different plasma and magneticfield para-meters.The parameters available for our study are the solar wind speed,number density(or ionflux)and magneticfield components obtained with1or1.5min. time resolution.All measurements were divided into6-hour segments.For each segment the WIND and IMP8data were time-shifted to the INTERBALL-1times, compensating for the solar wind propagation time.
2.Results
The plasma parameters influence on the correlation level was studied.The in-fluence of density(or ionflux)variability(as estimated by the relative standard deviation rsd)is more than one of absolute values of the density,or the solar wind speed.We conclude that the structures with small variations(rsd<20%) have small spatial scales and these small scale structures are poorly correlated.On the other hand,plasma structures with large variations(rsd>20%)have a large Astrophysics and Space Science277:323–324,2001.
©2001Kluwer Academic Publishers.Printed in the Netherlands.
324P.A.DALIN ET AL.1
Figure1.[left]The dependence of the averaged correlations on the distance between IMP8and WIND s/c in the plane perpendicular to the Sun-Earth line(numbers of points are shown).
Figure2.[right]The dependence of the averaged correlations on the IMF cone angle.The empty boxes are for IMP8/WIND comparison;the shaded ones are for INTERBALL-1/WIND comparison. spatial scale,about one million km,and thus correlations for these features are high.
We have found a weak but certain dependence of the correlation value on space-craft separation perpendicular to the Sun-Earth line(Figure1).It means that the solar wind plasma characteristic length is very large(on average from500up to 1000R E or3–6·106km)in the plane perpendicular to its propagation.
The role of interplanetary magneticfield was studied also.The IMF cone angle (the angle between the IMF vector and the Sun-Earth line)is an important factor affecting the plasma correlation(Figure2).As the value of the cone angle increases the correlation of ionflux also increases.
Acknowledgements
This work was partly supported by Russian Foundation for Basic Research(grant 01-02-16182)and NASA contract NAG5-8720(JURRISS)to MIT and IKI(ad-ministered by the CRDF award RP0-847).
References
Paularena,K.I.,Zastenker,G.N.,Lazarus,A.J.and Dalin,P.A.:1998,J.Geophys.Res.A7103, 14601.
Zastenker,G.N.,Dalin,P.A.,Petrukovich,A.A,Nozdrachev,M.N.,Romanov,S.A.,Paularena,K.I., Richardson,J.D.,Lazarus,A.J.,Lepping,R.P.and Szabo,A.:2000,Phys.Chem.Earth25(1-2), 137.。