Hypothesis testing with efficient method of moments estimation
Stata xtreg 后处理命令说明书

Title xtreg postestimation—Postestimation tools for xtregDescription Syntax for predict Menu for predict Options for predictSyntax for xttest0Menu for xttest0Remarks and examples Methods and formulasReferences Also seeDescriptionThe following postestimation commands are of special interest after xtreg:Command Descriptionxttest0Breusch and Pagan LM test for random effectsThe following standard postestimation commands are also available:Command Descriptioncontrast contrasts and ANOV A-style joint tests of estimatesestat ic1Akaike’s and Schwarz’s Bayesian information criteria(AIC and BIC)estat summarize summary statistics for the estimation sampleestat vce variance–covariance matrix of the estimators(VCE)estimates cataloging estimation resultsforecast2dynamic forecasts and simulationshausman Hausman’s specification testlincom point estimates,standard errors,testing,and inference for linear combinationsof coefficientslrtest likelihood-ratio testmargins marginal means,predictive margins,marginal effects,and average marginaleffectsmarginsplot graph the results from margins(profile plots,interaction plots,etc.)nlcom point estimates,standard errors,testing,and inference for nonlinear combinationsof coefficientspredict predictions,residuals,influence statistics,and other diagnostic measurespredictnl point estimates,standard errors,testing,and inference for generalized predictions pwcompare pairwise comparisons of estimatestest Wald tests of simple and composite linear hypothesestestnl Wald tests of nonlinear hypotheses1estat ic is not appropriate after xtreg with the be,pa,or re option.2forecast is not appropriate with mi estimation results.12xtreg postestimation —Postestimation tools for xtregSpecial-interest postestimation commandsxttest0,for use after xtreg,re ,presents the Breusch and Pagan (1980)Lagrange multiplier test for random effects,a test that Var(νi )=0.Syntax for predictFor all but the population-averaged modelpredict type newvar if in,statistic nooffset Population-averaged modelpredict type newvar if in ,PA statistic nooffsetstatisticDescriptionMainxb x j b ,fitted values;the default stdp standard error of the fitted values ue u i +e it ,the combined residual∗xbu x j b +u i ,prediction including effect ∗u u i ,the fixed-or random-error component ∗e e it ,the overall error componentUnstarred statistics are available both in and out of sample;type predict ...if e(sample)...if wanted only for the estimation sample.Starred statistics are calculated only for the estimation sample,even when if e(sample)is not specified.PA statisticDescriptionMainmu probability of depvar ;considers the offset()rate probability of depvar xb linear predictionstdp standard error of the linear predictionscorefirst derivative of the log likelihood with respect to x j βThese statistics are available both in and out of sample;type predict ...if e(sample)...if wanted onlyfor the estimation sample.Menu for predictStatistics>Postestimation>Predictions,residuals,etc.Options for predict££Mainxb calculates the linear prediction,that is,a +bx it .This is the default for all except the population-averaged model.xtreg postestimation—Postestimation tools for xtreg3 stdp calculates the standard error of the linear prediction.For thefixed-effects model,this excludes the variance due to uncertainty about the estimate of u i.mu and rate both calculate the predicted probability of depvar.mu takes into account the offset(), and rate ignores those adjustments.mu and rate are equivalent if you did not specify offset().mu is the default for the population-averaged model.ue calculates the prediction of u i+e it.xbu calculates the prediction of a+bx it+u i,the prediction including thefixed or random component.u calculates the prediction of u i,the estimatedfixed or random effect.e calculates the prediction of e it.score calculates the equation-level score,u j=∂ln L j(x jβ)/∂(x jβ).nooffset is relevant only if you specified offset(varname)for xtreg,pa.It modifies the calculations made by predict so that they ignore the offset variable;the linear prediction is treated as x it b rather than x it b+offset it.Syntax for xttest0xttest0Menu for xttest0Statistics>Longitudinal/panel data>Linear models>Lagrange multiplier test for random effects Remarks and examples Example1Continuing with our xtreg,re estimation example(example4)in xtreg,we can see that xttest0 will report a test ofνi=0.In case we have any doubts,we could type.use /data/r13/nlswork(National Longitudinal Survey.Young Women14-26years of age in1968).xtreg ln_w grade age c.age#c.age ttl_exp c.ttl_exp#c.ttl_exp>tenure c.tenure#c.tenure2.race not_smsa south,re theta(output omitted).xttest0Breusch and Pagan Lagrangian multiplier test for random effectsln_wage[idcode,t]=Xb+u[idcode]+e[idcode,t]Estimated results:Var sd=sqrt(Var)ln_wage.2283326.4778416e.0845002.2906892u.0665151.2579053Test:Var(u)=0chibar2(01)=14779.98Prob>chibar2=0.00004xtreg postestimation—Postestimation tools for xtregExample2More importantly,after xtreg,re estimation,hausman will perform the Hausman specification test.If our model is correctly specified,and ifνi is uncorrelated with x it,the(subset of)coefficients that are estimated by thefixed-effects estimator and the same coefficients that are estimated here should not statistically differ:.xtreg ln_w grade age c.age#c.age ttl_exp c.ttl_exp#c.ttl_exp>tenure c.tenure#c.tenure2.race not_smsa south,re(output omitted).estimates store random_effects.xtreg ln_w grade age c.age#c.age ttl_exp c.ttl_exp#c.ttl_exp>tenure c.tenure#c.tenure2.race not_smsa south,fe(output omitted).hausman.random_effectsCoefficients(b)(B)(b-B)sqrt(diag(V_b-V_B)).random_eff~s Difference S.E.age.0359987.0368059-.0008073.0013177c.age#c.age-.000723-.0007133-9.68e-06.0000184ttl_exp.0334668.0290208.0044459.001711c.ttl_exp#~p.0002163.0003049-.0000886.000053tenure.0357539.0392519-.003498.0005797c.tenure#c~e-.0019701-.0020035.0000334.0000373not_smsa-.0890108-.1308252.0418144.0062745south-.0606309-.0868922.0262613.0081345b=consistent under Ho and Ha;obtained from xtregB=inconsistent under Ha,efficient under Ho;obtained from xtreg Test:Ho:difference in coefficients not systematicchi2(8)=(b-B)’[(V_b-V_B)^(-1)](b-B)=149.43Prob>chi2=0.0000We can reject the hypothesis that the coefficients are the same.Before turning to what this means, note that hausman listed the coefficients estimated by the two models.It did not,however,list grade and2.race.hausman did not make a mistake;in the Hausman test,we compare only the coefficients estimated by both techniques.What does this mean?We have an unpleasant choice:we can admit that our model is misspecified—that we have not parameterized it correctly—or we can hold that our specifica-tion is correct,in which case the observed differences must be due to the zero correlation ofνi and the x it assumption.T echnical noteWe can also mechanically explore the underpinnings of the test’s dissatisfaction.In the comparison table from hausman,it is the coefficients on not smsa and south that exhibit the largest differences. In equation(1 )of[XT]xtreg,we showed how to decompose a model into within and between effects. Let’s do that with these two variables,assuming that changes in the average have one effect,whereas transitional changes have another:xtreg postestimation—Postestimation tools for xtreg5.egen avgnsmsa=mean(not_smsa),by(id).generate devnsma=not_smsa-avgnsmsa(8missing values generated).egen avgsouth=mean(south),by(id).generate devsouth=south-avgsouth(8missing values generated).xtreg ln_w grade age c.age#c.age ttl_exp c.ttl_exp#c.ttl_exp tenure c.tenure#>c.tenure2.race avgnsm devnsm avgsou devsouRandom-effects GLS regression Number of obs=28091Group variable:idcode Number of groups=4697R-sq:within=0.1723Obs per group:min=1 between=0.4809avg= 6.0overall=0.3737max=15Wald chi2(12)=9319.56 corr(u_i,X)=0(assumed)Prob>chi2=0.0000 ln_wage Coef.Std.Err.z P>|z|[95%Conf.Interval]grade.0631716.001790335.290.000.0596627.0666805age.0375196.003118612.030.000.0314072.043632c.age#c.age-.0007248.00005-14.500.000-.0008228-.0006269ttl_exp.0286543.002420711.840.000.0239098.0333989c.ttl_exp#c.ttl_exp.0003222.0001162 2.770.006.0000945.0005499tenure.0394423.00175422.490.000.0360044.0428801c.tenure#c.tenure-.0020081.0001192-16.850.000-.0022417-.0017746raceblack-.0545936.0102101-5.350.000-.074605-.0345821avgnsmsa-.1833237.0109339-16.770.000-.2047537-.1618937devnsma-.0887596.0095071-9.340.000-.1073931-.070126avgsouth-.1011235.0098789-10.240.000-.1204858-.0817611devsouth-.0598538.0109054-5.490.000-.081228-.0384797 _cons.2682987.0495778 5.410.000.171128.3654694sigma_u.2579182sigma_e.29068923rho.44047745(fraction of variance due to u_i)We will leave the reinterpretation of this model to you,except that if we were really going to sell this model,we would have to explain why the between and within effects are different.Focusing on residence in a non-SMSA,we might tell a story about rural people being paid less and continuing to get paid less when they move to the SMSA.Given our panel data,we could create variables to measure this(an indicator for moved from non-SMSA to SMSA)and to measure the effects.In our assessment of this model,we should think about women in the cities moving to the country and their relative productivity in a bucolic setting.6xtreg postestimation—Postestimation tools for xtregIn any case,the Hausman test now is.estimates store new_random_effects.xtreg ln_w grade age c.age#c.age ttl_exp c.ttl_exp#c.ttl_exp>tenure c.tenure#c.tenure2.race avgnsm devnsm avgsou devsou,fe(output omitted).hausman.new_random_effectsCoefficients(b)(B)(b-B)sqrt(diag(V_b-V_B)).new_random~s Difference S.E.age.0359987.0375196-.0015209.0013198c.age#c.age-.000723-.0007248 1.84e-06.0000184ttl_exp.0334668.0286543.0048124.0017127c.ttl_exp#~p.0002163.0003222-.0001059.0000531tenure.0357539.0394423-.0036884.0005839c.tenure#c~e-.0019701-.0020081.000038.0000377devnsma-.0890108-.0887596-.0002512.000683devsouth-.0606309-.0598538-.0007771.0007618b=consistent under Ho and Ha;obtained from xtregB=inconsistent under Ha,efficient under Ho;obtained from xtreg Test:Ho:difference in coefficients not systematicchi2(8)=(b-B)’[(V_b-V_B)^(-1)](b-B)=92.52Prob>chi2=0.0000We have mechanically succeeded in greatly reducing theχ2,but not by enough.The major differences now are in the age,experience,and tenure effects.We already knew this problem existed because of the ever-increasing effect of experience.More careful parameterization work rather than simply including squares needs to be done.Methods and formulasxttest0reports the Lagrange multiplier test for random effects developed by Breusch and Pagan(1980)and as modified by Baltagi and Li(1990).The modely it=α+x itβ+νitisfit via OLS,and then the quantityλLM=(nT)22A21(iT2i)−nTis calculated,whereA1=1− ni=1(T it=1v it)2itv2itxtreg postestimation—Postestimation tools for xtreg7 The Baltagi and Li modification allows for unbalanced data and reduces to the standard formulaλLM=nT2(T−1)i(tv it)2itv2it−12, σ2u≥0 0, σ2u<0when T i=T(balanced data).Under the null hypothesis,λLM is distributed as a50:50mixture of a point mass at zero andχ2(1).ReferencesBaltagi,B.H.,and Q.Li.1990.A Lagrange multiplier test for the error components model with incomplete panels.Econometric Reviews9:103–107.Breusch,T.S.,and A.R.Pagan.1980.The Lagrange multiplier test and its applications to model specification in econometrics.Review of Economic Studies47:239–253.Hausman,J.A.1978.Specification tests in econometrics.Econometrica46:1251–1271.Sosa-Escudero,W.,and A.K.Bera.2008.Tests for unbalanced error-components models under local misspecification.Stata Journal8:68–78.Verbeke,G.,and G.Molenberghs.2003.The use of score tests for inference on variance components.Biometrics 59:254–262.Also see[XT]xtreg—Fixed-,between-,and random-effects and population-averaged linear models[U]20Estimation and postestimation commands。
统计学术语英文

population 母体sample 样本census 普查sampling 抽样quantitative 量的qualitative/categorical质的discrete 离散的continuous 连续的population parameters 母体参数sample statistics 样本统计量descriptive statistics 叙述统计学inferential/inductive statistics 推论... 抽样调查(sampliing survey单纯随机抽样(simple random sampling 系统抽样(systematic sampling分层抽样(stratified sampling整群抽样(cluster sampling多级抽样(multistage sampling常态分配(Parametric Statistics)无母数统计学(Nonparametric Statistics) 实验设计(Design of Experiment)参数(Parameter)Data analysis 资料分析Statistical table 统计表Statistical chart 统计图Pie chart 圆饼图Stem-and-leaf display 茎叶图Box plot 盒须图Histogram 直方图Bar Chart 长条图Polygon 次数多边图Ogive 肩形图Descriptive statistics 叙述统计学Expectation 期望值Mode 众数Mean 平均数Variance 变异数Standard deviation 标准差Standard error 标准误Covariance matrix 共变异数矩阵Inferential statistics 推论统计学Point estimation 点估计Interval estimation 区间估计Confidence interval 信赖区间Confidence coefficient 信赖系数Testing statistical hypothesis 统计假设检定Regression analysis 回归分析Analysis of variance 变异数分析Correlation coefficient 相关系数Sampling survey 抽样调查Census 普查Sampling 抽样Reliability 信度Validity 效度Sampling error 抽样误差Non-sampling error 非抽样误差Random sampling 随机抽样Simple random sampling 简单随机抽样法Stratified sampling 分层抽样法Cluster sampling 群集抽样法Systematic sampling 系统抽样法Two-stage random sampling 两段随机抽样法Convenience sampling 便利抽样Quota sampling 配额抽样Snowball sampling 雪球抽样Nonparametric statistics 无母数统计The sign test 等级检定Wilcoxon signed rank tests 魏克森讯号等级检定Wilcoxon rank sum tests 魏克森等级和检定Run test 连检定法Discrete uniform densities 离散的均匀密度Binomial densities 二项密度Hypergeometric densities 超几何密度Poisson densities 卜松密度Geometric densities 几何密度Negative binomial densities 负二项密度Continuous uniform densities 连续均匀密度Normal densities 常态密度Exponential densities 指数密度Gamma densities 伽玛密度Beta densities 贝他密度Multivariate analysis 多变量分析Principal components 主因子分析Discrimination analysis 区别分析Cluster analysis 群集分析Factor analysis 因素分析Survival analysis 存活分析Time series analysis 时间序列分析Linear models 线性模式Quality engineering 品质工程Probability theory 机率论Statistical computing 统计计算Statistical inference 统计推论Stochastic processes 随机过程Decision theory 决策理论Discrete analysis 离散分析Mathematical statistics 数理统计统计学: Statistics母体: Population样本: Sample资料分析: Data analysis统计表: Statistical table统计图: Statistical chart圆饼图: Pie chart茎叶图: Stem-and-leaf display 盒须图: Box plot直方图: Histogram长条图: Bar Chart次数多边图: Polygon肩形图: Ogive叙述统计学: Descriptive statistics 期望值: Expectation众数: Mode平均数: Mean变异数: Variance标准差: Standard deviation标准误: Standard error共变异数矩阵: Covariance matrix 推论统计学: Inferential statistics 点估计: Point estimation区间估计: Interval estimation信赖区间: Confidence interval信赖系数: Confidence coefficient统计假设检定: Testing statistical hypothesis回归分析: Regression analysis变异数分析: Analysis of variance相关系数: Correlation coefficient抽样调查: Sampling survey普查: Census抽样: Sampling信度: Reliability效度: Validity抽样误差: Sampling error非抽样误差: Non-sampling error随机抽样: Random sampling简单随机抽样法: Simple random sampling分层抽样法: Stratified sampling群集抽样法: Cluster sampling系统抽样法: Systematic sampling两段随机抽样法: Two-stage random sampling 便利抽样: Convenience sampling配额抽样: Quota sampling雪球抽样: Snowball sampling无母数统计: Nonparametric statistics等级检定: The sign test魏克森讯号等级检定: Wilcoxon signed rank tests 魏克森等级和检定: Wilcoxon rank sum tests连检定法: Run test离散的均匀密度: Discrete uniform densities二项密度: Binomial densities超几何密度: Hypergeometric densities卜松密度: Poisson densities几何密度: Geometric densities负二项密度: Negative binomial densities连续均匀密度: Continuous uniform densities常态密度: Normal densities指数密度: Exponential densities伽玛密度: Gamma densities贝他密度: Beta densities多变量分析: Multivariate analysis主因子分析: Principal components区别分析: Discrimination analysis群集分析: Cluster analysis因素分析: Factor analysis存活分析: Survival analysis时间序列分析: Time series analysis线性模式: Linear models品质工程: Quality engineering机率论: Probability theory统计计算: Statistical computing统计推论: Statistical inference随机过程: Stochastic processes决策理论: Decision theory离散分析: Discrete analysis数理统计: Mathematical statistics统计名词市调辞典众数(Mode) 普查(census)指数(Index) 问卷(Questionnaire)中位数(Median) 信度(Reliability)百分比(Percentage) 母群体(Population)信赖水准(Confidence level) 观察法(Observational Survey)假设检定(Hypothesis Testing) 综合法(Integrated Survey)卡方检定(Chi-square Test) 雪球抽样(Snowball Sampling)差距量表(Interval Scale) 序列偏差(Series Bias)类别量表(Nominal Scale) 次级资料(Secondary Data)顺序量表(Ordinal Scale) 抽样架构(Sampling frame)比率量表(Ratio Scale) 集群抽样(Cluster Sampling)连检定法(Run Test) 便利抽样(Convenience Sampling)符号检定(Sign Test) 抽样调查(Sampling Sur)算术平均数(Arithmetic Mean) 非抽样误差(non-sampling error) 展示会法(Display Survey)调查名词准确效度(Criterion-Related Validity)元素(Element) 邮寄问卷法(Mail Interview)样本(Sample) 信抽样误差(Sampling error)效度(Validity) 封闭式问题(Close Question)精确度(Precision) 电话访问法(Telephone Interview)准确度(Validity) 随机抽样法(Random Sampling)实验法(Experiment Survey)抽样单位(Sampling unit) 资讯名词市场调查(Marketing Research) 决策树(Decision Trees)容忍误差(Tolerated erro) 资料采矿(Data Mining)初级资料(Primary Data) 时间序列(Time-Series Forecasting) 目标母体(Target Population) 回归分析(Regression)抽样偏差(Sampling Bias) 趋势分析(Trend Analysis)抽样误差(sampling error) 罗吉斯回归(Logistic Regression)架构效度(Construct Validity) 类神经网络(Neural Network)配额抽样(Quota Sampling) 无母数统计检定方法(Non-Parametric Test) 人员访问法(Interview) 判别分析法(Discriminant Analysis)集群分析法(cluster analysis) 规则归纳法(Rules Induction)内容效度(Content Validity) 判断抽样(Judgment Sampling)开放式问题(Open Question) OLAP(Online Analytical Process)分层随机抽样(Stratified Random sampling) 资料仓储(Data Warehouse) 非随机抽样法(Nonrandom Sampling) 知识发现(Knowledge Discovery Absolute deviation, 绝对离差Absolute number, 绝对数Absolute residuals, 绝对残差Acceleration array, 加速度立体阵Acceleration in an arbitrary direction, 任意方向上的加速度Acceleration normal, 法向加速度Acceleration space dimension, 加速度空间的维数Acceleration tangential, 切向加速度Acceleration vector, 加速度向量Acceptable hypothesis, 可接受假设Accumulation, 累积Accuracy, 准确度Actual frequency, 实际频数Adaptive estimator, 自适应估计量Addition, 相加Addition theorem, 加法定理Additive Noise, 加性噪声Additivity, 可加性Adjusted rate, 调整率Adjusted value, 校正值Admissible error, 容许误差Aggregation, 聚集性Alpha factoring,α因子法Alternative hypothesis, 备择假设Among groups, 组间Amounts, 总量Analysis of correlation, 相关分析Analysis of covariance, 协方差分析Analysis Of Effects, 效应分析Analysis Of Variance, 方差分析Analysis of regression, 回归分析Analysis of time series, 时间序列分析Analysis of variance, 方差分析Angular transformation, 角转换ANOVA (analysis of variance), 方差分析ANOVA Models, 方差分析模型ANOVA table and eta, 分组计算方差分析Arcing, 弧/弧旋Arcsine transformation, 反正弦变换Area 区域图Area under the curve, 曲线面积AREG , 评估从一个时间点到下一个时间点回归相关时的误差ARIMA, 季节和非季节性单变量模型的极大似然估计Arithmetic grid paper, 算术格纸Arithmetic mean, 算术平均数Arrhenius relation, 艾恩尼斯关系Assessing fit, 拟合的评估Associative laws, 结合律Asymmetric distribution, 非对称分布Asymptotic bias, 渐近偏倚Asymptotic efficiency, 渐近效率Asymptotic variance, 渐近方差Attributable risk, 归因危险度Attribute data, 属性资料Attribution, 属性Autocorrelation, 自相关Autocorrelation of residuals, 残差的自相关Average, 平均数Average confidence interval length, 平均置信区间长度Average growth rate, 平均增长率Bar chart, 条形图Bar graph, 条形图Base period, 基期Bayes' theorem , Bayes定理Bell-shaped curve, 钟形曲线Bernoulli distribution, 伯努力分布Best-trim estimator, 最好切尾估计量Bias, 偏性Binary logistic regression, 二元逻辑斯蒂回归Binomial distribution, 二项分布Bisquare, 双平方Bivariate Correlate, 二变量相关Bivariate normal distribution, 双变量正态分布Bivariate normal population, 双变量正态总体Biweight interval, 双权区间Biweight M-estimator, 双权M估计量Block, 区组/配伍组BMDP(Biomedical computer programs), BMDP统计软件包Boxplots, 箱线图/箱尾图Breakdown bound, 崩溃界/崩溃点Canonical correlation, 典型相关Caption, 纵标目Case-control study, 病例对照研究Categorical variable, 分类变量Catenary, 悬链线Cauchy distribution, 柯西分布Cause-and-effect relationship, 因果关系Cell, 单元Censoring, 终检Center of symmetry, 对称中心Centering and scaling, 中心化和定标Central tendency, 集中趋势Central value, 中心值CHAID -χ2 Automatic Interaction Detector, 卡方自动交互检测Chance, 机遇Chance error, 随机误差Chance variable, 随机变量Characteristic equation, 特征方程Characteristic root, 特征根Characteristic vector, 特征向量Chebshev criterion of fit, 拟合的切比雪夫准则Chernoff faces, 切尔诺夫脸谱图Chi-square test, 卡方检验/χ2检验Choleskey decomposition, 乔洛斯基分解Circle chart, 圆图Class interval, 组距Class mid-value, 组中值Class upper limit, 组上限Classified variable, 分类变量Cluster analysis, 聚类分析Cluster sampling, 整群抽样Code, 代码Coded data, 编码数据Coding, 编码Coefficient of contingency, 列联系数Coefficient of determination, 决定系数Coefficient of multiple correlation, 多重相关系数Coefficient of partial correlation, 偏相关系数Coefficient of production-moment correlation, 积差相关系数Coefficient of rank correlation, 等级相关系数Coefficient of regression, 回归系数Coefficient of skewness, 偏度系数Coefficient of variation, 变异系数Cohort study, 队列研究Collinearity, 共线性Column, 列Column effect, 列效应Column factor, 列因素Combination pool, 合并Combinative table, 组合表Common factor, 共性因子Common regression coefficient, 公共回归系数Common value, 共同值Common variance, 公共方差Common variation, 公共变异Communality variance, 共性方差Comparability, 可比性Comparison of bathes, 批比较Comparison value, 比较值Compartment model, 分部模型Compassion, 伸缩Complement of an event, 补事件Complete association, 完全正相关Complete dissociation, 完全不相关Complete statistics, 完备统计量Completely randomized design, 完全随机化设计Composite event, 联合事件Composite events, 复合事件Concavity, 凹性Conditional expectation, 条件期望Conditional likelihood, 条件似然Conditional probability, 条件概率Conditionally linear, 依条件线性Confidence interval, 置信区间Confidence limit, 置信限Confidence lower limit, 置信下限Confidence upper limit, 置信上限Confirmatory Factor Analysis , 验证性因子分析Confirmatory research, 证实性实验研究Confounding factor, 混杂因素Conjoint, 联合分析Consistency, 相合性Consistency check, 一致性检验Consistent asymptotically normal estimate, 相合渐近正态估计Consistent estimate, 相合估计Constrained nonlinear regression, 受约束非线性回归Constraint, 约束Contaminated distribution, 污染分布Contaminated Gausssian, 污染高斯分布Contaminated normal distribution, 污染正态分布Contamination, 污染Contamination model, 污染模型Contingency table, 列联表Contour, 边界线Contribution rate, 贡献率Control, 对照, 质量控制图Controlled experiments, 对照实验Conventional depth, 常规深度Convolution, 卷积Corrected factor, 校正因子Corrected mean, 校正均值Correction coefficient, 校正系数Correctness, 正确性Correlation coefficient, 相关系数Correlation, 相关性Correlation index, 相关指数Correspondence, 对应Counting, 计数Counts, 计数/频数Covariance, 协方差Covariant, 共变Cox Regression, Cox回归Criteria for fitting, 拟合准则Criteria of least squares, 最小二乘准则Critical ratio, 临界比Critical region, 拒绝域Critical value, 临界值Cross-over design, 交叉设计Cross-section analysis, 横断面分析Cross-section survey, 横断面调查Crosstabs , 交叉表Crosstabs 列联表分析Cross-tabulation table, 复合表Cube root, 立方根Cumulative distribution function, 分布函数Cumulative probability, 累计概率Curvature, 曲率/弯曲Curvature, 曲率Curve Estimation, 曲线拟合Curve fit , 曲线拟和Curve fitting, 曲线拟合Curvilinear regression, 曲线回归Curvilinear relation, 曲线关系Cut-and-try method, 尝试法Cycle, 周期Cyclist, 周期性D test, D检验Data acquisition, 资料收集Data bank, 数据库Data capacity, 数据容量Data deficiencies, 数据缺乏Data handling, 数据处理Data manipulation, 数据处理Data processing, 数据处理Data reduction, 数据缩减Data set, 数据集Data sources, 数据来源Data transformation, 数据变换Data validity, 数据有效性Data-in, 数据输入Data-out, 数据输出Dead time, 停滞期Degree of freedom, 自由度Degree of precision, 精密度Degree of reliability, 可靠性程度Degression, 递减Density function, 密度函数Density of data points, 数据点的密度Dependent variable, 应变量/依变量/因变量Dependent variable, 因变量Depth, 深度Derivative matrix, 导数矩阵Derivative-free methods, 无导数方法Design, 设计Determinacy, 确定性Determinant, 行列式Determinant, 决定因素Deviation, 离差Deviation from average, 离均差Diagnostic plot, 诊断图Dichotomous variable, 二分变量Differential equation, 微分方程Direct standardization, 直接标准化法Direct Oblimin, 斜交旋转Discrete variable, 离散型变量DISCRIMINANT, 判断Discriminant analysis, 判别分析Discriminant coefficient, 判别系数Discriminant function, 判别值Dispersion, 散布/分散度Disproportional, 不成比例的Disproportionate sub-class numbers, 不成比例次级组含量Distribution free, 分布无关性/免分布Distribution shape, 分布形状Distribution-free method, 任意分布法Distributive laws, 分配律Disturbance, 随机扰动项Dose response curve, 剂量反应曲线Double blind method, 双盲法Double blind trial, 双盲试验Double exponential distribution, 双指数分布Double logarithmic, 双对数Downward rank, 降秩Dual-space plot, 对偶空间图DUD, 无导数方法Duncan's new multiple range method, 新复极差法/Duncan新法Error Bar, 均值相关区间图Effect, 实验效应Eigenvalue, 特征值Eigenvector, 特征向量Ellipse, 椭圆Empirical distribution, 经验分布Empirical probability, 经验概率单位Enumeration data, 计数资料Equal sun-class number, 相等次级组含量Equally likely, 等可能Equivariance, 同变性Error, 误差/错误Error of estimate, 估计误差Error type I, 第一类错误Error type II, 第二类错误Estimand, 被估量Estimated error mean squares, 估计误差均方Estimated error sum of squares, 估计误差平方和Euclidean distance, 欧式距离Event, 事件Event, 事件Exceptional data point, 异常数据点Expectation plane, 期望平面Expectation surface, 期望曲面Expected values, 期望值Experiment, 实验Experimental sampling, 试验抽样Experimental unit, 试验单位Explained variance (已说明方差)Explanatory variable, 说明变量Exploratory data analysis, 探索性数据分析Explore Summarize, 探索-摘要Exponential curve, 指数曲线Exponential growth, 指数式增长EXSMOOTH, 指数平滑方法Extended fit, 扩充拟合Extra parameter, 附加参数Extrapolation, 外推法Extreme observation, 末端观测值Extremes, 极端值/极值F distribution, F分布F test, F检验Factor, 因素/因子Factor analysis, 因子分析Factor Analysis, 因子分析Factor score, 因子得分Factorial, 阶乘Factorial design, 析因试验设计False negative, 假阴性False negative error, 假阴性错误Family of distributions, 分布族Family of estimators, 估计量族Fanning, 扇面Fatality rate, 病死率Field investigation, 现场调查Field survey, 现场调查Finite population, 有限总体Finite-sample, 有限样本First derivative, 一阶导数First principal component, 第一主成分First quartile, 第一四分位数Fisher information, 费雪信息量Fitted value, 拟合值Fitting a curve, 曲线拟合Fixed base, 定基Fluctuation, 随机起伏Forecast, 预测Four fold table, 四格表Fourth, 四分点Fraction blow, 左侧比率Fractional error, 相对误差Frequency, 频率Frequency polygon, 频数多边图Frontier point, 界限点Function relationship, 泛函关系Gamma distribution, 伽玛分布Gauss increment, 高斯增量Gaussian distribution, 高斯分布/正态分布Gauss-Newton increment, 高斯-牛顿增量General census, 全面普查Generalized least squares, 综合最小平方法GENLOG (Generalized liner models), 广义线性模型Geometric mean, 几何平均数Gini's mean difference, 基尼均差GLM (General liner models), 通用线性模型Goodness of fit, 拟和优度/配合度Gradient of determinant, 行列式的梯度Graeco-Latin square, 希腊拉丁方Grand mean, 总均值Gross errors, 重大错误Gross-error sensitivity, 大错敏感度Group averages, 分组平均Grouped data, 分组资料Guessed mean, 假定平均数Half-life, 半衰期Hampel M-estimators, 汉佩尔M估计量Happenstance, 偶然事件Harmonic mean, 调和均数Hazard function, 风险均数Hazard rate, 风险率Heading, 标目Heavy-tailed distribution, 重尾分布Hessian array, 海森立体阵Heterogeneity, 不同质Heterogeneity of variance, 方差不齐Hierarchical classification, 组内分组Hierarchical clustering method, 系统聚类法High-leverage point, 高杠杆率点High-Low, 低区域图Higher Order Interaction Effects,高阶交互作用HILOGLINEAR, 多维列联表的层次对数线性模型Hinge, 折叶点Histogram, 直方图Historical cohort study, 历史性队列研究Holes, 空洞HOMALS, 多重响应分析Homogeneity of variance, 方差齐性Homogeneity test, 齐性检验Huber M-estimators, 休伯M估计量Hyperbola, 双曲线Hypothesis testing, 假设检验Hypothetical universe, 假设总体Image factoring,, 多元回归法Impossible event, 不可能事件Independence, 独立性Independent variable, 自变量Index, 指标/指数Indirect standardization, 间接标准化法Individual, 个体Inference band, 推断带Infinite population, 无限总体Infinitely great, 无穷大Infinitely small, 无穷小Influence curve, 影响曲线Information capacity, 信息容量Initial condition, 初始条件Initial estimate, 初始估计值Initial level, 最初水平Interaction, 交互作用Interaction terms, 交互作用项Intercept, 截距Interpolation, 内插法Interquartile range, 四分位距Interval estimation, 区间估计Intervals of equal probability, 等概率区间Intrinsic curvature, 固有曲率Invariance, 不变性Inverse matrix, 逆矩阵Inverse probability, 逆概率Inverse sine transformation, 反正弦变换Iteration, 迭代Jacobian determinant, 雅可比行列式Joint distribution function, 分布函数Joint probability, 联合概率Joint probability distribution, 联合概率分布K-Means Cluster逐步聚类分析K means method, 逐步聚类法Kaplan-Meier, 评估事件的时间长度Kaplan-Merier chart, Kaplan-Merier图Kendall's rank correlation, Kendall等级相关Kinetic, 动力学Kolmogorov-Smirnove test, 柯尔莫哥洛夫-斯米尔诺夫检验Kruskal and Wallis test, Kruskal及Wallis检验/多样本的秩和检验/H检验Kurtosis, 峰度Lack of fit, 失拟Ladder of powers, 幂阶梯Lag, 滞后Large sample, 大样本Large sample test, 大样本检验Latin square, 拉丁方Latin square design, 拉丁方设计Leakage, 泄漏Least favorable configuration, 最不利构形Least favorable distribution, 最不利分布Least significant difference, 最小显著差法Least square method, 最小二乘法Least Squared Criterion,最小二乘方准则Least-absolute-residuals estimates, 最小绝对残差估计Least-absolute-residuals fit, 最小绝对残差拟合Least-absolute-residuals line, 最小绝对残差线Legend, 图例L-estimator, L估计量L-estimator of location, 位置L估计量L-estimator of scale, 尺度L估计量Level, 水平Leveage Correction,杠杆率校正Life expectance, 预期期望寿命Life table, 寿命表Life table method, 生命表法Light-tailed distribution, 轻尾分布Likelihood function, 似然函数Likelihood ratio, 似然比line graph, 线图Linear correlation, 直线相关Linear equation, 线性方程Linear programming, 线性规划Linear regression, 直线回归Linear Regression, 线性回归Linear trend, 线性趋势Loading, 载荷Location and scale equivariance, 位置尺度同变性Location equivariance, 位置同变性Location invariance, 位置不变性Location scale family, 位置尺度族Log rank test, 时序检验Logarithmic curve, 对数曲线Logarithmic normal distribution, 对数正态分布Logarithmic scale, 对数尺度Logarithmic transformation, 对数变换Logic check, 逻辑检查Logistic distribution, 逻辑斯特分布Logit transformation, Logit转换LOGLINEAR, 多维列联表通用模型Lognormal distribution, 对数正态分布Lost function, 损失函数Low correlation, 低度相关Lower limit, 下限Lowest-attained variance, 最小可达方差LSD, 最小显著差法的简称Lurking variable, 潜在变量Main effect, 主效应Major heading, 主辞标目Marginal density function, 边缘密度函数Marginal probability, 边缘概率Marginal probability distribution, 边缘概率分布Matched data, 配对资料Matched distribution, 匹配过分布Matching of distribution, 分布的匹配Matching of transformation, 变换的匹配Mathematical expectation, 数学期望Mathematical model, 数学模型Maximum L-estimator, 极大极小L 估计量Maximum likelihood method, 最大似然法Mean, 均数Mean squares between groups, 组间均方Mean squares within group, 组内均方Means (Compare means), 均值-均值比较Median, 中位数Median effective dose, 半数效量Median lethal dose, 半数致死量Median polish, 中位数平滑Median test, 中位数检验Minimal sufficient statistic, 最小充分统计量Minimum distance estimation, 最小距离估计Minimum effective dose, 最小有效量Minimum lethal dose, 最小致死量Minimum variance estimator, 最小方差估计量MINITAB, 统计软件包Minor heading, 宾词标目Missing data, 缺失值Model specification, 模型的确定Modeling Statistics , 模型统计Models for outliers, 离群值模型Modifying the model, 模型的修正Modulus of continuity, 连续性模Morbidity, 发病率Most favorable configuration, 最有利构形MSC(多元散射校正)Multidimensional Scaling (ASCAL), 多维尺度/多维标度Multinomial Logistic Regression , 多项逻辑斯蒂回归Multiple comparison, 多重比较Multiple correlation , 复相关Multiple covariance, 多元协方差Multiple linear regression, 多元线性回归Multiple response , 多重选项Multiple solutions, 多解Multiplication theorem, 乘法定理Multiresponse, 多元响应Multi-stage sampling, 多阶段抽样Multivariate T distribution, 多元T分布Mutual exclusive, 互不相容Mutual independence, 互相独立Natural boundary, 自然边界Natural dead, 自然死亡Natural zero, 自然零Negative correlation, 负相关Negative linear correlation, 负线性相关Negatively skewed, 负偏Newman-Keuls method, q检验NK method, q检验No statistical significance, 无统计意义Nominal variable, 名义变量Nonconstancy of variability, 变异的非定常性Nonlinear regression, 非线性相关Nonparametric statistics, 非参数统计Nonparametric test, 非参数检验Nonparametric tests, 非参数检验Normal deviate, 正态离差Normal distribution, 正态分布Normal equation, 正规方程组Normal P-P, 正态概率分布图Normal Q-Q, 正态概率单位分布图Normal ranges, 正常范围Normal value, 正常值Normalization 归一化Nuisance parameter, 多余参数/讨厌参数Null hypothesis, 无效假设Numerical variable, 数值变量Objective function, 目标函数Observation unit, 观察单位Observed value, 观察值One sided test, 单侧检验One-way analysis of variance, 单因素方差分析Oneway ANOVA , 单因素方差分析Open sequential trial, 开放型序贯设计Optrim, 优切尾Optrim efficiency, 优切尾效率Order statistics, 顺序统计量Ordered categories, 有序分类Ordinal logistic regression , 序数逻辑斯蒂回归Ordinal variable, 有序变量Orthogonal basis, 正交基Orthogonal design, 正交试验设计Orthogonality conditions, 正交条件ORTHOPLAN, 正交设计Outlier cutoffs, 离群值截断点Outliers, 极端值OVERALS , 多组变量的非线性正规相关Overshoot, 迭代过度Paired design, 配对设计Paired sample, 配对样本Pairwise slopes, 成对斜率Parabola, 抛物线Parallel tests, 平行试验Parameter, 参数Parametric statistics, 参数统计Parametric test, 参数检验Pareto, 直条构成线图(又称佩尔托图)Partial correlation, 偏相关Partial regression, 偏回归Partial sorting, 偏排序Partials residuals, 偏残差Pattern, 模式PCA(主成分分析)Pearson curves, 皮尔逊曲线Peeling, 退层Percent bar graph, 百分条形图Percentage, 百分比Percentile, 百分位数Percentile curves, 百分位曲线Periodicity, 周期性Permutation, 排列P-estimator, P估计量Pie graph, 构成图,饼图Pitman estimator, 皮特曼估计量Pivot, 枢轴量Planar, 平坦Planar assumption, 平面的假设PLANCARDS, 生成试验的计划卡PLS(偏最小二乘法)Point estimation, 点估计Poisson distribution, 泊松分布Polishing, 平滑Polled standard deviation, 合并标准差Polled variance, 合并方差Polygon, 多边图Polynomial, 多项式Polynomial curve, 多项式曲线Population, 总体Population attributable risk, 人群归因危险度Positive correlation, 正相关Positively skewed, 正偏Posterior distribution, 后验分布Power of a test, 检验效能Precision, 精密度Predicted value, 预测值Preliminary analysis, 预备性分析Principal axis factoring,主轴因子法Principal component analysis, 主成分分析Prior distribution, 先验分布Prior probability, 先验概率Probabilistic model, 概率模型probability, 概率Probability density, 概率密度Product moment, 乘积矩/协方差Profile trace, 截面迹图Proportion, 比/构成比Proportion allocation in stratified random sampling, 按比例分层随机抽样Proportionate, 成比例Proportionate sub-class numbers, 成比例次级组含量Prospective study, 前瞻性调查Proximities, 亲近性Pseudo F test, 近似F检验Pseudo model, 近似模型Pseudosigma, 伪标准差Purposive sampling, 有目的抽样QR decomposition, QR分解Quadratic approximation, 二次近似Qualitative classification, 属性分类Qualitative method, 定性方法Quantile-quantile plot, 分位数-分位数图/Q-Q图Quantitative analysis, 定量分析Quartile, 四分位数Quick Cluster, 快速聚类Radix sort, 基数排序Random allocation, 随机化分组Random blocks design, 随机区组设计Random event, 随机事件Randomization, 随机化Range, 极差/全距Rank correlation, 等级相关Rank sum test, 秩和检验Rank test, 秩检验Ranked data, 等级资料Rate, 比率Ratio, 比例Raw data, 原始资料Raw residual, 原始残差Rayleigh's test, 雷氏检验Rayleigh's Z, 雷氏Z值Reciprocal, 倒数Reciprocal transformation, 倒数变换Recording, 记录Redescending estimators, 回降估计量Reducing dimensions, 降维Re-expression, 重新表达Reference set, 标准组Region of acceptance, 接受域Regression coefficient, 回归系数Regression sum of square, 回归平方和Rejection point, 拒绝点Relative dispersion, 相对离散度Relative number, 相对数Reliability, 可靠性Reparametrization, 重新设置参数Replication, 重复Report Summaries, 报告摘要Residual sum of square, 剩余平方和residual variance (剩余方差)Resistance, 耐抗性Resistant line, 耐抗线Resistant technique, 耐抗技术R-estimator of location, 位置R估计量R-estimator of scale, 尺度R估计量Retrospective study, 回顾性调查Ridge trace, 岭迹Ridit analysis, Ridit分析Rotation, 旋转Rounding, 舍入Row, 行Row effects, 行效应Row factor, 行因素RXC table, RXC表Sample, 样本Sample regression coefficient, 样本回归系数Sample size, 样本量Sample standard deviation, 样本标准差Sampling error, 抽样误差SAS(Statistical analysis system ), SAS统计软件包Scale, 尺度/量表Scatter diagram, 散点图Schematic plot, 示意图/简图Score test, 计分检验Screening, 筛检SEASON, 季节分析Second derivative, 二阶导数Second principal component, 第二主成分SEM (Structural equation modeling), 结构化方程模型Semi-logarithmic graph, 半对数图Semi-logarithmic paper, 半对数格纸Sensitivity curve, 敏感度曲线Sequential analysis, 贯序分析Sequence, 普通序列图Sequential data set, 顺序数据集Sequential design, 贯序设计Sequential method, 贯序法Sequential test, 贯序检验法Serial tests, 系列试验Short-cut method, 简捷法Sigmoid curve, S形曲线Sign function, 正负号函数Sign test, 符号检验Signed rank, 符号秩Significant Level, 显著水平Significance test, 显著性检验Significant figure, 有效数字Simple cluster sampling, 简单整群抽样Simple correlation, 简单相关Simple random sampling, 简单随机抽样Simple regression, 简单回归simple table, 简单表Sine estimator, 正弦估计量Single-valued estimate, 单值估计Singular matrix, 奇异矩阵Skewed distribution, 偏斜分布Skewness, 偏度Slash distribution, 斜线分布Slope, 斜率Smirnov test, 斯米尔诺夫检验Source of variation, 变异来源Spearman rank correlation, 斯皮尔曼等级相关Specific factor, 特殊因子Specific factor variance, 特殊因子方差Spectra , 频谱Spherical distribution, 球型正态分布Spread, 展布SPSS(Statistical package for the social science), SPSS统计软件包Spurious correlation, 假性相关Square root transformation, 平方根变换Stabilizing variance, 稳定方差Standard deviation, 标准差Standard error, 标准误Standard error of difference, 差别的标准误Standard error of estimate, 标准估计误差Standard error of rate, 率的标准误Standard normal distribution, 标准正态分布Standardization, 标准化Starting value, 起始值Statistic, 统计量Statistical control, 统计控制Statistical graph, 统计图Statistical inference, 统计推断Statistical table, 统计表Steepest descent, 最速下降法Stem and leaf display, 茎叶图Step factor, 步长因子Stepwise regression, 逐步回归Storage, 存Strata, 层(复数)Stratified sampling, 分层抽样Stratified sampling, 分层抽样Strength, 强度Stringency, 严密性Structural relationship, 结构关系Studentized residual, 学生化残差/t化残差Sub-class numbers, 次级组含量Subdividing, 分割Sufficient statistic, 充分统计量Sum of products, 积和Sum of squares, 离差平方和Sum of squares about regression, 回归平方和Sum of squares between groups, 组间平方和Sum of squares of partial regression, 偏回归平方和Sure event, 必然事件Survey, 调查Survival, 生存分析Survival rate, 生存率Suspended root gram, 悬吊根图Symmetry, 对称Systematic error, 系统误差Systematic sampling, 系统抽样Tags, 标签Tail area, 尾部面积Tail length, 尾长Tail weight, 尾重Tangent line, 切线Target distribution, 目标分布Taylor series, 泰勒级数Test(检验)Test of linearity, 线性检验Tendency of dispersion, 离散趋势。
几种常见的概率模型及应用
几种常见的概率模型及应用Common Probability Models and Their Applications.Probability models are mathematical representations of random phenomena that allow us to make predictions and inferences about future events. They are widely used in various fields, including statistics, machine learning, finance, and biology. Here are some of the most commonly used probability models and their applications:1. Binomial Model.The binomial model describes the probability of success in a sequence of independent trials, each of which has a constant probability of success. It is commonly used in situations where we are interested in the number of successes in a fixed number of trials, such as:Counting the number of defective items in a batch of production.Predicting the number of customers visiting a store in a particular day.Estimating the probability of winning a lottery.2. Poisson Model.The Poisson model describes the probability of observing a random number of events occurring over a fixed period of time or distance. It is often used in situations where the occurrence of events is rare and independent of each other, such as:Modeling the number of phone calls received by a call center in an hour.Estimating the number of accidents on a particular highway per week.Predicting the number of mutations in a DNA sequence.3. Normal Distribution.The normal distribution, also known as the Gaussian distribution, is a continuous probability distribution that describes the distribution of continuous variables that are normally distributed, such as:Heights of individuals.Weights of products.Test scores of students.It is widely used in statistical inference, hypothesis testing, and estimation of population parameters.4. Exponential Distribution.The exponential distribution is a continuousprobability distribution that describes the waiting time between events that occur randomly and independently at a constant rate. It is commonly used in situations where thetime between events is of interest, such as:Modeling the time between arrivals of customers in a queue.Estimating the time to failure of a machine.Predicting the lifespan of a light bulb.5. Markov Models.Markov models are a class of stochastic processes that describe the evolution of a system over time. They are defined by the current state of the system and the probability of transitioning to each possible next state. Markov models are widely used in various applications, such as:Modeling speech and language recognition.Simulating financial markets.Predicting customer behavior.中文回答:常见的概率模型及其应用。
7 heteroscedasticity
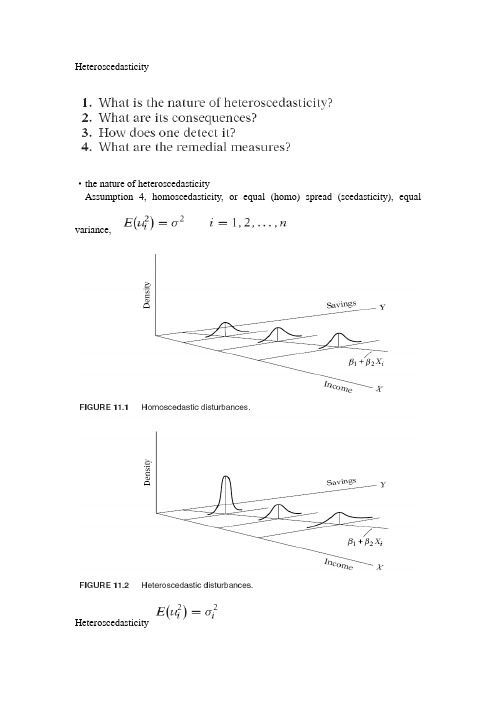
Heteroscedasticity·the nature of heteroscedasticityAssumption 4, homoscedasticity, or equal (homo) spread (scedasticity), equal variance,HeteroscedasticityReasons why the varicances of disturbances may be variable:1.The error-learning models2.discretionary income(备用收入),fig 11.2, saving and income3.data collecting techniques4.outliers5.being without correctly specified6.skewness7.other sources: incorrect data transformation, incorrect functional formnote: heteroscedasticity is likely to more common in cross-sectional than in time series data.·OLS estimation in the presence of heteroscedasticityExample, two-variables regression,(1)the estimator is linear and unbiased, consistent estimator and asymptoticallynormally distributed(2)the estimator is not efficient or best·the method of generalized least squares(GLS)Idea: observations coming from populations with greater variability are given less weight than those coming from populations with smaller variability.Generalized Least Squares(GLS)GLS is OLS on the transformed variables that satisfy the standard least-squares assumptions.Difference between OLS and GLS·consequences of using ols in the presence of heteroscedasticityOLS estimation allowing for heteroscedasticityOLS estimation disregarding heteroscedasticityIf we persist in using the usual testing procedures despite heteroscedasticity, whatever conclusions we draw or inferences we make may be very misleading. Monte carlo study·detection of heteroscedasticityInformal methodsNature of the problem: using priori or empirical informationGraphical method:Formal method:Park test(graphic method)帕克检验Functional form:Hypothesis test: is significantly different to 0? Yes, heteroscedasicity, No, homo- Problem: is heteroscedasticGlejser test(similar to Park test)格莱泽检验First step: OLS obtain the residualsSecond step: following regressionsThird step: significant test(t test)Problems: expected value is nonzero, correlated and heteroscedastic, and non-linear in parametersSpearman’s rank correlation testGoldfeld-Quandt Test(格的菲尔德,匡特检验)Applicant situations: heteroscedastic variance is positively related to one of the explanatory variablesTest stepsNote:(1)c sharpen or accentuate the difference between the two groupsN=30, c=8; n=60, c=16410(2)ranking according any one of the XExample: consumption and incomeDropping the middle 4 observations and run OLS, significant, there is heteroscedasticityBreusch-Pagan-Godfrey Test(布劳殊,培干,戈弗雷检验)C and Correct X ranking for the above testHomoscedastic test StepsExample1%, critical value 6.6349; 5%, critical value,3.8414 White’s general heteroscedasticity testExampleWhite’s heteroscedasticity testKoenker-Bassett(KB) test 寇因特巴塞特检验·remedial measuresWeighted least squaresExampleWhite’s heteroscedasticity-consistent variances and standard error(robust standard errors, consistent estimator)Plausible assumptions about heteroscedasticity patternWhite procedure less efficient then the methods that transform data to reflect specificExampletypes of heteroscedasticityStep one, OLS disregarding the heteroscedasicity,Step two,·concluding examplesExample 11.9Child mortalityResidual from regressionParke testGlejser testWhite testExampleR&D expenditure, sales, and profits in 18 industry groupings in the united states, 1988Figure 11.13It seems from this figure that there is a systematic pattern between the residuals and squared residuals and sales.Parke testGlejser testWhite testFrom residual graphs, error variance is proportional to sales, the square root transformationWhite’s heteroscedasticity-consistent standard errors。
计量经济学(英文)重点知识点考试必备

第一章1. Econo metrics (计量经济学):the social scie nee in which the tools of econo mic theory, mathematics, and statistical inference are applied to the an alysis of econo mic phe nomena.the result of a certain outlook on the role of economics, consists of the application of mathematical statistics to econo mic data to lend empirical support to the models con structed by mathematical econo mics and to obta in nu merical results.2. Econo metric an alysis proceeds along the followi ng lines计量经济学分析步骤1)Creat ing a stateme nt of theory or hypothesi建立一个理论假说2)Collecting data.收集数据3)Specify ing the mathematical model of theory 设定数学模型4)Specify ing the statistical, or econo metric, model of theory设立统计或经济计量模型5)Estimati ng the parameters of the chose n econo metric mod估计经济计量模型参数6)Check ing for model adequacy : Model specificati on test ing 核查模型的适用性:模型设定检验7)Testi ng the hypothesis derived from the mode检验自模型的假设8)Using the model for prediction or forecasting禾U用模型进行预测Step2:收集数据Three types of data三类可用于分析的数据1)Time series(时间序歹U数据):Collected over a period of time, are collected at regular in tervals.按时间跨度收集得到2)Cross-sectional截面数据:Collected over a period of time, are collected at regular in tervals.按时间跨度收集得到3)Pooled data合并数据(上两种的结合)Step3:设定数学模型1. plot scatter diagram or scattergram2. write the mathematical modelStep4:设立统计或经济计量模型CLFPR is depe nde nt variable应变量CUNR is in depe nde nt or expla natory variable独立或解释变量(自变量)We give a catchall variable U to stand for all these neglected factorsIn lin ear regressi on an alysis our primary objective is to expla in the behavior of the depe ndent variable in relati on to the behavior of one or more other variables, allowi ng for the data that the relati on ship betwee n them is in exacts 性回归分析的主要目标就是解释一个变量(应变量)与其他一个或多个变量(自变量)只见的行为关系,当然这种关系并非完全正确Step5:估计经济计量模型参数In short, the estimated regressi on line gives the relati on ship betwee n average CLFPR and CUNR简言之,估计的回归直线给出了平均应变量和自变量之间的关系That is, on average, how the depe ndent variable resp onds to a unit cha nge in the in depe nde nt variable单位因变量的变化引起的自变量平均变化量的多少。
什么是预测Prediction
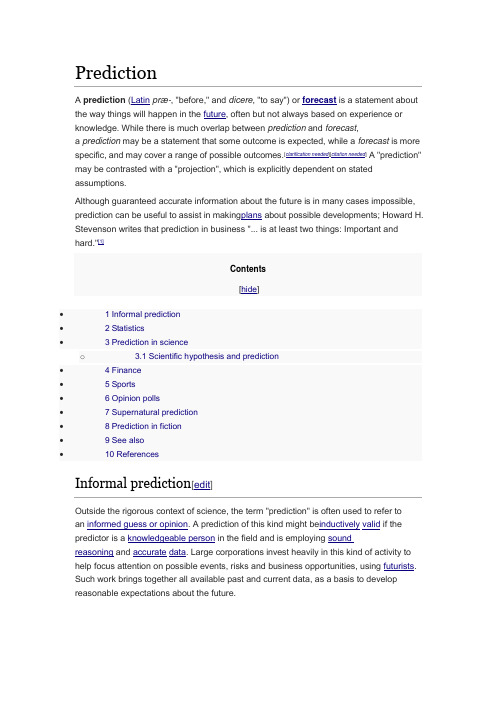
Prediction∙ 1 Informal prediction∙ 2 Statistics∙ 3 Prediction in scienceo 3.1 Scientific hypothesis and prediction ∙ 4 Finance∙ 5 Sports∙ 6 Opinion polls∙7 Supernatural prediction∙8 Prediction in fiction∙9 See also∙10 ReferencesThis sectionrequires expansion. (December 2009)dependent variable are input to the parameterized function to generate predictions for the dependent variable.Before finding a mathematical relationship between the variables, one must decide what series of data to compare. Here big data multiply the areas explored[clarification needed] and improve the chances of finding correlations between phenomena between which no connection was suspected before.NASA's 2004 predictions of the solar cycle, which were inaccurate (predicting that solar cycle 24would start in 2007 and be larger than cycle 23), and the refined predictions in 2012.Prediction marketMathematical models of stock market behaviour (and economic behaviour in general) are also unreliable in predicting future behaviour. Among other reasons, this is because economic events may span several years, and the world is changing over a similar timePredicting the outcome of sporting events is a business which has grown in popularity in recent years. Handicappers predict the outcome of games using a variety of mathematical formulas, simulation models or qualitative analysis. Early, well known sports bettors, such as Jimmy the Greek, were believed to have access to information that gave them an edge. Information ranged from personal issues, such as gambling or drinking to undisclosed injuries; anything that may affect the performance of a player on the field.Recent times have changed the way sports are predicted. Predictions now typically consist of two distinct approaches: Situational plays and statistical based models. Situational plays are much more difficult to measure because they usually involve the motivation of a team. Dan Gordon, noted handicapper, wrote ―Without an emotional edge in a game in addition to value in a line, I won’t put my money on it‖.[8] These types of plays consist of: Betting on the home underdog, betting against Monday Night winners if they are a favorite next week, betting the underdog in ―look ahead‖ games etc. As situational plays become more widely known they become less useful because they will impact the way the line is set.The widespread use of technology has brought with it more modern sports betting systems. These systems are typically algorithms and simulation models basedon regression analysis. Jeff Sagarin, a sports statistician, has brought attention to sports by having the results of his models published in USA Today. He is currently paid as a consultant by the Dallas Mavericks for his advice on lineups and the use of his Winval system, which evaluates free agents. Brian Burke, a former Navy fighter pilot turnedsports statistician, has published his results of using regression analysis to predict the outcome of NFL games.[9]Ken Pomeroy is widely accepted as a leading authority on college basketball statistics. His website includes his College Basketball Ratings, a tempo based statistics system. Some statisticians have become very famous for having successful prediction systems. Dare wrote ―the effective odds for sports betting and horse racing are a direct result of human decisions and can therefore potentially exhibit consistent error‖.[10] Unlike other games offered in a casino, prediction in sporting events can be both logical and consistent.Nowadays sport betting is a huge business; there are many websites (systems) alongside betting sites, which give tips or predictions for future games. Some of these prediction websites (tipsters) are based on human predictions, but others on computer software sometimes called prediction robots or bots. Prediction bots can use different amount of data and algorithms and because of that their accuracy may vary.Fiction (especially fantasy, forecasting and science fiction) often features instances of prediction achieved by unconventional means.。
常用显著性检验
常用显著性检验1.t检验适用于计量资料、正态分布、方差具有齐性的两组间小样本比拟。
包括配对资料间、样本与均数间、两样本均数间比拟三种,三者的计算公式不能混淆。
2.t'检验应用条件与t检验大致一样,但t′检验用于两组间方差不齐时,t′检验的计算公式实际上是方差不齐时t检验的校正公式。
3.U检验应用条件与t检验根本一致,只是当大样本时用U检验,而小样本时那么用t检验,t检验可以代替U检验。
4.方差分析用于正态分布、方差齐性的多组间计量比拟。
常见的有单因素分组的多样本均数比拟与双因素分组的多个样本均数的比拟,方差分析首先是比拟各组间总的差异,如总差异有显著性,再进展组间的两两比拟,组间比拟用q检验或LST检验等。
5.X2检验是计数资料主要的显著性检验方法。
用于两个或多个百分比(率)的比拟。
常见以下几种情况:四格表资料、配对资料、多于2行*2列资料与组分组X2检验。
6.零反响检验用于计数资料。
是当实验组或对照组中出现概率为0或100%时,X2检验的一种特殊形式。
属于直接概率计算法。
7.符号检验、秩和检验和Ridit检验三者均属非参数统计方法,共同特点是简便、快捷、实用。
可用于各种非正态分布的资料、未知分布资料与半定量资料的分析。
其主要缺点是容易丢失数据中包含的信息。
所以但凡正态分布或可通过数据转换成正态分布者尽量不用这些方法。
8.Hotelling检验用于计量资料、正态分布、两组间多项指标的综合差异显著性检验。
计量经济学检验方法讨论计量经济学中的检验方法多种多样,而且在不同的假设前提之下,使用的检验统计量不同,在这里我论述几种比拟常见的方法。
在讨论不同的检验之前,我们必须知道为什么要检验,到底检验什么?如果这个问题都不知道,那么我觉得我们很荒谬或者说是很模式化。
检验的含义是要确实因果关系,计量经济学的核心是要说因果关系是怎么样的。
那么如果两个东西之间没有什么因果联系,那么我们寻找的原因就不对。
那么这样的结果是没有什么意义的,或者说是意义不大的。
斯托克、沃森着《计量经济学》第五章
Chapter 5. Regression with a Single Regressor: Hypothesis Tests and Confidence Intervals5.1 Testing Hypotheses about One of the Regression Coefficients(对单一系数的假设检验)Suppose a skeptic suggests that reducing the number of students in a class has no effect on learning or, specifically, test scores. The skeptic thus asserts the hypothesis,1H0: β1 = 0We wish to test this hypothesis using data – reach a tentative conclusion whether it is correct or incorrect.Null hypothesis and two-sided alternative:H0: β1 = 0 vs. H1: β1≠ 0or, more generally,2H0: β1 = β1,0 vs. H1: β1≠β1,0where β1,0 is the hypothesized value under the null(β1,0是一个具体的数).Null hypothesis and one-sided alternative:H0: β1 = β1,0 vs. H1: β1 < β1,0In economics, it is almost always possible to come up with stories in which an effect could “go either way,” so it is34standard to focus on two-sided alternatives.Recall hypothesis testing for population mean using Y :t=Y μ−then reject the null hypothesis if |t | >1.96.where the SE of the estimator is the square root of an estimator of the variance of the estimator.Applied to a hypothesis about β1:t = estimator - hypothesized value standard error of the estimator56sot = 11,01ˆˆ()SE βββ−where β1 is the value of β1,0 hypothesized under the null (for example, if the null value is zero, then β1,0 = 0.What is SE (1ˆβ)? SE (1ˆβ) = the square root of an estimator of the variance7of the sampling distribution of 1ˆβRecall the expression for the variance of 1ˆβ (large n ):var(1ˆβ) = 22var[()]()i X i X X u n μσ− = 24v Xn σσwhere v i = (X i –X )u i . Estimator of the variance of 1ˆβ:812ˆˆβσ = 2221estimator of (estimator of )v Xn σσ× = 2212211ˆ()121()ni i i n i i X X u n n X X n ==−−×⎡⎤−⎢⎥⎣⎦∑∑.OK, this is a bit nasty, but:• There is no reason to memorize this• It is computed automatically by regression software• SE (1ˆβis reported by regression software9• It is less complicated than it seems. The numerator estimates the var(v ), the denominator estimates var(X )2.Return to calculation of the t -statsitic:t = 11,01ˆˆ()SE βββ− =11,0ˆββ−• Reject at 5% significance level if |t| > 1.96•p-value is p = P(|t| > |t act|) = probability in tails of normal outside |t act|•Both the previous statements are based on large-n approximation; typically n = 50 is large enough for the approximation to be excellent.1011 Example: Test Scores and STR , California dataEstimated regression line: n TestScore = 698.9 – 2.28×STRRegression software reports the standard errors:SE (0ˆβ) = 10.4 SE (1ˆβ) = 0.52t -statistic testing “β1,0 = 0” = 11,01ˆˆ()SE βββ− = 2.2800.52−− = –4.38•The 1% 2-sided significance level is 2.58, so we reject the null at the 1% significance level.•Alternatively, we can compute the p-value. You can do this easily in Stata:. di normal(-4.38)*2. 00001187注:在Stata中,normal表示标准正态分布的cdf。
计量经济学中英文词汇对照
Common variance Common variation Communality variance Comparability Comparison of bathes Comparison value Compartment model Compassion Complement of an event Complete association Complete dissociation Complete statistics Completely randomized design Composite event Composite events Concavity Conditional expectation Conditional likelihood Conditional probability Conditionally linear Confidence interval Confidence limit Confidence lower limit Confidence upper limit Confirmatory Factor Analysis Confirmatory research Confounding factor Conjoint Consistency Consistency check Consistent asymptotically normal estimate Consistent estimate Constrained nonlinear regression Constraint Contaminated distribution Contaminated Gausssian Contaminated normal distribution Contamination Contamination model Contingency table Contour Contribution rate Control
概率与测度论经典专著
概率与测度论;数理统计;随机过程微积分金融经典教材专著下面的当然不可能都看,Some books on the list of references might be to your taste. 每个方向认真看1,2本就行,其他的只是做参考,看看一些章节就行。
本书单中为什么要列出各种语言的书,只看中文书或者英文书行吗?(答:例如陈景润为了能直接阅读外国资料,掌握最新信息,在继续学习英语的同时,又攻读了俄语、德语、法语、日语、意大利语和西班牙语。
)非数学专业本科生概率统计随机过程概率论与数理统计(第4版) 盛骤考研必备概率论与数理统计教程(第2版) 茆诗松概率论与数理统计陈希孺概率论基础教程(第8版) 罗斯、郑忠国译(已经出第9版,也是最后一版)第7版答案/p-109941348.html概率论与数理统计(第3版改编版) 德格奥特、谢尔维斯概率统计(英文版第4版)德格鲁特、舍维什概率与统计(英文版)Ronald E.Walpole;Raymond H.Myers;Sharon L.Myers;Keying Ye概率论(英文版) 皮特曼应用随机过程:概率模型导论(第10版) 罗斯、龚光鲁译概率、统计与随机过程(第4版)(英文版) 亨利斯塔克(Henry Stark)、Schaum's Outlines - Probability, Random Variables And Random ProcessesSchaum's Easy Outline of Probability and Statistics.Schaum's Outline of Beginning Statistics, 2 EditionSchaum's Outlines - Elements of Statistics I - Descriptive Statistics and Probability Schaum's Outlines - Elements of Statistics II - Inferential StatisticsApplied Multivariate Statistical Analysis (6th Ed)RICHARD A. JOHNSONMultivariate Data Analysis (7th Edition) Joseph F. Hair, William C. Black, Barry J. Babin, Rolph E. AndersonA Modern Introduction to Probability and Statistics_Understanding Why and How Dekking Chris Spatz, "Basic Statistics: Tales of Distributions (10th edition)"Basic Concepts of Probability and Statistics (Classics in Applied Mathematics) by J. L. Hodges Jr and E. L. Lehmann (Jan 11, 2005)Modern Mathematical Statistics with Applications (Springer Texts in Statistics) by Jay L. Devore and Kenneth N. Berk (8 Dec 2011)A Course in Mathematical Statistics, Third Edition, Third Edition by George G. Roussas (Feb 15, 2014)辅导书概率论与数理统计教程:习题与解答(第2版) 茆诗松概率论与数理统计习题全解指南(浙大•第4版) 盛骤Schaum's Outline of Theory and Problems of Probability and Statistics应用统计学Elements of Statistics 6ed,Arthur L Bowley 世界上第一本统计学教材 1911统计学,David Freedman等著,魏宗舒,施锡铨等译中国统计出版社(据说是统计思想讲得最好的一本书,读了部分章节,受益很多。