Reliability Standards for the Northwest Power System
电力系统继电保护(英文简介)

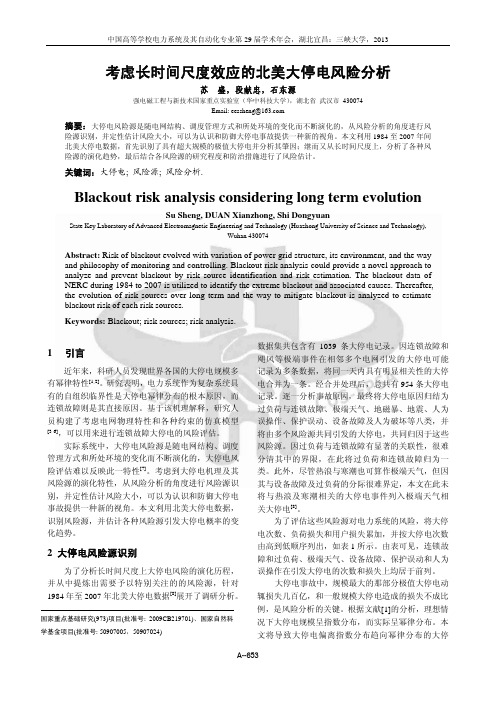
The number of faults The percentag e of fault
38
2196
45
0.83%
4.49%
1.58%
91.23%
1.86%
Chinese 220kV power transmission line fault statistics in 2008
Basic Principles and Elements of Relay Protection
use electricity
Electrical equivalent model
Power station Turbine Generator Substation boosting transformer
Substation step-down transformer
Load
Reservoir
Logic circuits
Operation circuit
Tripping signal
The block diagram of relay protection device
The requirement of relay protection
A QF1 B QF2 QF5 C QF6 k1 D
S k S k max U imin U i U k max I ij I ijmax f min f f max
Abnormal Operation Condition
Over voltage low voltage
Overload The common abnormal state
NARI RCS-900 line protection device
A-653_考虑长时间尺度效应的北美大停电风险分析
考虑长时间尺度效应的北美大停电风险分析苏盛,段献忠,石东源强电磁工程与新技术国家重点实验室(华中科技大学),湖北省武汉市 430074Email: eessheng@摘要:大停电风险源是随电网结构、调度管理方式和所处环境的变化而不断演化的,从风险分析的角度进行风险源识别,并定性估计风险大小,可以为认识和防御大停电事故提供一种新的视角。
本文利用1984至2007年间北美大停电数据,首先识别了具有超大规模的极值大停电并分析其肇因;继而又从长时间尺度上,分析了各种风险源的演化趋势,最后结合各风险源的研究程度和防治措施进行了风险估计。
关键词:大停电; 风险源; 风险分析.Blackout risk analysis considering long term evolutionSu Sheng, DUAN Xianzhong, Shi DongyuanState Key Laboratory of Advanced Electromagnetic Engineering and Technology (Huazhong University of Science and Technology),Wuhan 430074Abstract:Risk of blackout evolved with variation of power grid structure, its environment, and the way and philosophy of monitoring and controlling. Blackout risk analysis could provide a novel approach to analyze and prevent blackout by risk source identification and risk estimation. The blackout data of NERC during 1984 to 2007 is utilized to identify the extreme blackout and associated causes. Thereafter, the evolution of risk sources over long term and the way to mitigate blackout is analyzed to estimate blackout risk of each risk sources.Keywords: Blackout; risk sources; risk analysis.1 引言近年来,科研人员发现世界各国的大停电规模多有幂律特性[1,2]。
交流防跳回路工程实用设计方案
第34卷第24期继电器V ol.34 No.24 2006年12月16日RELAY Dec.16, 2006交流防跳回路工程实用设计方案翟晓满1,杨仁刚1,李忠有 2(1.中国农业大学信息与电气工程学院,北京 100083;2.施耐德电气(中国)投资有限公司,北京 100176)摘要:断路器操作回路中设计防跳回路可有效防止断路器多次跳合,保证断路器的安全运行。
大部分变电所(站)都配备直流供电系统,经典直流防跳回路在实践中显示了较高的可靠性。
但在不设直流供电系统的小型变电站(所)自动化改造中,生搬硬套经典直流防跳回路设计方案会造成防跳回路动作异常,甚至影响断路器的正常动作。
为了完成微机保护装置与断路器交流操作回路的配合,提出了一种简单可靠的断路器交流操作回路防跳设计方案,并给出了进一步的改进方案。
上述方案不仅在设计思路上有其合理性,通过工程实践也证实了它的正确性和可靠性。
关键词:电力系统;电网改造;交流系统;防跳回路An actual application design of anti-breaker leaping circuit in alternate current supply systemZHAI Xiao-man1,YANG Ren-gang1,LI Zhong-you2(1.China Agricultural University, Beijing 100083, China;2.Schneider Electric(China), Beijing 100176, China)Abstract: The design of anti-breaker leaping circuit can prevent breaker abnormally jumping to ensure the safe operation of the breaker. Most substation (stations) are equipped with DC power supply systems. Classic anti-breaker leaping circuit in practice demonstrated high reliability. However, in small substation without DC Power Supply System, classic circuit design will cause abnormal movements and even affect the normal operation of breakers. This paper presents a simple and reliable operation of anti-breaker leaping circuit to substitute the old one,and gives a further improvement program. These programs are not only reasonable in their designs, but also have been proved to be of validity and reliability in engineering practice.Key words: power system; reconstruction of electrical net; AC supply system; anti-breaker leaping circuit中图分类号:TM64 文献标识码: B 文章编号: 1003-4897(2006)24-0060-02 0 引言为了让广大人民群众无论生活在山区还是平原,戈壁还是在海岛,都能用上可靠、合格的电力,农网改造不断深入进行,全国范围内所有低压线路势必将得到逐步改造。
外文文献翻译

外文原文:Transmission Capacity of Grid-Connecting Channel for the Second Phase of 3 GW Jiuquan Wind Power Base Project and Configuration of Its Reactive Power Compensation Equipments1 INTRODUCTIONWind power is the most mature and economic benefit is one of the best renewable energy generation technology.Wind power has the characteristics of intermittent and randomness, volatility, which determine the big changes in the wind power output is likely to make the power system voltage stability and frequency stability..With the rapid development of wind power generation technology and the national policy on renewable energy power generation, wind power construction in China has entered a rapid development period.Wind resources in China is rich, but is suitable for large-scale development of wind power in the region are generally in the end of the grid, because the power grid structure is relatively weak, therefore may arise after the large-scale wind power connected to the electricity grid power grid voltage levels drop, line transmission power beyond thermal stability limit the system short circuit capacity increase and the system transient stability change such as a series of problems。
【最新版】自动控制毕业论文中英文资料外文翻译文献

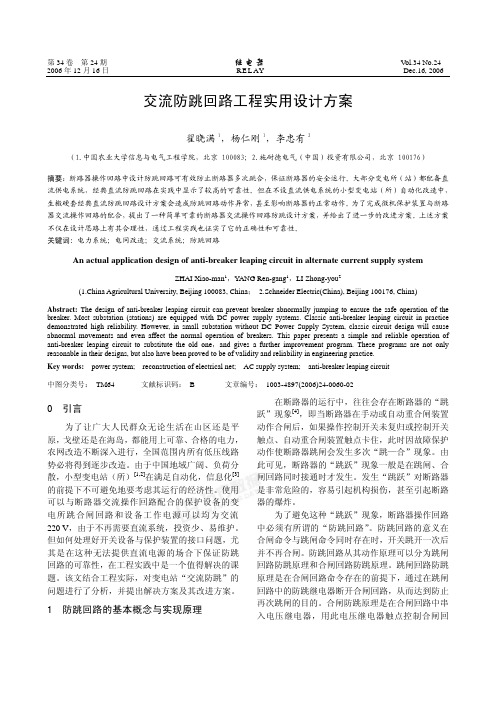
毕业论文外文译文学院自动化与电气工程学院专业自动控制Component-based Safety Computer of Railway SignalInterlocking System1 IntroductionSignal Interlocking System is the critical equipment which can guarantee traffic safety and enhance operational efficiency in railway transportation. For a long time, the core control computer adopts in interlocking system is the special customized Signal, and so on. Along with the rapid development of electronic technology, the customized safety computer is facing severe challenges, for instance, the the meantime, there are several explorations and practices about adopting open system architecture in avionics. The United Stated and Europe aerospace and other safety-critical fields. In recent years, it is gradually becoming a new trend that the utilization of standardized components in aerospace, industry, transportation and other safety-critical fields.2 Railways signal interlocking system2.1 Functions of signal interlocking systemThe basic function of signal interlocking system is to protect train safety by controlling signal equipments, such as switch points, signals and track units in a station, and it interlocking regulation.Since the birth of the railway transportation, signal interlocking system computer-based Interlocking System.2.2 Architecture of signal interlocking systemGenerally, the Interlocking System of equipments, the system can be divided to the function of equipments; the system can be divided into three layers as shown in figure1.Man-Machine Interface layerInterlocking safety layerImplementation layerOutdoorequiptmentsFigure 1 Architecture of Signal Interlocking System3 Component-based safety computer design3.1 Design strategyThe design concept of component-based safety critical computer is different from that of special customized computer. Our design strategy of SIC is on a base of fault-tolerance and system integration. We separate the SIC into three layers, the standardized component unit layer, safety software layer and the system layer. Different safety functions are allocated for each layer, and the final integration of the three layers ensures the predefined safety integrity level of the whole SIC. The three layers can be described as follows:(1) Component unit layer includes four independent standardized CPU modules. A this year.(2) Safety software layer mainly utilizes fail-safe strategy and fault-tolerant management. The interlocking safety computing of the whole system adopts two outputs from different CPU, it can mostly ensure the diversity of software to errors of signal version and remove risks.(3) System layer aims to improve reliability, availability and maintainability by means of redundancy.3.2 Design of in figure 2, the SIC of four independent component units (C11, C12, C21, C22). The fault-tolerant architecture adopts dual 2 vote 2 (2v2×2) structure, and a kind of selected as computing unit which adopts Intel X Scale kernel, 533 MHZ.The operation of SIC is based on a dual two-layer data buses. The protocol, and the low bus is Controller Area Network (CAN). C11、C12 and C21、C22 respectively make up of two safety computing components IC1 and IC2, which are of 2v2 structure. And each component external dynamic circuit watchdog that is set for computing supervision and switching.Diagnosis terminalC12C21C22&&Watchdog driver Fail-safe switchInput modle Output ModleInterfaceConsole C11High bus (Ether NET)Low bus (CAN)Figure 2 Hardware structure of SIC3.3 Standardized component unitAfter component module is made certain, according to the safety-critical requirements of railway signal interlocking system, we the module. The design includes power supply, interfaces and other embedded circuits.The fault-tolerant processing, synchronized computing, and fault diagnosis of SIC mostly depend on the safety software. Here the safety software design method is differing from that of the special computer too. For dedicated computer, the software is often specially designed based on the bare object, a special scheduling program is commonly designed as safety software for the computer, and not a universal operating system. The fault-tolerant processing and fault diagnosis of the dedicated computer are tightly a standard Linux OS.The safety software is vital element of secondary development. It includes Linux OS adjustment, fail-safe process, fault-tolerance management, and safety interlocking logic. The them are shown in Figure 4.Safety Interlock LogicFail-safe process Fault-tolerance management Linux OS adjustmentFigure 4 Safety software3.4.1 Fault-tolerant modelThe Fault-tolerant computation of SIC is of a multilevel model:SIC=F1002D(F2002(S c11,S c12),F2002(S c21,S c22))Firstly, basic computing unit Ci1 adopts one algorithm to complete the S Ci1, and Ci2 finishes the S Ci2 via a different algorithm, secondly 2 out of 2 (2oo2) safety computing component of SIC executes 2oo2 calculation and gets F SICi from the calculation results of S Ci1 S Ci2, and thirdly, according the states of watchdog and switch unit block, the result of SIC is gotten via a 1 out of 2 with diagnostics (1oo2D) calculation, which is based on F SIC1 and F SIC2.The flow of calculations is as follows:(1) S ci1=F ci1 (D net1,D net2,D di,D fss)(2) S ci2=F ci2 (D net1,D net2,D di,D fss)(3) F SICi=F2oo2 (S ci1, S ci2 ),(i=1,2)(4) SIC_OutPut=F1oo2D (F SIC1, F SIC2)3.4.2 Safety computationAs interlocking system consists of a fixed set of task, the computational model of SIC is task-based. In general, applications may conform to a time-triggered, event-triggered or mixed computational model. Here the time-triggered mode is selected, tasks are executed cyclically. The consistency of computing states between the two units is the foundation of SIC for ensuring safety and credibility. As SIC works under a loosely coupled mode, it is different from that of dedicated algorithm is necessary for SIC.SIC can be considered as a multiprocessor distributed system, and its computational model is essentially based on data comparing via . First, an analytical approach is used to confirm the worst-case response time of each task. To guarantee the deadline of tasks that communicate across the network, the access time and delay of communication medium is set to a fixed possible value. Moreover, the computational model must meets the real time requirements of railway interlocking system, within the system computing cycle, we set many check points P i(i=1,2,... n) , which are small enough for synchronization, and computation result voting is executed at each point. The safety computation flow of SIC is shown in Figure 5.S t a r tS t a r t0τ1τ2τ1P2P0τ1τ2τ1P2P0T0TC1i Ci 21T2T1T2T…………………n+1τn+1τn Pn Pn τn τclockclockS a f e t y f u n c t i o n sT a s k s o f i n t e r l o c k i n gl o g i ci :p:c h e c k p o i n tI n i t i a l i z e S y n c h r o n i z a t i o nG u a r a n t e e S y n c h r o n o u s T i m e t r i g g e rFigure 5 Safety computational model of SIC4. Hardware safety integrity level evaluation4.1 Safety IntegrityAs an authoritative international standard for safety-related system, IEC 61508 presents a definition of safety integrity: probability of a safety-related system satisfactorily performing the required safety functions under all the stated conditions within a stated period of time. In IEC 61508, there are four levels of safety integrity are prescribe, SIL1~SIL4. The SIL1 is the lowest, and SIL4 . The SIL of SIC can be evaluated via the probability of dangerous per of SIL about such system in IEC 61508, see table 1.Table 1-Safety Integrity levels: target failure measures for a safety function operating in Safety Integrity levelHigh demand or continuous mode of Operation (Probability of a dangerous Failure per hour)4 ≥10-9 to <10-8 3 ≥10-8 to <10-7 2 ≥10-7 to <10-6 1 ≥10-6 to <10-54.2 Reliability block diagram of SICAfter analyzing the structure and working principle of the SIC, we get the bockdiagram of reliability, as figure 6.2002200220022002NET1NET2NET1NET2λ=1×10⁻⁷DC=99%Voting=1002Dλ=1×10⁻⁷DC=99%Voting=1002Dλ=1×10Β=2%βD =1%DC=99% Voting=1002DHigh bus Logic subsystemLow busFigure 6 Block diagram of SIC reliability5. ConclusionsIn this paper, we proposed an available standardized component-based computer SIC. Railway signal interlocking is a fail-safe system with a required probability of less than 10-9 safety critical failures per order to meet the critical constraints, fault-tolerant architecture and safety tactics are used in SIC. Although the computational model and implementation techniques are rather complex, the philosophy of SIC provides a cheerful prospect to safety critical applications, it renders in a simpler style of shorten development cycle and reduce cost. SIC put into practical application, and proven.………………………………………………………………………………………………………From: ),取值很小,能实现同步,并且在每个检查点得出计算结果。
10 英文调节能量存储,以适应可变能源资源的高渗透

Abstract —The variability and non-dispatchable nature of wind and solar energy production presents substantial challenges for maintaining system balance. Depending on the economical considerations, energy storage can be a viable solution to balance energyproduction against its consumption. This paper proposesto use discrete Fourier transform (DFT) to decompose the required balancing power into different time-varying periodic components, i.e., intra-week, intra-day, intra-hour, and real-time. Each component can be used to quantify the maximum energy storage requirement for different types of energy storage. This maximumrequirement is the physical limit that could betheoretically accommodated by a power system. The actual energy storage capacity can be further quantified within this limit by the cost-benefit analysis (future work). The proposed approach has been successfully used in a study conducted for the 2030 Western Electricity Coordinating Council (WECC) system model.Some results of this study are provided in this paper.Index Terms —Imbalance power, energy storage, integration of variable resources, discrete Fourier transform, WECC System.I. I NTRODUCTIONigh penetrations of variable energy resourcescreate significant uncertainty in required powergeneration, needed to balance the energy productionagainst the consumption [1-2]. New technologies, suchas new wind and solar forecasting tools, demand-sidecontrol, fast start-up units, and many others have beenproposed to address this balancing issue [1]. Amongthose options, energy storage can be a viable solutionbecause of its fast response and control flexibility [3-4].A. Energy Storage as an Ancillary Service Resource Today, many electricity storage technologies, including pumped hydro, various batteries,Yuri V. Makarov, Michael C.W. Kintner-Meyer, Pengwei Du, and Chunlian Jin are with the Energy Science and Technology Division, Pacific Northwest National Laboratory, P.O. Box 999, MSIN: K5-20, Richland, WA - 99352, USA (e-mail: yuri.makarov@, michael.kintner-meyer@, pengwei.du@,chunlian.jin@). Howard F. Illian is with Energy Mark, Inc. 334 Satinwood Ct,. N.Buffalo Grove, Illinois, 60089 (email:howard.illian@).compressed air, flywheels, capacitors, and others are proposed or already used to control the grid [3-6]. Energy storage (ES) systems can be used to follow the net load changes, stabilize voltage and frequency, manage peak loads, improve power quality, and ultimately support renewable integration. A summary of performance requirements needed for a variety of energy storage applications can be found in [6]. Wind and solar power variations are hard to predict and cause multiple impacts including the impact on system reliability. To maintain balance betweengeneration and load, costly flexible generation resources that have sufficient start up time, ramping speed, and capacity may be employed. Alternatively, energy storage for periods from days to less than 1 hour can help to smooth out unpredicted power fluctuations. For the intra-hour variations, energy storage can provide essential ancillary services such as fast regulation and load following. This would have great advantages because fast regulation may be twice as effective as gas turbines and 20 times more effective than steam turbines [7]. Therefore, the short-term ES represents a new perspective class of ancillary service resource.The 2007 FERC 1Order No. 890 allows so-called “non-generation” resources like energy storage toparticipate in regulation markets on a non-discriminatory basis. Since then, new market ruleshave been developed by some Independent SystemOperators (ISOs). For example, the New York ISOalready started to support the integration of limitedenergy storage resources (LESR) [8].The balancing ancillary services represent anattractive business opportunity for ES. Numerousresearch and demonstration projects in this area have been planned or currently under development. Forexample, Beacon Power Corporation is constructing the grid-scale 20 MW flywheel plant in Stephentown, New York, in an attempt to provide approximately 10% of New York's overall frequency regulation needs. AES has tested an Altairnano lithium-titanatebattery (2MW/500kWh) in a pilot program with California ISO. Furthermore, the Department of Energy’s American Recovery and Reinvestment Act1FERC stands for Federal Energy Regulatory CommissionSizing Energy Storage to Accommodate High Penetration of Variable Energy ResourcesYuri V. Makarov, Michael C.W. Kintner-Meyer, Pengwei Du, Chunlian Jin, and Howard F. IllianH(ARRA) stimulus funding is sponsoring 37 projects with a combined value of 637 million dollars, which combine smart grid and energy storage functionality [9]. This will greatly accelerate the entrance of ES into the power grid, in particular, the module, distributed ES (e.g. community energy storage, plug-in hybrid electric vehicles). If modeled and controlled properly, these aggregated small-size ESs can provide the ancillary services cost-effectively. In view of these, it can be envisioned that ES will become more integral to the grid operation, and play a key role in providing ancillary service to enable a high penetration of wind power and other renewable resources [9].B. Sizing of Energy StorageAmong other characteristics, an energy storage can be characterized by its energy capacity (MWh), power capacity (MW), round-trip efficiency, and ramping capability. The capital cost of energy storage consists of an energy component ($/MWh) and a power component ($/MW). The former represents the cost of the storage medium, and the latter represents the cost associated with the power electronics. The current cost for energy storage is still relatively high. However, as mentioned above, several companies are exploring the competitiveness of their novel storage technologies in very specific high-value markets. These markets usually require short duration energy storage, which power output can be sustained at the rated power capacity level from 15 to 20 minutes. Longer duration energy storage (for over several hours or for a day) are generally pumped hydro or compressed air energy storage technologies, which generally are less flexible in their placement compared to battery or flywheel energy storage. Both from a transmission planning and technology development points of view it is of interest to estimate the total market size for different energy storage systems.In this context, the optimal operation and sizing of ES is a subject of intensive research work. Stochastic optimization has been proposed to find the optimal sizing of energy storage so as to maximize the expected operation profit (or minimize the cost) while taking into account transmission constraints [10-15]. In [16], battery energy storage (BES) is used in conjunction with a wind farm. The capacity of BES is determined to ensure constant dispatched power to the grid while the voltage level across the dc-link of the buffer is kept within preset limits. Some authors used probabilistic methods to model the operation of energy storage [6]. They evaluated two potential control strategies, i.e., the energy is released as soon as the local network can absorb it, or the energy is stored and is sold when the price of electricity is higher. The value of storage in relation to power rating and energy capacity was investigated so as to facilitate appropriate sizing. The BES storage device can be used to reinforce the dc bus during transients, thereby enhancing its low-voltage ride through capability. When properly sized, it can effectively damp short-term power oscillations, and provide superior transient performance over a number of seconds [17]. Using a BES unit to provide frequency regulation was discussed in [11].State-of-the-art ES models that would be appropriate for transmission and distribution uses were reviewed in [9]. They can be used for optimizing storage size for ancillary services.C. Need for Sizing Tools for Power Systems Planners This paper presents a novel perspective on the sizing issue of grid-scale ES for utilities which are concerned with the system flexibility characteristics needed to mitigate the volatility of wind and solar power. Essentially, the maximum size of ES can be decided upon the cycling components of the required balancing power. Previous research work conducted at the Pacific Northwest National Laboratory (PNNL) studied the capacity requirement of energy storage in WECC for year 20302[18]. The follow-up work reported in this paper aims at determining the maximum feasible size of energy storage by identifying different cycling components of the balancing power. This proposed approach does not use either production cost models or comprehensive storage models. It is based on the fact that an energy storage cycles energy within certain frequency range. For example, a flywheel can cycle energy 4 cycles per hour or even faster if the full energy capacity is used. To find the maximum cycling requirements at different frequencies, a frequency decomposition of the balancing power signal is used in the paper. The components of this decomposition are periodic signals with zero total energy, representing the cycling job for the energy storage. These periodic components also indicate the duration requirements for storage technologies. Ultimately an optimal allocation of storage technologies can be determined based on this cycling analysis.This paper is organized as follows. Section II discusses the basic methodology to decompose the 2 Internal PNNL study that estimated the technical potential of the energy storage for meeting new balancing requirements in the WECC for a 88 GW wind power scenario.balancing power using discrete Fourier transform (DFT). Section III presents the simulation results for the 2030 WECC system model. Section IV provides the final discussion and conclusions.II. D ECOMPOSITION OF B ALANCING P OWER U SINGDFTThe balancing process consists of several components, including scheduling, load following, andregulation. While the scheduling component usuallyreflect hourly dispatches of generation units providing most of the energy to the load, the load following and regulation components help to achieve intra-hour balance by covering the gap between the hourly schedules and minute-by-minute system load.A. Balancing Power The power system control objective is to minimize area control error (ACE) to the extent sufficient to comply with the North American Electric Reliability Corporation (NERC) Control Performance Standards (CPS). Therefore, regulation and load following signals are signals that oppose deviations of ACE from zero: ()10()a s a s ACE I I B F F -=--+- (1) where subscript a denotes actual, s denotes schedule, Istands for interchange between control areas, F standsfor system frequency, and B is the system frequency bias (MW/0.1 Hz, a negative value). The generation output consists of two components:a s dev G G G =+(2)where subscript s refers to hour-ahead schedule 3, and dev refers to the deviation from the schedule.Similarly, the load can be separated into twocomponents as follows:_a f ha dev L L L =+ (3)where L f_ha is hour-ahead load forecast.Based on the assumption that_s f haG L =(4)the difference between the actual load, L a , and theforecasted load, L f_ha , represents the load deviation that is compensated by generators (or energy storage) procured for load following and regulation processes. _dev a f ha a s L L L L G =-=- (5) Wind and solar generation can be treated as negative load._w w wa f ha dev G G G =+ (6) 3 Please note that the hour-ahead schedule can be implemented differently in the different markets.where w a G is the actual wind power, _w f ha G is hour-ahead wind power forecast, and wdevG is the deviation from the forecast.Therefore, similarly to the situation without wind, the balancing power can be expressed as follows: __w s f ha f ha G L G =- (7)__()()w s w w dev a a a f ha a f ha L L G G L L G G =--=--- (8)Fig. 1 shows the imbalance power in the WECC model for August 2030. The balancing power needed in the system is opposite to the imbalance. It is assumed that the peak load in 2030 will have grown to 205 GW, and the installed wind capacity will be 88GW (up from about 7 GW in 2008 [18]). The highly fluctuating imbalance signal is attributable to the highvariability of wind power. It also represents the gap between the scheduled generation and actual load. By utilizing energy storage, the imbalance can be reduced by charging the energy storage whenever there is over-generation (imbalance signal is above zero) and discharging the storage during periods of under-generation (imbalance signal is negative). Periodic zero total energy components of the imbalance signal in Fig. 1 correspond to the maximumcharging/discharging job that can be allocated to theenergy storage.time in hoursI m b a l a n c e p o w e r (G W )Fig. 1. Imbalance power imposed by load and wind variability for assumed 88 GW of installed wind capacity (WECC model for Aug.2030).B. DFT Analysis Different energy storage technologies are best suited for operation over different time periods. Theimbalance power, shown in Fig. 1, can be broken down into the components spanning differentfrequency ranges. This decomposition can be achieved by using DFT. Each component of the periodic signal, except for the zero frequency component, representscycling energy that averages to zero over each cycle.Generally, in a discrete form, the DFT analysis and synthesis equations are written as follows [19]:Analysis equation (fast Fourier transform)1[][]N tfNt X f x t W -==∑0,,1f N =- (9) Synthesis equation (inverse Fourier transform) []101[]N tf N f x t X f W --==∑0,,1t N =- (10)where N is the number of the data points in the sequence (x [0], x [1], , x [N -1]), and()2j tf tfN W e π-=.The basic approach to decompose the imbalance signal using DFT consists of five steps, as shown in Table 1.Four different frequency ranges are selected, and thesignal is decomposed into four categories: slowcycling, intra-day, intra-hour and real-timecomponents. The band-pass filter applied to thespectrum is a rectangular window with unit magnitude within the band and zero magnitude outside of the band, as illustrated in Fig. 2 and Table 2. It is symmetric around one half of the sampling frequency. Table 1: Procedures of applying DFT for cycling analysis Steps Description1 Assume that the data sampling x (t ) issampled each minute (or 0.0167 Hz). Thedata window selected for DFT analysis is 2days (2880 samples), which starts at 0:00 and ends at 48:00.2 The data points are increased to 5760 samplewith zero padding.3 The spectrum, X (f ), is obtained by DFT. Aband-pass filter (see Fig. 2) is applied to the spectrum, X (f ).4 The filtered spectrum is converted back tothe time-domain signal, x´(t ), by using inverse DFT.5 The time-domain signal x´(t ) is characterizedby the magnitude and periodicity.frequencies are f l and f u, and the filter is symmetrical about the half ofthe sampling frequency, f s /2)Table 2: Specifications of frequency bands of the balancing signalcomponentsComponent f l (Hz) f u (Hz) Slow cycling 0 2.315e-5Intra-day 2.315e-5 9.259e-5 Intra-hour 9.259e-5 0.00333Real-time 0.00333 0.00833The frequency ranges given in Table 2 have no astrict definition and they are loosely connected to the dispatch intervals. The reason is that a dispatchinterval can contain half cycle, the entire cycle, twocycles, and so on depending on researchers’ judgment. Currently they are set for periods of 3-12 hours (intra-day), 5 minutes –3 hours (intra-hour), and 2–5 minutes (real time).C. Simulation Results The DFT method described in Section II was applied to a simulated WECC system imbalance powermodel reflecting a future high wind penetrationscenario for 2030. Several simplifying assumptionswere made to determine the balancing requirementscurve. The balancing requirement was derived from the uncertainty in the load and wind forecasting. The scenario assumed 88 GW of wind capacity in the WECC system. Furthermore, it was assumed aconsolidation of all WECC balancing areas into onesingle balancing area. This model was derived in a previous PNNL project analyzing the energy storagepotential applications in the WECC system [18]. D. Decomposition of Balancing Power for a Particular DayFig. 3 shows the one-day imbalance power signal (top) and the corresponding spectrum (bottom). Most of the energy is concentrated in the low and middle frequency bands.G WBy applying the filters shown in Fig. 2 and Table 2, in Fig. 4 the imbalance power, x (t ), is decomposed into four components, namely, into slow cycling, intra-day, intra-hour, and real time components, x 1(t ), x 2(t ), x 3(t ) and x 4(t ). By summation of these components, we can reconstruct the original time-domain signal. Thereconstructed imbalance power matches well with the original signal, as shown in Fig. 5.The frequency and magnitude of the decomposed signal play an important role in determining the required energy storage characteristics as well as technologies appropriate for each application.HoursM W(a) Slow cycling component x 1(t )HoursM W(b) Intra-day component x 2(t)HoursM W(c) Intra-hour component x 3(t)HoursM W(d) Real-time component x 4(t )Fig. 4. Decomposition of imbalance signal for a day in August 2030HoursG W-12HoursM WFig. 5. Comparison between original signal and reconstructed signal.The frequency of cycling increases for intra-hour and real time components. This means that the energy capacity requirements are decreasing, while the cycling requirements are increasing. The cycling requirement has implication for the life time of the energy storage.The energy storage power capacity requirement is associated with the magnitude of the cycles. On this particular day, the imbalance power swings between 10.7 GW and -4.1 GW, while intra-hour component swings between 6.1 GW and -4.8 GW, and real-time component swings between 154 MW and -153 MW 4. Therefore, the intra-day balancing process requires more ES power capacity than the intra-hour process by 43. The same fact has also been observed for other days as described below.E. Sizing of Energy StorageTo determine the size of energy storage for slow-cycling, intra-day, and intra-hour balancing processes, the method described in Section II was applied. We assumed a depth of discharge for the ES of 80%. Table 3 shows both the power and energy capacities for the energy storage.In the full balance scenario (second column), the energy storage compensates for all the imbalance power. In the partial balance scenario (third column), the energy storage compensates for only intra-hour and real-time components. In the fourth column, the reduction in ES requirements between the full balance and partial balance is shown.4Despite the asymmetric power capacity requirement, the energy requirement remains symmetric (the positive and negative energy are equal), which is important for the energy storage applications.Table 3: Comparison of the full balance and partial balancescenariosEnergy storage size Full balance Partial balance Reduction inES requirements Power 13.4 GW 7.7 GW 42.6% Energy68.1 GWh4.3 GWh 93.6%A very significant ES energy capacity (68.1 GWh) would be required in the full balance scenario. The state of charge of ES in this scenario is shown in Fig. 6. The size of the energy storage can be reduced to 3.8 GWh for the intra-hour component and to 568 MWhfor the real-time component as shown in Fig. 7.daysG W hFig. 6. State of charge profile for energy storage in Aug 2030(storage size=68.05 GWh)daysG W h(a) Intra-hour component (storage size=3.8 GWh)daysM W h(b) Real-time component (storage size=568 MWh)Fig. 7. State of charge profile for intra-hour and real-timecomponents in August 2030III. C ONCLUSIONSThis paper presents a novel methodology of characterizing maximum energy storage requirements for a balancing area or their interconnection. The approach is particularly useful for the system planning community as well as for the energy storage providers.The introduction of a cycling taxonomy (slow-cycle, intra-day, intra-hour, intra-minute and real-time) offers a new way to characterize the key features of energy[1] J. C. Smith, M. R. Milligan, E. A. DeMeo, B. Parsons, "Utilitywind integration and operating impact state of the art," IEEE Transactions on Power Systems ,vol.22, no.3, pp. 900 - 908, August 2007.[2] Y.V. Makarov, C Loutan, Jian Ma, P de Mello, "Operationalimpacts of wind generation on California power systems," IEEE Transactions on Power Systems , vol. 24, no. 2, pp.1039 – 1050, May 2009.[3] A. Ter-Gazarian, “Energy storage for power systems,” ISBN-10: 0863412645, The Institution of Engineering and Technology, September 1994.[4] Eyer J. and G Corey, “Energy storage for the electricity grid:benefits and market potential assessment guide,” Sandia report SAND 2010–0815, Sandia, New Mexico, 2010.[5] J. N. Baker and A. Collinson, “Electrical energy storage at theturn of themillennium,” Inst. Elect. Eng. Power Eng. J., vol. 13, no. 3, pp. 107–112, June 1999.[6] J.P. Barton and D.G. Infield, "Energy storage and its use withintermittent renewable energy," IEEE Transactions on Energy Conversion , vol. 19, no. 2, pp. 441- 448, June 2004.[7] Y.V. Makarov, "Relative regulation capacity value of theflywheel energy storage resource," November 26, 2005. [8] Ancillary Services Manual, NYISO, September 2010.[9] M.G. Hoffmann, A. Sadovsky, M. C. Kintner-Meyer, J.G.DeSteese, "Analysis tools for sizing and placement of energy storage in grid applications: a literature review,” Pacific Northwest National Laboratory, July 2010.[10] C. Abbey, G. Joos, "A stochastic optimization approach torating of energy storage systems in wind-diesel isolated grids," IEEE Transactions on Power Systems , vol. 24, no. 1, pp. 418-426, 2009.[11] A. Oudalov, D. Chartouni, C. Ohler, "Optimizing a batteryenergy storage system for primary frequency control," IEEE Transactions on Power Systems , vol. 22, no. 3, pp. 1259-1266, 2007.[12] C.H. Lo, M.D. Anderson, "Economic dispatch and optimalsizing of battery energy storage systems in utility load-leveling operations," IEEE Transactions on Energy Conversion , vol. 14, no. 3, pp. 824 - 829, 1999.[13] S. Chakraborty, T. Senjyu, H. Toyama, A.Y. Saber, T.Funabashi, "Determination methodology for optimising the energy storage size for power system," IET Generation, Transmission & Distribution , vol. 3, no. 11, pp. 987-999, 2009.[14] P. Pinson, G. Papaefthymiou, B.Klockl, J.Verboomen,"Dynamic sizing of energy storage for hedging wind power forecast uncertainty," IEEE Power & Energy Society General Meeting 2009, pp. 1-8.[15] Y. M. Atwa, E. F. El-Saadany, “Optimal allocation of ESS indistribution systems with a high penetration of wind energy,” IEEE Transactions on Power Systems , vol. 1, no. 99, pp. 1-8, 2010.[16] X.Y. Wang, D. Mahinda Vilathgamuwa, S.S. Choi,"Determination of battery storage capacity in energy buffer for wind farm," IEEE Transactions on Energy Conversion , vol. 23, no. 3, pp. 868-878, 2008.[17] C. Abbey and G. Joos, "Supercapacitor energy storage forwind energy applications," IEEE Transactions on Industry Applications, vol. 43, no. 3, pp. 769-776, May-June 2007. [18]M. C. W. Kintner-Meyer, P. J. Balducci, C. Jin, TB. Nguyen,MA. Elizondo, VV. Viswanathan, X. Guo, and FK. Tuffner,“Energy storage for power systems applications: a regional assessment for the northwest power pool (NWPP),” Pacific Northwest National Laboratory, Richland, WA, 2010.[19]Alan V. Oppenheim, Ronald W. SchaferJohn, R. Buck,Discrete-Time Signal Processing, Prentice Hall, 1999 (p543) Yuri V. Makarov (SM’99)received the M.Sc. degree in computers and the Ph.D. degree in electrical engineering from the Leningrad Polytechnic Institute (now St. Petersburg State Technical University), Leningrad, Russia. From 1990 to 1997, he was an Associate Professor in the Department of Electrical Power Systems and Networks at St. Petersburg State Technical University. From 1993 to 1998, he conducted research at the University of Newcastle, University of Sydney, Australia, and Howard University, Washington, DC. From 1998 to 2000, he worked at the Transmission Planning Department, Southern Company Services, Inc., Birmingham, AL, as a Senior Engineer. From 2001 to 2005, he occupied a senior engineering position at the California Independent System Operator, Folsom, CA. Now he works for the Pacific Northwest National Laboratory (PNNL), Richland, WA. His activities are around various theoretical and applied aspects of power system analysis, planning, and control. He participated in many projects concerning power system transmission planning (power flow, stability, reliability, optimization, etc.) and operations (control performance criteria, quality, regulation, impacts of intermittent resources, etc.). Dr. Makarov was a member of the California Energy Commission Methods Group developing the Renewable Portfolio Standard for California; a member of the Advisory Committee for the EPRI/CEC project developing short-term and long-term wind generation forecasting algorithms; and a voting member of the NERC Resources Subcommittees and NERC Wind Generation Task Force. For his role in the NERC August 14th Blackout Investigation Team, he received a Certificate of Recognition signed by the U.S. Secretary of Energy and the Minister of Natural Resources, Canada.Michael Kintner-Meyer is a Staff Scientist with the Pacific Northwest National Laboratory (PNNL) in Richland. He has a Master Degree in Mechanical Engineering from the Technical University of Aachen, Germany and a Ph.D. in Mechanical Engineering from the University of Washington. He is leading the energy storage analysis efforts at PNNL.Pengwei Du received the B.Sc. and M.Sc. degrees in electrical engineering from Southeast University, Nanjing, China, in 1997 and 2000, respectively, and his Ph.D. degree in electrical engineering from Rensselaer Polytechnic Institute, Troy, NY in 2006. He is now a research engineer at the Pacific Northwest National Laboratory, Richland, WA. His research interests include Distributed Generation, power system modeling and analysis, and digital signal processing.Chunlian Jin (M’06) received her B.S.E.E. from Northwestern Polytechnic University, Xi’an, China, in 2000, and her M.S.E.E. from Tsinghua University, Beijing, China, in 2003. Her research interests include energy storage analysis, modeling and assessment of power system operations and control performance, and integration of renewable resources. Currently, she is a research engineer with the Energy and Environment Directorate, Pacific Northwest National Laboratory, Richland, WA. She finished PhD courses in University of South Carolina. Howard F. Illian graduated from Carnegie Institute of Technology (Carnegie-Mellon University) in 1970 with a B.S. in Electrical Engineering. From 1970 until 1982 he worked for ComEd in the field of Operations Research, and was Supervisor, Economic Research and Load Forecasting from 1976 until he was reassigned to Bulk Power Operations in 1982 where he was Technical Services Director when he retired in 1998. He is now President of Energy Mark, Inc., a consulting firm specializing in the commercial relationships required by restructuring. He has authored numerous papers in the field of Engineering Economics, and has testified as an expert witness in this field before the Illinois EPA, the Federal EPA, the Illinois Commerce Commission and the Public Utility Commission of Texas. He has developed and applied several new mathematical techniques for use in simulation and decision making. He has served on the NERC Performance Subcommittee, the Interconnected Operations Services Implementation Task Force, the Joint Inadvertent Interchange Task Force, and the NAESB Inadvertent Interchange Payback Task Force. Recent work includes significant contributions to the development of new NERC Control Performance Standards including the Balancing Authority Ace Limit and a suggested mathematical foundation for control based on classical statistics. He first applied discrete Fourier transforms to load analysis in 1991. His current research concentrates on the development of technical definitions for Ancillary or Reliability Services including frequency response and their market implementation.。
第五届电气技术研讨会陈哲报告
Wind power control
Wind Farm behaviour
Q available
Fast response
Saturation
C. Combarros, J. C. Pérez ,“Results of implementing voltage control strategies in a cluster within the TWENTIES project framework”, EWEA April, 2012
现代电力系统中的风力发电技术 Wind Power in Modern Power Systems
Zhe CHEN Professor, PhD
zch@et.aau.dk http://www.et.aau.dk
1
Contents
• Status of nd Power Development • Danish grid code for wind turbine connection • Wind power in power systems (voltage control and electricity
7
Danish Power Industry
Wind power covers 28% of electricity consumption 2011
Aims for a 50% wind share by 2025
Denmark also has large number of CHP installations which supply both heat and electricity load with a high efficiency.
11 kW to 25 kW
research findings雅思听力真题
research findings雅思听力真题Academic ReadingWind Power in the USPrompted by the oil crises of the s, a wind-power industry flourishedbriefly in the United States. But then world oil prices dropped, and fundingfor research into renewable energy was cut. By the mid s US interest in wind energy as a large-scale source of energy had almost disappeared. The development of wind power at this time suffered not only from badly designed equipment, but also from poor long-term planning, economic projections that were too optimistic and the difficulty of finding suitable locations for the wind turbines.Only now are technological advances beginning to offer hope that windpower will come to be accepted as a reliable and important source ofelectricity. There have been significant successes in California, inparticular, where wind farms now have a capacity of megawatts, comparable toa large nuclear or fossil-fuelled power station, and produce 1.5 per cent ofthe state’s electricity.Nevertheless, in the US, the image of wind power is still distorted byearly failures. One of the most persistent criticisms is that wind power isnot a significant energy resource. Researchers at the Battelle Northwest Laboratory, however, estimate that today wind turbine technology could supply 20 per cent of the electrical power the country needs. As a local resource, wind power has even greater potential. Minnesota’s energy commissioncalculates that a wind farm on one of the state’s south western ridges could supply almost all that state’s electricity. North Dakota alone has enoughsites suitable for wind farms to supply more than a third of all electricity consumed in the continental US.The prevailing notion that wind power is too costly results largely from early research which focused on turbines with huge blades that stood hundredsof metres tall. These machines were not designed for ease of production or maintenance, and they were enormously expensive. Because the major factors influencing the overall cost of wind power are the cost of the turbine and its supporting systems, including land, as well as operating and maintenance costs,it is hardly surprising that it was thought at the time that wind energy could not be supplied at a commercially competitive price.More recent developments such as those seen on California wind farms have dramatically changed the economic picture for wind energy. These systems, like installations in Hawaii and several European countries, have benefited from the economies of scale that come through standardised manufacturing and purchasing. The result has been a dramatic drop in capital costs: theinstalled cost of new wind turbines stood at $ per kilowatt in , down from about $ per kilowatt in , and continues to fall.Design improvements and more efficient maintenance programs for large numbers of turbines have reduced operating costs as well. The cost of electricity delivered by wind farm turbines has decreased from about 30 cents per kilowatt-hour to between 7 and 9 cents, which is generally less than the cost of electricity from conventional power stations. Reliability has also improved dramatically. The latest turbines run more than 95 per cent of the time, compared with around 60 per cent in the early s.Another misconception is that improved designs are needed to make wind power feasible. Out of the numerous wind turbine designs proposed or built by inventors or developers, the propeller-blade type, which is based on detailed analytical models as well as extensive experimental data, has emerged as predominant among the more than 20,000 machines now in commercial operation world-wide. Like the gas-driven turbines that power jet aircraft, these are sophisticated pieces of rotating machinery. They are already highly efficient, and there is no reason to believe that other configurations will produce major benefits.Like other ways of generating electricity, wind power does not leave the environment entirely unharmed. There are many potential problems, ranging from interference with telecommunications to impact on wildlife and natural habitats. But these effects must be balanced against those associated with other forms of electricity generation. Conventional power stations impose hidden costs on society, such as the control of air pollution, the management of nuclear waste and global warming.As wind power has been ignored in the US over the past few years, expertise and commercial exploitation in the field have shifted to Europe. The European Union spends 10 times as much as the US government on research and development of wind energy. It estimates that at least 10 per cent ofEurope’s electrical power could be supplied by land-based wind-turbines using current technology. Indeed, according to the American Wind Energy Association, an independent organisation based in Washington, Denmark, Britain, Spain and the Netherlands will each surpass the US in the generating capacity of wind turbines installed during the rest of the decade.Glossaryfossil fuel: coal, oil and natural gaskilowatt: 1,000 watts; a watt is a unit of powerkilowatt-hour: one kilowatt for a period of one hourmegawatt: one million wattswind farm: a group of wind turbines in one location producing a large amount of electricitywind turbine: a machine which produces energy when the wind turns its bladesQuestions 1 - 5Complete the summary below.Choose your answers from the box below the summary and write them in boxes 1-5 on your answer sheet.NB There are more words or phrases than you will need to fill the gaps.You may use any word or phrase more than once.ExampleThe failure during the late s and early s of an attempt toestablish a widespread wind power industry in the United States resulted largely from the ...(1) ... in oil prices during this period. The industry is now experiencing a steady ...(2)... due to improvements in technology and an increased awareness of the potential in the power of wind. The wind turbines that are now being made, based in part on the ...(3)... of wide-ranging research in Europe, are easier to manufacture and maintain than their predecessors. This has led wind-turbine makers to be able to standardise andthus minimise ...(4)... . There has been growing ...(5)... of the importance of wind power as an energy source.criticism successdesign costs production costsfailure stabilityoperating costs fallgrowth recognitionscepticism decisionseffects declineresultsQuestions 6 - 10Look at the following list of issues (Questions 6-10) and implications (A-C).Match each issue with one implication.Write the appropriate letters A-C in boxes 6-10 on your answer sheet.Example AnswerThe current price of one wind-generated kilowatt...A6. The recent installation of systems taking advantage of economies of scale ...7. The potential of meeting one fifth of current US energy requirements by wind power ...8. The level of acceptance of current wind turbine technology ...9. A comparison of costs between conventional and wind power sources ...10. The view of wind power in the European Union ...IMPLICATIONSA provides evidence against claims that electricity produced from wind power is relatively expensive.B supports claims that wind power is an important source of energy.C opposes the view that wind power technology requires further development.。
加速器14C法测年及其应用
兰州大学硕士学位论文加速器<'14>C法测年及其应用姓名:***申请学位级别:硕士专业:地理学、自然地理学指导教师:陈发虎;徐齐治2002.5.1加速器¨C法测i卜及其应片J摘婴/fI苛精度tr代测定是国勋;4·7t候研究的关键,利HJD11述器测定‘c{lj代,闪uJ_精确对含毫克级碳样品的测定,广泛应用j一史日U考古、占环境重:建和示踪研究等方面。
而加速器。
C测年的关键是制取可用于测定的可靠靶样。
目前,国内AMS…C实验室。
c样品制靶问题主要在制样引入的现代碳污染偏高。
r、兰州大学AMS1C实验室在国内外已有研究基础上建立并改进了制靶系统,设计了循环系统与静态小系统,并分别与元素分析仪连接。
系统建成后,对石墨合成温度、压强、Fe粉样品碳量的比率等进行了摸索,在循环系统与静态系统中均成功的合成了石墨。
为检验制靶系统性能,选用标准样品和己知年代样品分别在循环系统(CuO氧化法制取COj)与静态小系统(元素分析仪燃烧样品)中制成石墨靶并送德国,Leibniz—AMS实验室测定。
f测定报告(由Marie--JoseeNadeau提供)认\为:“靶样品的C‘束流稳定,测量结果可靠”。
循环系统与静态系统所制石墨靶检验结果均表明:在技术性能上,AMS“C样品制靶技术达到国际水准,可以开展AMS‘4C年代精确制靶。
另外,连接元素分析仪后获得了高纯度的c02气体,提高了c02利用率,减少了传统CuO氧化法制取C02引入的污染,提高了石墨合成的成功率,连接元素分析仪是可行的。
全新世的短尺度气候事件研究往往受控于沉积速率和可靠的年代测定。
出于测年物质缺乏或选取不当等原因,可靠的年代测定仍然显得不足。
这就使寻找新的测年物质以改善全新世年代测定现状显得很有必要。
中国西部干旱区是近几年国际、国内研究中热点之一。
该区广泛分布的湖泊沉积物因沉积速率高,沉积连续成为第四纪环境演变研究的主嘤刈缘,"址“Cq-:1'U≠柑架仍小完符,影lll;,l{lJl‘究的深入。
对I-GridTM系统能力的电能质量和供电可靠性实例监测研究的新方法(英文)
A new approach to power quality and electricity reliabilitymonitoring-case study illustrations of the capabilities of theI-GridTM systemAuthor:Divan, DeepakBrumsickle, WilliamEto, JosephPublication Date:04-01-2003Publication Info:Lawrence Berkeley National LaboratoryPermalink:/uc/item/2w85j5zzAbstract:This report describes a new approach for collecting information on power quality and reliability and making it available in the public domain. Making this information readily available in a form that is meaningful to electricity consumers is necessary for enabling more informed private and public decisions regarding electricity reliability. The system dramatically reduces the cost (and expertise) needed for customers to obtain information on the most significant power quality events, called voltage sags and interruptions. The system also offers widespread access to information on power quality collected from multiple sites and the potential for capturing information on the impacts of power quality problems, together enabling a wide variety of analysis and benchmarking to improve system reliability. AcronymsCAIDI customer average interruption duration indexCAIFI customer average interruption Frequency indexDOE U.S. Department of Energy DUR duration EPRI Electric Power Research Institute MAG magnitudeMAIFI momentary average interruption frequency indexR&D research and developmentSAIDI system average interruption duration indexSAIFI system average interruption frequency indexSEMI Semiconductor Equipment and Materials International1. IntroductionPublic interest in electricity reliability is at an all-time high because of recent negativeexperiences associated with electricity industry restructuring: rolling blackouts, inadequately designed and policed electricity markets, and resulting unacceptably high wholesale electricity prices. The recent National Transmission Grid Study (DOE 2002) observes that “as a cornerstone of restructuring, we should allow consumers to pay for a higher level of reliability than that provided by the current electricity system.” It then goes on to note that “[a] critical barrier to informed consumer decisions about reliability, which includes power quality, has been the lack of public data on the subject.”Assessment of power quality involves looking at electromagnetic deviations from the ideal service that the U.S. electricity distribution system is designed to provide: a pure 60-cycle per second alternating current at a designated voltage (120 volts for residential customers or 480 volts for many commercial or industrial customers). Any deviation from this standard that causes customers‟ equipment to fail or malfunction is considered a power quality “event.”Sustained interruptions (blackouts), which occur when voltage falls to zero for more than one minute (typically, 5 minutes or more), are the power quality problem with which most individuals have the greatest direct experience and are the key phenomena represented in utility reliability statistics.For many customers, subtle deviations in power quality pose a far more significant reliability problem than outages. The most common small deviation is a voltage “sag” – a drop in (but not complete loss of) voltage for a short period of time (i.e., from a few cycles to a few seconds).Voltage sags can be caused by natural events (e.g., trees falling on power lines or lightning striking lines or transformers), utility activities (e.g., routine switching operations or human error), or customer activities (e.g., starting of large motors). Although in the past most electricity-consuming devices could “ride through” voltage sags (e.g.,a light bulb might dim momentarily), many of the electricity-consuming devices associated with today‟s digital economy (e.g., equipment controlled by programmable logic chips) cannot tolerate a partial drop in voltage for even a fraction of a second. Voltage sags may cause this equipment to shut down and remain off even after service is restored to normal levels. Voltage sags are rapid and not easilydetectable by an untrained observer, and so consumers may not realize that a power quality …event‟ caused their equipment to fail or stop operating. They are not included in reliability statistics reported by utilities (e.g., SAIFI, SAIDI, CAIDI, CAIFI, MAIFI).Figure 1. Representative Power Quality Data and the SEMI F47 StandardFigure 1 illustrates the relationship between voltage sags and equipment performance. The figure plots individual recorded power quality events by their duration and magnitude.Superimposed on the figure is the SEMI F47-0200 standard (SEMI 2000), which is a standard for voltage tolerance for sensitive equipment. Equipment that meets the SEMI F47 standard should be able to tolerate voltage sags of durations and magnitudes above the curve. As indicated by these data, a significant number of recorded events fall below the curve, indicating that these events would cause the equipment to fail or mis-operate.Increased reliance on devices susceptible to power quality problems means that the U.S.economy‟s vulnerability to electricity supply inter ruptions in general, and momentary supply deviations in particular, has increased. Thus, the disconnection noted above -- between the statistics that utilities collect about power quality and the actual power quality effects that are important to consumers -- has great economic significance. In some cases, it may be most costeffective to harden customer‟s equipment to be more tolerant of power quality events; in other cases, it may be morecost-effective to implement changes to the grid and its operation.This report describes the capabilities of a new power quality monitoring system that addresses both private and public interests in improving the accessibility of power quality information.The system, called the I-GridTM, consists of very low-cost monitoring devices ($300 each) and a web data base and analysis capability that is separate from the devices and easy to use without specialized training. When an I-Grid monitoring device detects a voltage sag or interruption, it time-stamps and precisely records the data; after voltage returns to normal, the device automatically dials up and uploads information on the event to a web server.3 Customers and others can then view and analyze the event on a secure website.The system dramatically reduces the cost (and expertise) needed for customers to obtain information on the most significant power quality events: voltage sags and interruptions. The system also offers widespread access to information on power quality collected from multiple sites and the potential for capturing information on the impacts of power quality problems,together enabling a wide variety of analysis and benchmarking to improve system reliability.2. The I-Grid Power Quality and Reliability Monitoring System The I-Grid system, developed by SoftSwitching Technologies,4 offers the potential for a webbased power quality and reliability monitoring and alarm system for key aspects of U.S. electricity grid performance. The system relies on widespread deployment of a large number of ultra-low-cost “I-Sen se”™ power monitors throughout a geographic region of the grid. The monitors capture data on grid events, including outages, blackouts, brownouts, interruptions, and short-duration power quality disturbances or events such as voltage sags and swells, which, as noted in the previous section, can pose significant reliability concerns from the customer‟s point of view.The monitors transmit data via the Internet to a central data base and website. Information on grid events is displayed at the website, and near-real-time notification of events is sent to designated individuals or groups. With these functions, the website can act like a live “web cam” for areas of the electricity grid.Most providers of power quality monitoring equipment6 have focused primarily ondata collection from single sensors or a group of sensors for a particular plant, facility, or customer.Emphasis has been on developing “smart” sensors that support their own web sites with full notification and reporting services. Although sensor costs have drifted downward, the focus has been on increasing performance rather than reducing cost. Costs for individual sensors have consistently stayed in the range of $2,000 to $10,000 per node although there has been some movement downward into the $500 range in recent years. Solutions at the lower end of the cost spectrum are typically linked with monthly charges of $50 to $200 per month per node. This prevailing high cost per node dramatically limits the deployment of power quality monitors.Almost no attempts have been made to date to introduce ultra-low cost monitors that could enable massively distributed arrays of correlated power sensors.The I-Grid differs from other power quality monitoring approaches in providing real-time as well as historical data on site-specific power quality and energy consumption patterns. More importantly, the low cost per node means that broad-based deployment of monitoring across the electricity grid is more financially feasible. A large number of monitors along with appropriate analysis software could allow data clustering and aggregation over large geographic areas to assess power quality and reliability for individual customers as well as grid-wide measures of the state of the electricity system.3. Case Studies of I-Grid CapabilitiesThe case studies summarized in this section demonstrate selected functionality and capabilities of the I-Grid system, including:• Linking measured power quality events to process interruption and downtime;• Demonstrating the ability to co rrelate events recorded by multiple monitors to narrow and confirm the causes of power quality events; and• Benchmarking power quality and reliability on a firm and regional basis.Case 1: Power Quality at a Major U.S. Automobile Assembly Plant with Dual Utility FeedsBackground:For many customers who require highly reliable power, utilities provide dual feeds; i.e., service to a facility comes from two independent transmission lines.Under normal conditions, the plant load is shared by the two transmission lines. When a problem arises on one of the lines, plant loads are switched nearly instantaneously to the other line. In other words, the two lines provide redundant paths to ensure near continuous electric service to a customer.Description:A large automobile assembly plant (over 3,000 workers) is supplied from a dedicated substation that is fed from two separate transmission lines. An I-Sense monitor was located on each transmission line. See Figure 2.A grid event occurred during which the monitor on one line recorded a voltage sag of4.8 cycles (0.09 seconds) followed immediately by a complete interruption that lasted 9.8 seconds; the other monitor recorded a similar voltage sag followed by return to normal voltage and no subsequent interruptions. These data indicate that a fault occurred on the first transmission line,and a voltage sag was propagated from one line to the other. See Figure 3.The physical cause of the event was later reported: a windstorm caused a line-line fault at the point of entry of Transmission Line #1 into the substation. The fault was initially fed by both transmission lines, causing a voltage sag on all downstream load buses. Circuit breakers subsequently disconnected the faulted transmission line, leaving all plant loads connected to the remaining Transmission Line #2. DiscussionThis case study demonstrates the operation of a dual feed when a fault occurs: an automatic transfer is initiated from the faulted feed to the unfaulted feed. This strategy allows automatic restoration of power to the facility, permitting a restart of interrupted processes. The dualtransmission-feed infrastructure meant that this company experienced only a four-cycle (0.07-second) voltage sag rather than a several-hour interruption of service. Nevertheless, the voltage sag was sufficiently severe to cause some process interruptions. Commercially available voltage sag mitigation equipment would have kept all critical processes running during this event; 68 percent of voltage remained during the sag, and sag correctors can compensate down to 50 percent remaining voltage.This example shows how highly reliable power can be provided with two utility feeds but also that use of dual feeds does not eliminate the short-duration voltage sags thatcan also cause process downtime.Figure 2. Line Diagram for Case #1Events recorded on Feeder #1: A two-line sag for four cycles, followed by nominal voltage for one cycle, followed by complete interruption for 9.8 seconds, followed by return to normal.Events recorded on Feeder #2: A two-line sag for four cycles, with no subsequent interruption.Event waveforms are shown below. Note that the plots of events 263(#1) and 251(#2) are of exactly the same total duration. Note also that the beginning of event 264 is visible in the plot of event 263.Figure 3. Case #1 Event Waveforms4. ConclusionThis report describes a new approach for collecting information on power quality and reliability and making it available in the public domain. Making this information readily available is necessary for enabling informed private and public decisions regarding electricity reliability.The importance of national leadership on this issue is highlighted by increased public concerns over electricity reliability issues and increased vulnerability of a growing segment of the U.S.economy to power quality problems.The system, called the I-Grid, consists of very low-cost monitoring devices ($300 each) and a web database and analysis capability that is separate from the devices andeasy to use without specialized training. When a monitoring device detects a voltage sag, which is the most significant power quality problem, it time-stamps and precisely records the data; after voltage returns to normal, the device automatically dials up and uploads information on the event to a web server. Customers and others can then view and analyze the event on a secure website.The case studies was described that illustrate how the I-Grid is being used today and could be extended in the future to serve a variety of private and public interests related to the importance of electricity reliability and power quality. This report, along with a companion report examining specific impacts of power quality and reliability events on customers (Eto,Brumsickle, Divan 2003), has been prepared as input to planning discussions for activities to increase the availability of power quality and power reliability information in the public domain.。
- 1、下载文档前请自行甄别文档内容的完整性,平台不提供额外的编辑、内容补充、找答案等附加服务。
- 2、"仅部分预览"的文档,不可在线预览部分如存在完整性等问题,可反馈申请退款(可完整预览的文档不适用该条件!)。
- 3、如文档侵犯您的权益,请联系客服反馈,我们会尽快为您处理(人工客服工作时间:9:00-18:30)。
Reliability Standards for the Northwest Power System Abstract For lack of a better measure, the electric utility industry generally references 95-percent reliability as a “standard” for the Northwest power system, but it is a goal and not an official regulation, requirement or code. As the nation‟s electricity industry becomes increasingly competitive, and as our nation becomes increasingly dependent on technology that requires highly reliable electric power, the issue of a regional or national reliability standard looms large. What is an acceptable standard? How would it be created, and what would it address? Should there be one standard or several? Occasional power outages are an inconvenience for some and a disaster for others. Perhaps there is no need for a “standard,” as consumers who need highly reliable power can pay for that privilege by purchasing their own backup generators, and those for whom reliability is less critical might be willing to accept whatever reliability their power supplier provides -- and at a lower cost. This paper explores past efforts to define and assess reliability, and recommends next steps for developing a standard or standards. Separate standards for generation planning, operation and transmission probably are warranted. For operations, a deterministic standard might be crafted around minimum reserve requirements. For generation planning purposes, a probabilistic standard (one that incorporates the frequency, duration and magnitude of customer interruptions) could serve. For transmission, it seems appropriate that an independent Regional Transmission Operator (RTO) would establish a standard, with attention to reducing congestion and rewarding distributed generation when it relieves stress on the system.
Defining the Power System A power system can be very complex, integrating many different types of generating resources to provide electricity to a number of customers with varying requirements. Each individual component has its own characteristics, including its dependability or reliability. One can imagine the difficulty in trying to evaluate the reliability of such a complex system as a whole. To simplify the task somewhat, power systems are generally broken down into three major components: the generation system, the bulk transmission system and the distribution network. The generation system includes all resources that produce electricity, including oil and gas-fired turbines, coal and nuclear plants, hydroelectric dams, windmills and all other generators. The bulk transmission system includes high voltage transmission lines that connect generators to distribution networks. The distribution networks, made up of all the lower voltage lines, deliver electricity to individual customers. To our knowledge, no one has attempted to evaluate the reliability of a power system as a whole. Generally, individual utilities assess the reliability of their own distribution networks. This paper focuses on methods to assess the reliability of the generation component of the power system. Defining Reliability In general terms, reliability is a measure of how well a system performs its expected function. Another system characteristic that is closely associated with reliability is adequacy. A system is adequate if it has sufficient resources to perform its function. A system can be adequate but unreliable. However, if a system is inadequate, then by most definitions it is also unreliable. For electrical power systems, these two terms can be defined more specifically. The North American Electric Reliability Council defines power system reliability to be: the degree of performance of the elements of the bulk electric system that results in electricity being delivered to customers within accepted standards and in the amount desired. Reliability may be measured by the frequency, duration and magnitude of adverse effects on the electric supply. Electric system reliability can be addressed by considering two basic and functional aspects of the electric system -- adequacy and security. Adequacy - The ability of the electric system to supply the aggregate electrical demand and energy requirements of the customers at all times, taking into account scheduled and reasonably expected unscheduled outages of system elements. Security - The ability of the electric system to withstand sudden disturbances such as electric short circuits or unanticipated loss of system elements. The NERC definitions of adequacy and security apply to both the generation and transmission systems. Both systems must be able to continue operation after a sudden disturbance -- either a loss of a major transmission line or a major generator. A power system is unreliable if either its transmission or generation systems are inadequate. Unfortunately, analyzing the composite reliability of both systems is very difficult. Because of this difficulty and because in practice the reliability of each system is usually measured separately, the focus of this paper will be on the generation system. However, the Northwest Power Planning Council is also participating in discussions regarding the bulk transmission system and is in favor of establishing a Regional Transmission Operator that will have some control over transmission reliability. The Northwest Power Planning Council has defined the terms “reliable” and “adequate” in a slightly different way for the generation system. When the Council discusses reliability, it means the short-term ability of the existing and planned generation system to deliver electricity when needed, including unusually cold periods or times when generators are out of service. In the Council‟s March 2000 analysis, it concluded that the generation system was “inadequate” meaning that more resources were needed in order to lower the risk of blackouts to an acceptable level. In that sense, the Council concluded that the power system was also unreliable.