水土流失Plant Spatial Pattern Predicts Hillslope Runoff and Erosion
通用土壤流失方程USLE简介

通用土壤流失方程USLE简介通用土壤流失方程USLE简介1965 年,W.H.Wischmeier 和D.Smith对美国30个州近30年的观测资料进行了系统分析,根据近万个径流小区的试验资料,提出著名的经验模型—通用土壤流失方程(USLE),作为预测面蚀和沟蚀引起的年平均土壤流失量的方法,它考虑了降雨、土壤可蚀性、作物管理、坡度坡长和水土保持措施5大因子,方程式如下:A = R?K?LS?C?P。
式中:A 为年平均土壤流失量, t/ hm2 ;R 为降雨和径流侵蚀因子;K 为土壤可蚀性因子;LS 为地形因子,其中L 为坡长因子, S 为坡度因子;C 为作物管理因子;P 为治理措施因子。
USLE 可用来计算年平均土壤流失量,从而指导人们进行正确的耕作、经营管理,采取适当的保护措施来保持土壤。
它所依据的资料丰富、涉及区域广泛,因而具有较强的实用性,曾在世界范围内得到了广泛的推广。
1978 年, W.H.Wischmeier 和D.Smith针对应用中存在的问题,对USLE 进行了修正,使USLE 更具普遍性。
其不足之处:以年侵蚀资料建立起来的USLE,无法进行次降雨土壤侵蚀的预报。
同时,实践证明,USLE 不太适用于垄作、等高耕作,以及那些使泥沙就地沉积的带状耕作措施等。
WEPP(Water Erosion Prediction Project)WEPP(Water Erosion Prediction Project) WEPP 实际是USDA 推出的用以替代USLE 的新一代土壤侵蚀预测模型。
从1985 年开始研究,1989 年基本完成,后经过多次改进和完善,于1995年向外公布。
它属于一种连续的物理模型。
模型可模拟的流域物理过程有:日土壤水分平衡,不同植被条件下(农作物、林地和草地等) 的日蒸发散,年作物产量、畜牧产量,径流、灌溉时的侵蚀,林地侵蚀,细沟和沟间侵蚀,农业管理措施对侵蚀及水文过程的影响等。
美国农业部通用土壤流失方程式

美国农业部通用土壤流失方程式(USLE )其表达式为: A =0.224RKLSCP式中:A — 土壤流失量(kg/m 2·年); R — 降雨侵蚀力因子; K — 土壤可蚀性因子; L — 坡长因子S — 坡度因子:C — 植被覆盖因子; P — 土壤侵蚀控制因子; 上式各因子的物理定义为:降雨侵蚀力因子R 等于在预测期内全部降雨侵蚀指数的总和,R 值计算采用Wi shmeier 的EIx 指数法。
其对单次降雨R 值的计算公式为:① R :对于一次暴雨来说,其计算公式为: R=I ·[(2.29+1.15lgx)·Di]式中:I ——降雨过程中的时间历时(h ); Di ——时间历时I 的降雨量(cm );I ——此次暴雨强度中强度最大的30分钟的降雨强度(cm/h );X ——为降雨强度降雨强度(cm/h )。
②对于一年的降雨,若缺乏降雨强度和降雨历时资料,可根据当地的气象资料:当地多年平均年降雨量及各月平均降雨量,采用Wischmeiet 经验公式计算:()[]∑=-⨯=1218188.0/5.1210735.1i p piLg R式中:P ——年降雨量(mm);P i ——月平均降雨量(mm)。
②K:是指一种土壤对侵蚀的敏感性,土壤最准确的K值应在标准径流小区直接测得。
但许多研究表明,土壤K值和土壤本身固有的性质具有密切关系,主要与土壤质地、有机质含量、土壤结构和土壤渗透级别等因素有关,可通过采用分析土壤质地、有机质含量两项因素、并参照有关土壤可蚀因子统计参数和工程情况确定(见表7-1)。
在工程土壤松散,结构破坏的情况下,土壤可蚀性变化大,上述K值应以相应的工程系数进行调整。
③LS:地形因子主要包括坡度和坡长因子。
坡度和坡长是同时共同对土壤侵蚀和流失产生影响,因而统称为地形因子。
地形因子是地表径流长度与坡度的函数,其计算公式如下:LS=(L/22.13)m·(0.065+0.045S+0.0065S2)式中:L:侵蚀坡面的坡长(米);S:坡度(%);m:指数;指数m现行推荐值为:m =0.5 坡度≥5% ;m =0.4 5% > 坡度> 3%;m =0.3 3% > 坡度≥1%;m =0.2 坡度< 1%;表7-1 不同土壤质地有机质含量(%)的K值④C:植被因子C是地表覆盖情况对土壤侵蚀的影响。
水土保持术语 英文

水土保持术语英文全文共四篇示例,供读者参考第一篇示例:1. Erosion: Erosion is the process by which soil and rock are removed from the Earth's surface by natural forces such as wind, water, and ice. Erosion can be accelerated by human activities such as deforestation and agriculture.第二篇示例:水土保持术语在农业、环境保护和土地管理领域中非常重要。
水土保持术语英文表达清晰,通常由简单的单词或短语组成。
以下是一些常见的水土保持术语英文及其解释:1. Erosion(侵蚀):指土壤表面被水流、风力、冰雹等自然力量剥离、摩擦和冲走的过程。
侵蚀是导致土壤贫瘠和土地退化的主要原因之一。
2. Runoff(径流):指雨水或融雪在土壤表面流动,并最终流入水体的过程。
径流过程中会携带土壤、化学物质和污染物,对水环境和土壤质量产生不良影响。
3. Soil Conservation(土壤保护):指采取一系列措施和管理实践,保护土壤不被侵蚀、污染或退化,从而维护土地的生产力和生态系统的健康。
4. Sedimentation(沉积):指悬浮在水体中的固体颗粒(如泥沙、沙砾)沉降到底部或河床上的过程。
沉积会导致水体变浑浊、水质下降,对水生态系统造成负面影响。
5. Contour Plowing(等高线耕作):一种水土保持措施,通过在地势上依照等高线的方式进行耕作,可以减少侵蚀和径流的发生,保护土壤不受流失。
6. Riparian Buffer(河岸缓冲带):河岸附近的植被区域,可以减少水体径流的速度,过滤悬浮物质和污染物,保护水体质量并维护水生态系统的健康。
7. Soil Structure(土壤结构):土壤内部的颗粒排列和空隙结构,对土壤的透水性、通气性和保水能力等性质具有重要影响。
江苏省沿海平原沙土区典型河沟边坡土壤侵蚀试验研究

第36卷第2期2022年4月水土保持学报JournalofSoilandWaterConservationVol.36No.2Apr.,2022
收稿日期:2021-09-21 资助项目:江苏省水利科技项目(2019039);江苏省水文局科技服务项目(JSSW201911005)
第一作者:曲丽莉(1997—),女,博士研究生,主要从事土壤侵蚀与水土保持研究。E-mail:qulili@issas.ac.cn 通信作者:梁音(1963—),男,博士,研究员,博士生导师,主要从事土壤侵蚀与水土保持生态恢复研究。E-mail:yliang@issas.ac.cn
江苏省沿海平原沙土区典型河沟边坡土壤侵蚀试验研究曲丽莉1,3,郭红丽2,李盟2,吴芳2,梁音1,朱绪超1,田芷源1,代梦梦1,3,袁久芹4(1.土壤与农业可持续发展国家重点实验室,中国科学院南京土壤研究所,南京210008;2.
江苏省水文水资源勘测局,
南京210005;3.中国科学院大学,北京100049;4.盐城市大丰区堤防管理处,江苏盐城224100)
摘要:为探明江苏省沿海平原沙土区河沟边坡土壤侵蚀过程并建立预测模型,在4个坡度和2个雨强条件
下,对江苏省沿海平原沙土区典型河沟边坡土壤开展人工模拟溅蚀试验和微区模拟降雨试验,了解河沟边坡土壤溅蚀特征,明确河沟边坡产流产沙过程,并利用传递函数方法分别建立了溅蚀率、产流强度和产沙强度的估算模型。结果表明:(1)河沟边坡土壤溅蚀率随降雨强度及坡度的增大而增加,土壤溅蚀率与降雨强度
和坡度之间呈线性关系;(2)河沟边坡的产流过程总体上呈现出先增大后波动稳定的趋势,产流强度随着坡
度的增大而减小;产沙过程总体上呈先快速增加后波动减小,最后趋于稳定的趋势,产沙强度随着坡度的增大而增加;产流强度和产沙强度均随雨强的增大而增大;(3)利用传递函数建立的方程预测溅蚀率,产流强
度和产沙强度具有较高的精度,方程的调整R2分别可达0.97,0.91和0.72。研究结果可加深对江苏省平
十大孔兑流域水土流失分布特征及防治对策
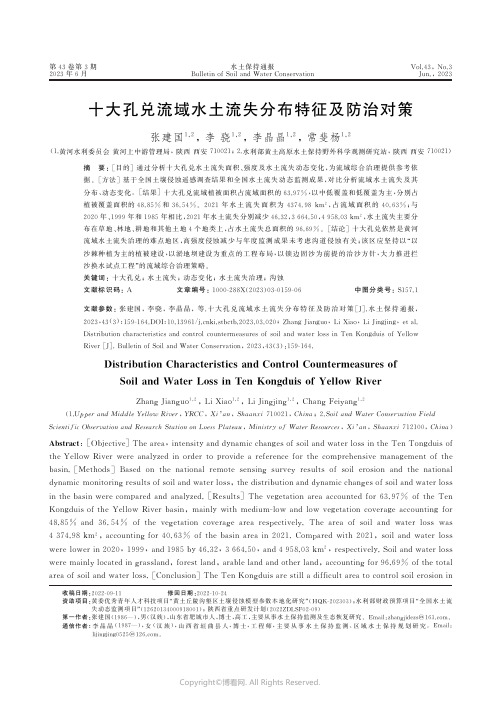
第43卷第3期2023年6月水土保持通报B u l l e t i no f S o i l a n d W a t e rC o n s e r v a t i o nV o l .43,N o .3J u n .,2023收稿日期:2022-09-11 修回日期:2022-10-24资助项目:黄委优秀青年人才科技项目 黄土丘陵沟壑区土壤侵蚀模型参数本地化研究 (H Q K -202303);水利部财政预算项目 全国水土流失动态监测项目 (12620134000918001);陕西省重点研发计划(2022Z D L S F 02-09) 第一作者:张建国(1986 ),男(汉族),山东省肥城市人,博士,高工,主要从事水土保持监测及生态恢复研究㊂E m a i l :z h a n g ji d e z s @163.c o m ㊂ 通信作者:李晶晶(1987 ),女(汉族),山西省垣曲县人,博士,工程师,主要从事水土保持监测㊁区域水土保持规划研究㊂E m a i l:l i j i n g j i n g0525@126.c o m ㊂十大孔兑流域水土流失分布特征及防治对策张建国1,2,李骁1,2,李晶晶1,2,常斐杨1,2(1.黄河水利委员会黄河上中游管理局,陕西西安710021;2.水利部黄土高原水土保持野外科学观测研究站,陕西西安710021)摘 要:[目的]通过分析十大孔兑水土流失面积㊁强度及水土流失动态变化,为流域综合治理提供参考依据㊂[方法]基于全国土壤侵蚀遥感调查结果和全国水土流失动态监测成果,对比分析流域水土流失及其分布㊁动态变化㊂[结果]十大孔兑流域植被面积占流域面积的63.97%,以中低覆盖和低覆盖为主,分别占植被覆盖面积的48.85%和36.54%㊂2021年水土流失面积为4374.98k m 2,占流域面积的40.63%;与2020年㊁1999年和1985年相比,2021年水土流失分别减少46.32,3664.50,4958.03k m 2,水土流失主要分布在草地㊁林地㊁耕地和其他土地4个地类上,占水土流失总面积的96.69%㊂[结论]十大孔兑依然是黄河流域水土流失治理的难点地区,高强度侵蚀减少与年度监测成果未考虑沟道侵蚀有关;该区应坚持以 以沙棘种植为主的植被建设,以淤地坝建设为重点的工程布局,以锁边固沙为前提的治沙方针,大力推进拦沙换水试点工程 的流域综合治理策略㊂关键词:十大孔兑;水土流失;动态变化;水土流失治理;沟蚀文献标识码:A 文章编号:1000-288X (2023)03-0159-06中图分类号:S 157.1文献参数:张建国,李骁,李晶晶,等.十大孔兑流域水土流失分布特征及防治对策[J ].水土保持通报,2023,43(3):159-164.D O I :10.13961/j .c n k i .s t b c t b .2023.03.020;Z h a n g J i a n g u o ,L iX i a o ,L i J i n g j i n g ,e t a l .D i s t r i b u t i o n c h a r a c t e r i s t i c s a n dc o n t r o l c o u n t e r m e a s u r e so f s o i l a n dw a t e r l o s s i nT e nK o n g d u i so fY e l l o w R i v e r [J ].B u l l e t i no f S o i l a n d W a t e rC o n s e r v a t i o n ,2023,43(3):159-164.D i s t r i b u t i o nC h a r a c t e r i s t i c s a n dC o n t r o l C o u n t e r m e a s u r e s o f S o i l a n d W a t e rL o s s i nT e nK o n gd u i s o fYe l l o wR i v e r Z h a n g J i a n g u o 1,2,L iX i a o 1,2,L i J i n g j i n g 1,2,C h a n g F e i y a n g1,2(1.U p pe r a n d M i d d l eY e l l o w R i v e r ,Y R C C ,X i a n ,S h a a n x i 710021,C h i n a ;2.S o i l a n d W a t e rC o n s e r v a t i o nF i e l d S c i e n t if i cO b s e r v a t i o na n dR e s e a r c hS t a t i o no nL o e s sP l a t e a u ,M i n i s t r y o f Wa t e rR e s o u r c e s ,X i a n ,S h a a n x i 712100,C h i n a )Ab s t r ac t :[O b j e c t i v e ]T h e a r e a ,i n t e n s i t y a n dd y n a m i c c h a n ge s of s o i l a n dw a t e r l o s s i n t h eT e nT o n gd u i s o f t h eYe l l o w R i v e rw e r ea n a l y z e d i no r d e r t o p r o v i d ear ef e r e n c ef o rt h ec o m p r e h e n s i v e m a n a ge m e n tof t h e b a s i n .[M e t h o d s ]B a s e d o nt h en a t i o n a lr e m o t es e n s i ng s u r v e y r e s u l t so fs o i le r o s i o na n dth en a ti o n a l d y n a m i cm o n i t o r i n g r e s u l t s o f s o i l a n dw a t e r l o s s ,t h e d i s t r i b u t i o n a n d d y n a m i c c h a n g e s o f s o i l a n dw a t e r l o s s i n t h eb a s i nw e r e c o m p a r e da n da n a l y z e d .[R e s u l t s ]T h ev e g e t a t i o na r e aa c c o u n t e df o r63.97%o f t h eT e n K o n g d u i s o f t h eY e l l o w R i v e rb a s i n ,m a i n l y w i t h m e d i u m -l o wa n d l o wv e g e t a t i o nc o v e r a g ea c c o u n t i n g fo r 48.85%a n d36.54%o ft h ev e g e t a t i o nc o v e r a g ea r e ar e s p e c t i v e l y .T h ea r e ao fs o i la n d w a t e rl o s s w a s 4374.98k m 2,a c c o u n t i n g f o r40.63%o f t h eb a s i na r e a i n2021.C o m p a r e d w i t h2021,s o i l a n d w a t e r l o s s w e r e l o w e r i n2020,1999,a n d 1985b y 46.32,3664.50,a n d 4958.03k m 2,r e s p e c t i v e l y .S o i l a n dw a t e r l o s s w e r em a i n l y l o c a t e d i n g r a s s l a n d ,f o r e s t l a n d ,a r a b l e l a n d a n d o t h e r l a n d ,a c c o u n t i n gf o r 96.69%o f t h e t o t a l a r e a o f s o i l a n dw a t e r l o s s .[C o n c l u s i o n ]T h eT e nK o n gd u i s a re s t i l l a d if f i c u l t a r e a t o c o n t r o l s o i l e r o s i o n i n Copyright ©博看网. All Rights Reserved.t h eY e l l o w R i v e r b a s i n.T h e r e d u c t i o no fh i g h i n t e n s i t y e r o s i o n i s r e l a t e dt o t h e f a i l u r e t oc o n s i d e r c h a n n e l e r o s i o n i na n n u a lm o n i t o r i n g r e s u l t s.T h i s a r e a s h o u l da d h e r e t o t h e c o m p r e h e n s i v em a n a g e m e n t s t r a t e g y o f v e g e t a t i o nc o n s t r u c t i o n b a s e do n H i p p o p h a er h a m n o i d e s p l a n t i n g,e n g i n e e r i n g l a y o u tf o c u s i n g o nt h e c o n s t r u c t i o no f s i l t i n g d a m,s a n d c o n t r o l p o l i c y b a s e d o n t h e p r e m i s e o f b o r d e r l o c k i n g a n d s a n d f i x a t i o n,a n d v i g o r o u s l yp r o m o t e t h e p i l o t p r o j e c t o f s a n d c o n t a i n m e n t a n dw a t e r e x c h a n g e .K e y w o r d s:T h eT e nK o n g d u i s;s o i l a n dw a t e r l o s s;d y n a m i c c h a n g e;s o i l a n dw a t e r l o s s c o n t r o l;g u l l y e r o s i o n党中央㊁国务院高度重视生态文明建设,特别是黄河流域的生态文明建设㊂2019年9月18日,在河南省郑州市召开了黄河流域生态保护和高质量发展座谈会,确定了黄河流域生态保护和高质量发展作为重大国家战略;2020年10月,中共中央国务院印发‘黄河流域生态保护和高质量发展规划纲要“; 2021年10月22日在山东省济南市召开了深入推动黄河流域生态保护和高质量发展座谈会并发表重要讲话;2022年9月8日印发‘中央财政关于推动黄河流域生态保护和高质量发展的财税支持方案“,对于做好黄河流域生态保护和高质量发展起到极其重要的作用㊂水土保持作为生态文明建设的重要组成部分,是黄河流域生态保护的主要内容,也是黄河高质量发展的基本保障[1-2]㊂根据‘中国水土公报(2021年)“显示,黄河流域现有水土流失面积2.59ˑ105k m2,占流域总面积的32.63%,是全国大江大河流域中水土流失占比最高的流域,流域水土流失率比全国平均水平高近5个百分点[3]㊂水土流失依然是黄河流域重要的生态问题,水流失量大面广,生态环境脆弱,流域生态屏障功能不强的局面没有根本改变[4]㊂此前,有众多学者从不同的尺度范围研究了黄河流域的水土流失及动态变化情况,包括流域尺度 黄河流域[5],区域尺度 黄河源区[6]㊁黄河中游多沙粗沙区[7-8],支流尺度 祖厉河流域[9]㊁无定河流域[10],小流域尺度 南小河沟[11]等㊂根据‘水利部水土保持监测中心印发<2020年水土流失动态监测技术指南>的通知“[12],黄河流域内支流流域面积大于1000k m2以上的76条支流中[13]有11条水土流失严重㊂其中水土流失最为严重,最难治理的为黄河中上游流经内蒙古西部等地,被拉出如弓一般蜿蜒的 几 字湾的十大孔兑,是由10条黄河一级支流组成,被称为 地球生态癌症 的砒砂岩,就在十大孔兑上游的砒砂岩地貌区,极易造成水土流失㊂年均向黄河输送泥沙约2.7ˑ107t,超过全国入黄泥沙总量的十分之一,是黄河内蒙古河段及下游 地上悬河 的直接制造者之一[14]㊂由于这些孔兑不属于大江大河,治理力度不足㊁统筹不够,整个区域荒漠化㊁沙漠化㊁水土流失仍较为严重,威胁黄河生态和地区发展安全㊂了解十大孔兑的水土流失面积㊁强度及分布特征,对于该区域水土流失综合防治㊁规划制定,推动十大孔兑区域山水林田湖草沙综合治理,筑牢中国北方重要生态屏障具有重要意义㊂1研究区概况1.1区域概况内蒙古黄河流域十大孔兑位于黄河河套内,地处东经108ʎ43' 110ʎ58',北纬39ʎ47' 40ʎ34'之间㊂行政区隶属于内蒙古鄂尔多斯市,涉及达拉特旗㊁杭锦旗㊁东胜区㊁准格尔旗等4个旗(区),流域总面积10767k m2㊂十大孔兑发源于鄂尔多斯台地,由南向北平行排列,直接流入黄河,从西向东依次为毛不拉孔兑㊁布尔嘎斯太沟㊁黑赖沟㊁西柳沟㊁罕台川㊁壕庆河㊁哈什拉川㊁母花沟㊁东柳沟和呼斯太河[15]㊂孔兑上游为丘陵沟壑区(面积4760.50k m2,占37.55%,中游流经库布齐沙漠,为风沙区(面积4042.60k m2,占37.55%,下游为冲积平原区(面积1963.9k m2,占18.24%)㊂十大孔兑水系分布状况见图1㊂注:本图基于自然资源部标准地图服务系统G S(2022)4309号标准地图校准制作㊂下同㊂图1十大孔兑水系分布F i g.1D i s t r i b u t i o no f r i v e r s y s t e mo fT e nK o n g d u i s1.2数据来源十大孔兑年度水土流失数据涉及1985,1999, 2020,2021年的水土流失数据㊂其中2020年和2021年水土流失数据和2021年植被覆盖数据:是基于当年的2m分辨率卫星遥感影像进行土地利用和水土保持措施专题信息提取和野外调查,在水力侵蚀061水土保持通报第43卷Copyright©博看网. All Rights Reserved.区利用中国土壤流失方程C S L E模型(7因子),在风力侵蚀区利用风力侵蚀模型(耕地㊁草(灌)地㊁沙地(漠)风力侵蚀模型),计算获取年度土壤侵蚀模数,根据‘土壤侵蚀分类分级标准(S L190-2007)“[16],分别获取2020年和2021年全国水土流失土壤侵蚀成果数据,利用软件镶嵌和裁切并统计,得到十大孔兑的水土流失面积及对应的强度等级㊂1999年水土流失数据:基于1998 1999年30m分辨率卫星影像进行专题信息提取和野外调查,水力侵蚀区根据土地利用㊁植被覆盖和坡度进行3因子计算获取,风力侵蚀区根据植被覆盖度和地表情况获取㊂1985年土壤侵蚀数据来源于1985年全国第一次土壤侵蚀遥感调查结果㊂2结果与分析2.1水土流失状况2.1.1植被覆盖度情况根据全国水土流失动态监测成果(表1)显示,2021年十大孔兑流域土地利用类型主要以林地㊁草地和耕地为主,面积分别为3757.00,3129.49,1993.26k m2,分别占监测范围土地总面积的34.90%,29.07%和18.51%,林草地面积占比达63.97%,略低于黄河流域园林草地植被面积占比5个百分点(69.14%)[17]㊂从植被覆盖度等级来看,十大孔兑流域主要以中低覆盖和低覆盖为主,分别占植被覆盖面积的48.85%和36.54%,中覆盖及以上的植被面积比例仅为14.61%,不足1/6㊂与黄河流域相比,黄河流域中覆盖及以上的植被面积比例为67.91%,虽十大孔兑流域内植被覆盖面积与黄河流域植被覆盖面积接近,但从植被质量来看,因十大孔兑所处的位置及恶劣的自然条件,导致该区植被质量远低于黄河流域平均水平,为黄河流域内生态环境最为脆弱的区域㊂从不同坡度等级园林草地植被覆盖分布来看,主要集中于<5ʎ和5ʎ~8ʎ坡度等级,比例分别为57.25%和22.30%㊂结合不同坡度等级㊁不同植被覆盖等级分布来看,虽然十大孔兑植被覆盖度低,但多数分布于低坡度等级,给流域植被建设和植被恢复带来了可能㊂表1十大孔兑2021年植被覆盖度统计结果T a b l e1S t a t i s t i c a l r e s u l t s o f v e g e t a t i o n c o v e r a g e o fT e nK o n g d u i s r i n2021项目高覆盖中高覆盖中覆盖中低覆盖低覆盖合计面积/k m253.08137.06815.773364.262516.326886.49比例/%0.771.9911.8548.8536.54100注:植被覆盖度等级根据‘年度水土流失动态监测技术指南“[18],其中水力侵蚀区园地㊁林地㊁草地等的植被覆盖度划分的范围为:高覆盖(ȡ75%)㊁中高覆盖(60%~75%)㊁中覆盖(45%~60%)㊁中低覆盖(30%~45%)㊁低覆盖(<30%);在风力侵蚀区,园地㊁林地㊁草地等的植被覆盖度划分的范围为:高覆盖(ȡ70%)㊁中高覆盖(50%~70%)㊁中覆盖(30%~50%)㊁中低覆盖(10%~30%)㊁低覆盖(<10%)㊂2.1.2年度水土流失状况2021年十大孔兑河流域水土流失面积4374.98k m2,占土地总面积的40.63%㊂其中,水力侵蚀㊁风力侵蚀面积分别为2481.77,1893.21k m2,分别占水土流失面积的56.73%,43.27%㊂从侵蚀强度分析,轻度㊁中度㊁强烈㊁极强烈㊁剧烈侵蚀面积分别为2592.92,1274.40,274.48,193.35,39.83k m2,分别占水土流失面积的59.27%,29.13%,6.27%,4.42%,0.91%;水力侵蚀中,轻度㊁中度㊁强烈㊁极强烈㊁剧烈侵蚀面积分别为1355.66,632.89,260.04,193.35,39.83k m2,分别占水力侵蚀面积的54.63%,25.50%,10.48%,7.79%,1.60%;风力侵蚀中,轻度㊁中度㊁强烈侵蚀面积分别为1237.26k m2, 641.51k m2,14.44k m2,分别占风力侵蚀面积的65.36%,33.88%,0.76%,均无极强烈和剧烈侵蚀㊂十大孔兑流域2021年度水土流失面积详见表2㊂土壤侵蚀分布状况见图2㊂图2十大孔兑流域土壤侵蚀分布F i g.2S o i l e r o s i o nd i s t r i b u t i o no fT e nK o n g d u i s2.1.3水土流失分布特征从不同土地水土流失分布来看,水土流失主要集中在草地㊁林地㊁耕地和其他土地4个地类上,分别占水土流失面积的30.82%, 28.04%,21.64%和16.20%,占水土流失总面积的161第3期张建国等:十大孔兑流域水土流失分布特征及防治对策Copyright©博看网. All Rights Reserved.96.69%,可以看出,该区水土流失主要以以上4类地类为主㊂其中耕地水土流失主要分布水浇地,主要是位于风力侵蚀区的水浇地,为易发生水土流失区域的地类,占耕地水土流失面积的83.57%;林地水土流失主要分布中低覆盖与低覆盖度,分别占林地水土流失面积的52.86%和33.56%,林地植被质量不高,覆盖度低,是林地发生水土流失的主要原因;草地水土流失主要分布在中低覆盖度与低覆盖度,分别占草地水土流失面积的48.04%和42.08%,同样草地植被质量不高,覆盖度偏低,是草地发生水土流失的主要因;其他土地水土流失主要分布在沙地,占其他土地水土流失面积的97.29%㊂表2 十大孔兑流域2021年水土流失面积及强度T a b l e 2 A r e a a n d i n t e n s i t y o f s o i l e r o s i o no fT e nK o n gd u i s i n2021k m 2侵蚀类型项目轻度中度强烈极强烈剧烈合计水土流失面积2592.921274.40274.48193.3539.834374.98比例/%59.2729.136.274.420.91100.00水力侵蚀面积1355.66632.89260.04193.3539.832481.77比例/%54.6325.5010.487.791.60100.00风力侵蚀面积1237.26641.5114.440 01893.21比例/%65.3633.880.760 0100.00 从十大孔兑水土流失面积大小来看,4个县级行政区中达拉特旗水土流失面积比例最大,占十大孔兑流域水土流失面积的77%,其次是杭锦旗和鄂尔多斯市东胜区,均占十大孔兑流域水土流失面积的10%;从十大孔兑流域内各个县级行政区水土流失面积占流域内各个县级行政土地总面积的比例来看,鄂尔多斯市水土流失面积比例较高,达47%,其次是达拉特旗,占43%,均高于十大孔兑流域水土流失面积占比(40.63%)㊂综上所述,十大孔兑中达拉特旗是水土流失最为严重的区域,也是十大孔兑治理的重点区域㊂2.2 水土流失动态变化及原因分析2.2.1 水土流失动态变化 由表3可见,与2020年度水土流失动态监测成果相比,十大孔兑流域水土流失面积减少46.32k m 2,减幅1.05%㊂其中,轻度㊁中度㊁强烈㊁剧烈面积减少18.31k m 2,20.73k m2,5.53k m 2,减幅分别为0.70%,1.60%,1.97%,1.44%;极强烈侵蚀面积增加1.10k m 2,增幅为0.05%㊂水土保持率由2020年的58.94%增加为2021年的59.37%,增加了0.43%㊂与1999年度水土流失动态监测成果相比,十大孔兑流域水土流失面积减少3664.53k m 2,减幅45.58%㊂其中,轻度侵蚀面积增加814.20k m 2,增幅45.77%;中度㊁强烈㊁极强烈㊁剧烈侵蚀面积分别减少721.32,1565.02,913.13,1279.26k m 2,减幅36.14%,85.08%,82.53%,96.98%㊂水土保持率由1999年的25.33%增加为2021年的59.37%,增加了34.03%㊂与1985年度监测成果相比,十大孔兑流域水土流失面积减少4958.03k m 2,减幅52.6%㊂其中,轻度㊁强烈㊁极强烈㊁剧烈侵蚀面积分别减少770.05k m2,1778.76k m 2,1724.46k m 2,836.44k m 2,减幅分别为22.77%,86.40%,89.92%,95.25%,中度增加151.68k m 2,增幅为3.27%㊂水土保持率由1985年的12.89%增加为2021年的59.37%,增加46.48%㊂表3 不同时期十大孔兑水土流失面积动态变化统计结果T a b l e 3 D y n a m i c c h a n g e s o f s o i l a n dw a t e r l o s s a r e a i nT e nK o n gd u i s 项目年份 水土流失面积/k m 2轻度中度强烈极强烈剧烈小计20212592.921274.4274.48193.3539.834374.98十大孔兑20202611.231295.13280.01193.2541.684421.319991778.721995.721839.51106.481319.098039.5119853381.281143.452058.771917.71878.129379.332021 2020-18.31-20.73-5.530.1-1.85-46.32动态变化2021 1999814.2-721.32-1565.02-913.13-1279.26-3664.532021 1985-770.05151.68-1778.76-1724.46-836.44-4958.032.2.2 原因分析 相比于1985年,2021年十大孔兑流域水土流失面积减少4958.03k m 2,减幅为52.86%,年均减少137.72k m 2㊂区域水土流失面积减少与十大孔兑流域水土流失综合治理分不开㊂该261 水土保持通报 第43卷Copyright ©博看网. All Rights Reserved.区域自20世纪80年代起,先后开展了黄河中游试点小流域㊁骨干坝工程㊁沙棘示范区㊁罕台川水土保持综合治理㊁黄土高原水土保持世行贷款项目㊁沙棘拦沙工程等水土保持项目[19],有效缓解了区域水土流失危害,提升了生态环境质量㊂十大孔兑所在的鄂尔多斯市,高度重视水土流失治理工作,深入贯彻落实习近平生态文明思想,践行 绿水青山就是金山银山 发展理念,依托重点治理项目,积极推进水土保持生态建设,推行的封山禁牧制度,生态修复成效显著㊂据研究,1990年植被覆盖度为20.76%,2000年为21.71%,2010年为25.92%,十大孔兑流域植被覆盖度呈现逐渐升高趋势[20]㊂2000,2010,2020年,十大孔兑的遥感生态指数均值分别为0.31,0.33,0.57,生态环境质量正在不断改善[21]㊂ 十三五 期间,鄂尔多斯市规划实施国家水土保持重点建设㊁京津风沙源治理二期㊁晋陕蒙砒砂岩区十大孔兑沙棘生态减沙,十大孔兑综合治理,沙棘经济林建设等17项工程项目,规划总投资达4.00ˑ109元,其中国家及自治区投资近2.00ˑ109元㊂5a新增水土流失综合治理面积6000k m2,减少土壤侵蚀量4.80ˑ107t,减少入黄泥沙2.40ˑ107t[22]㊂截至2021年底,根据全口径统计的水土流失治理数据,鄂尔多斯市累计完成水土流失治理面积3.48ˑ104k m2,2021年新增水土流失治理面积890k m2,其中新增水土保持造林面积356.4k m2,新增种草6.2k m2,新增封育治理面积504.7k m2㊂截至2016年年底,十大孔兑共有淤地坝359座,其中骨干坝149座㊁中型坝117座㊁小型坝93座,现有骨干坝拦沙潜力为1.14ˑ108t,平均剩余拦沙寿命为68a;中型坝拦沙潜力为1.78ˑ107t,平均剩余拦沙寿命为23a;小型坝拦沙潜力为4.83ˑ106t,平均剩余拦沙寿命为46a[23]㊂相比于2020年,2021年十大孔兑水土流失减少46.32k m2,减幅1.05%,减幅明显高于全国平均水平(0.69%),但与黄河流域减幅相比,略低于黄河流域的降幅(1.27%),一定程度上表明,十大孔兑是黄河流域内较难治理的区域㊂从2021年度新增水土流失治理措施来看,该区主要以造林㊁种草㊁封禁等治理成效见效慢的生物措施为主,少有见效快的工程措施,也是导致该区内21a高强度侵蚀面积相比2020年几乎未有减少的重要原因㊂与历史数据(1985年和1999年)相比,2020年和2021年该区强烈及以上高强度侵蚀面积减少较多,减幅较大,如2021年剧烈侵蚀面积减少95%以上,强烈面积减少85%以上,主要原因可能是2020年和2021年全国水土流失动态监测成果中未考虑黄河流域沟道侵蚀情况,导致十大孔兑流域水土流失高强度侵蚀减少较多㊂根据2011年黄河中游孤山川等重点支流水土保持监测项目成果显示,孤山川流域内沟蚀约占流域水土流失面积的60%,主要以高强度侵蚀为主,占沟蚀面积的89%,剧烈侵蚀面积占沟蚀面积的80%㊂十大孔兑所在的达拉特旗重点围绕 山水林田湖草沙 一体化生态建设的理念,在上游孔兑丘陵沟壑区治理中,采取 山顶植树造林戴帽子㊁山坡退耕种草披褂子㊁山腰兴修梯田系带子㊁沟底筑坝淤地穿靴子 的生态综合治理模式;在中游库布齐沙漠治理中,采取 南围㊁北堵㊁中切割 的治理模式;在下游黄河冲积平原治理中,按照 稳槽固滩 的治理模式推进㊂多种模式齐抓共管,有效地控制了局部地区水土流失,减少了入黄泥沙,改善了生态环境㊂从数据看变化㊁看成效,达拉特旗森林覆盖率和植被覆盖度由2001年的10.19%和64.4%上升至现在的28.9%和78.8%;累计完成水土保持综合治理面积2696k m2,建成堤防167k m, 十大孔兑 综合治理度由原来的18.3%提高至32.79%[24]㊂值得注意的是,自20世纪80年代以来,当地先后实施多个治理项目,上中游水土流失面积由1985年的9379k m2降至目前的4375k m2,生态环境得到一定改善,但并未实现根本性好转㊂该区域恶劣的自然条件,降雨少,降水年内㊁年际变化大,河道河床比降大,遇强降雨易形成冲击力和破坏力比较大的洪水,导致水土流失治理率偏低,区域内水土流失严重,依然是黄河流域水土流失治理进程中的难点和重点,更是区域水土流失治理中最难啃的硬骨头,实地调研可以发现整个区域荒漠化㊁沙漠化㊁水土流失等多重危害并存㊂3治理策略与建议3.1治理策略在实施黄河流域生态保护和高质量发展国家战略过程中,将十大孔兑综合治理列为生态治理重点工程,对有效减少黄河泥沙㊁促进区域经济社会发展㊁构筑中国北方生态安全屏障具有重要意义㊂基于此,作者认为十大孔兑治理的治理策略有以下几方面㊂(1)开展以沙棘种植为主的植被建设㊂沙棘生存能力强,能够适应十大孔兑区砒砂岩侵蚀沟谷的生态环境㊂沙棘生态工程已在十大孔兑实施了好多年,对减少十大孔兑入黄泥沙,改善区域生态环境,增加当地农民收入具有重要作用㊂因此,提高沙棘种植面积对于有效治理十大孔兑水土流失有着十分显著的361第3期张建国等:十大孔兑流域水土流失分布特征及防治对策Copyright©博看网. All Rights Reserved.生态效益同时促进区域生态环境整体改善和区域经济可持续发展有着积极的作用㊂(2)以淤地坝建设为重点的工程布局㊂推进淤地坝建设,实施除险加固工程,提升防洪标准,有效减少入黄泥沙㊂根据获批的 十大孔兑 综合治理2022年度水利项目,项目建设内容为新建31座淤地坝㊁综合治理5条小流域㊁升级改造4条孔兑入黄口㊁建立112处监测点㊂(3)以锁边固沙为前提的治沙策略㊂坚持乔灌草有机结合,建设库布齐沙漠锁边固沙工程,完善绿色防风固沙体系,形成生物阻隔带,阻止沙漠向北扩展㊂(4)大力推进拦沙换水试点工程㊂鄂尔多斯市 拦沙换水 试点工程是一种新型的水资源配置思路,通过拦沙换水试点工程,拦减入黄泥沙,有效缓解区域水资源短缺现状㊂3.2相关建议(1)优化十大孔兑监测站点布局㊂十大孔兑为水蚀风蚀复合区,该区内风沙区特别典型,目前十大孔兑流域内现有运行良好的监测站点1个(水蚀点),且缺失水风复合监测站点,远不能满足十大孔兑内土壤侵蚀规律观测及土壤侵蚀因子优化等需要,亟需优化十大孔兑监测站点布局㊂(2)实现水土流失精准预测㊂基于十大孔兑流域内监测站点的径流㊁泥沙㊁风沙㊁风速及降雨等观测数据,开展十大孔兑土壤侵蚀模型优化及参数本地化工作,形成适用于十大孔兑的土壤侵蚀模型,为流域水土流失准确预测提供支撑㊂(3)水土保持与水沙关系研究㊂开展十大孔兑水土保持与水沙变化及泥沙输移机制研究,包括:①基于小流域控制站的泥沙观测资料和本地化后的土壤侵蚀模型,开展小流域尺度内的水土流失与卡口站泥沙观测的比对工作,掌握小流域尺度的泥沙输机制;②基于十大孔兑水文站泥沙观测资料,结合小流域尺度的泥沙机制研究成果和流域内淤地坝拦沙状况,开展流域尺度水土流失与水沙关系研究,掌握流域泥沙产生的机理,为水土流失治理及泥沙调控提供支撑㊂[参考文献][1]曹文洪,张晓明.新时期黄河流域水土保持与生态保护的战略思考[J].中国水土保持,2020(9):39-42. [2]胡春宏,张晓明.黄土高原水土流失治理与黄河水沙变化[J].水利水电技术,2020,51(1):1-11.[3]中华人民共和国水利部.中国水土保持公报(2021年)[R].2022-7-13.[4]李晶晶,苏鹏飞,张建国.黄河流域生态保护和高质量发展规划区水土流失特征与防治对策[J].水土保持通报, 2021,41(5):238-243.[5]高云飞,张栋,赵帮元,等.1990 2019年黄河流域水土流失动态变化分析[J].中国水土保持,2020(10): 64-67,7.[6]殷宝库,曹夏雨,张建国,等.1999 2018年黄河源区水土流失动态变化[J].水土保持通报,2020,40(3):216-220,325.[7]高健翎,殷宝库,张建国,等.黄河中游多沙粗沙区水土流失动态变化分析[J].人民黄河,2016,38(10):111-114.[8]殷宝库,苏鹏飞,张建国,等.1985 2020年黄河中游多沙粗沙区水土流失动态变化[J].水土保持通报,2021,41(5):123-126.[9]李娜,李雷,白艳萍,等.祖厉河流域水土流失动态变化研究[J].中国水土保持,2022(8):7-9.[10]张栋,赵院,赵辉.黄河中游典型支流无定河流域水土流失动态监测[J].水土保持通报,2022,42(3):89-94,147.[11]许小梅,王鸿斌,赵嘉莹,等.2004 2016年南小河沟流域土壤侵蚀动态变化[J].中国水土保持,2019(2):53-55.[12]水利部水土保持监测中心.2020年度水土流失动态监测技术指南[S].北京:中华人民共和国,2020. [13]水利部黄河水利委员会.黄河流域综合规划(20122030年)[M].郑州:黄河水利出版社,2013:1. [14]恩浩.年均向黄河输沙2700万吨 十大孔兑 该治了[N].新华网,2022-1-18.[15]达古拉,史芮嘉.十大孔兑综合治理问题及经验探索[J].中国水土保持,2022(9):55-57.[16]中华人民共和国水利部.S L190-2007土壤侵蚀分类分级标准[S].北京:中国水利水电出版社,2008. [17]黄河水利委员会.黄河流域水土保持公报(2020年)[R].2021.[18]水利部水土保持监测中心.2021年度水土流失动态监测技术指南[S].北京:中华人民共和国,2021. [19]刘璐,郭月峰,姚云峰,等.十大孔兑上游土壤侵蚀空间分布及动态变化[J].水土保持研究,2021,28(4):34-41.[20]朱吉生,李纪人,黄诗峰,等.近30年十大孔兑流域植被覆盖度空间变化的遥感调查与分析[J].中国水土保持,2015(7):68-70.[21]滑永春,孙小添,白澳,等.基于遥感黄河流域内蒙古段十大孔兑生态环境质量监测评价[J].水土保持研究,2022,29(5):199-205.[22]张睿.鄂尔多斯:荒原披新绿水保惠民生[N].内蒙古新闻网.2017-10-17.[23]王丽云,马振刚,高云飞,等.近10a来十大孔兑现状淤地坝拦沙作用分析[J].人民黄河,2018,40(9):89-92.[24]郭彩梅,贺龙.喜迎党的二十大㊃鄂尔多斯新答卷:小流域 治 出大效益[N].鄂尔多斯新闻网,2022-09-07.461水土保持通报第43卷Copyright©博看网. All Rights Reserved.。
山地水土流失的影响因素及其若干机理
山地水土流失的影响因素及其若干机理王利民;翁伯琦;罗涛;黄东风;栗方亮;罗旭辉【摘要】综述了山地生态系统的特征,并系统介绍山地水土流失对侵蚀区的直接危害和对周边环境的间接威胁,同时深入分析了地形因子、气候条件、植被覆盖和人为活动等因素对山地水土流失的影响。
结果表明,坡度、坡长、降雨量、雨强、植被覆盖度、群落结构、人为经济社会活动和土壤性质是影响水土流失发生与发展的重要驱动因素。
各种影响因素可直接起到驱动作用,更多是多种因素综合作用而起到推动与加剧的作用,其内在机理包括植被与地形,土壤与降雨,降雨与植被,气候与系统,生产与干扰等方面相互关系与作用程度。
应进一步加强全球气候变化对水土流失产生新影响的研究,并辅以遥感等现代技术,旨在为土壤侵蚀预报和防控山地水土流失提供科学依据。
%Features of ecosystem in mountainous areas were summarized firstly ,and then the direct damage of soil erosion in mountainous areas to eroded areas and its indirect threat to surrounding environment were introduced .Meanwhile,the effects of topographic factors,climatic conditions, vegetation coverage,and human activities on soil erosion in mountainous areas were analyzed deeply .It is concluded that the extent of soil erosion is strongly influenced not only by slope length,slope gradient,precipitation,rainfall intensity,vegetative coverage,community structure,human e-conomic and social activities,and soil properties but also by the dynamics of the vegetation-landform,soil-rainfall,rainfall-vegetation,climate-eco-system,and production-interference interactions.Moreover,it is needed to investigate the responses of soil erosion to climate changes by modern technologies like remotesensing .This understanding of soil erosion mechanisms can provide scientific references for the prediction and control of soil erosion in hilly areas.【期刊名称】《安徽农业科学》【年(卷),期】2016(044)019【总页数】6页(P70-75)【关键词】水土流失;自然条件;人为因素;山地【作者】王利民;翁伯琦;罗涛;黄东风;栗方亮;罗旭辉【作者单位】福建省农业科学院土壤肥料研究所,福建福州350013;福建省农业科学院农业生态研究所,福建福州350013;福建省农业科学院土壤肥料研究所,福建福州350013;福建省农业科学院土壤肥料研究所,福建福州350013;福建省农业科学院土壤肥料研究所,福建福州350013;福建省农业科学院农业生态研究所,福建福州350013【正文语种】中文【中图分类】S157.1水土流失是在水力、风力、冻融和重力等外营力作用下,土壤表层及其母质被剥蚀、搬运和沉积的全过程,是各种原因导致生态退化的集中体现,其主要包括溅蚀、片蚀、细沟间侵蚀、细沟侵蚀、沟蚀、滑坡和河道侵蚀[1-2]。
基于USLE和GIS的水土流失敏感性空间分析以河北太行山区为例
基于USLE和GIS的水土流失敏感性空间分析以河北太行山区为例一、本文概述本文旨在利用通用土壤流失方程(USLE)和地理信息系统(GIS)工具,对河北太行山区的水土流失敏感性进行空间分析。
通过结合这两种强大的工具,我们希望能够更准确地评估该地区的水土流失风险,为土地管理、环境保护和可持续发展提供决策支持。
河北太行山区是我国重要的生态屏障,但由于地形复杂、气候多变、人类活动频繁,水土流失问题日益严重。
因此,开展水土流失敏感性空间分析对于该地区的生态保护和可持续发展具有重要意义。
本文首先介绍了USLE的基本原理和计算过程,包括降雨侵蚀力因子、土壤可侵蚀性因子、坡长坡度因子和植被覆盖与管理因子的确定方法。
然后,我们详细阐述了如何利用GIS技术进行空间数据处理和分析,包括地形数据的提取、土壤数据的分类、降雨数据的空间插值等。
在方法部分,我们将详细介绍如何结合USLE和GIS进行水土流失敏感性空间分析的具体步骤。
包括建立水土流失敏感性评价模型、确定评价因子权重、计算敏感性指数等。
我们将以河北太行山区为例,展示水土流失敏感性空间分析的结果,并分析其空间分布特征和影响因素。
通过本文的研究,我们期望能够为该地区的水土流失防治工作提供科学依据和技术支持。
二、研究方法和数据来源本研究采用修正的通用土壤流失方程(USLE)与地理信息系统(GIS)相结合的方法,对河北太行山区的水土流失敏感性进行空间分析。
USLE作为一种广泛使用的土壤侵蚀预测模型,其通过综合考虑降雨侵蚀力、土壤可蚀性、坡长坡度、植被覆盖及管理措施等因素,为水土流失的定量评估提供了有效工具。
结合GIS的空间分析功能,我们能够更加精准地识别和评估水土流失敏感区域,为区域水土保持和生态环境建设提供科学依据。
在具体操作中,我们首先利用GIS平台,对河北太行山区的地形地貌、土壤类型、植被分布等基础数据进行整合与预处理。
然后,基于USLE模型,构建水土流失敏感性评估模型,将各项影响因子进行量化并整合到GIS平台中。
探索水土保持工程中的水土流失模型
探索水土保持工程中的水土流失模型在水土保持工程领域,水土流失是一个重要的问题,对环境和生态系统产生巨大的影响。
为了更好地理解和解决水土流失问题,研究学者们提出了各种水土流失模型。
本文将探索水土保持工程中常用的水土流失模型。
一、模型一:USLE模型(通用土壤流失方程)USLE模型是较早建立的水土流失模型之一,它基于土壤流失的基本原理和土壤流失因素之间的相互关系。
USLE模型包含了降雨侵蚀力因子(R)、土壤侵蚀力因子(K)、坡面长度与坡度因子(LS)、作物和植被覆盖因子(C)以及管理措施因子(P),通过计算这些因子的值,可以得出土壤流失量的估计值。
二、模型二:RUSLE模型(修正通用土壤流失方程)RUSLE模型是USLE模型的升级版,它在USLE模型的基础上引入了更多的因素,以提高模型的准确性和适用性。
RUSLE模型考虑了长期降雨侵蚀力因子(R)、土壤侵蚀力因子(K)、坡度和坡长因子(LS)、土壤流失修正因子(C)以及管理措施修正因子(P),同时还考虑了土壤侵蚀的时空变化规律,可以更好地模拟实际情况下的土壤流失过程。
三、模型三:SWAT模型(小流域水文模型)SWAT模型是一种综合型的小流域水文模型,被广泛应用于水资源管理和环境保护中。
该模型结合了气象、土壤、植被和地形等多个要素,能够模拟流域内的地表径流过程和水土流失量。
SWAT模型通过输入不同的参数和数据,可以对不同地区的水土流失情况进行精确的预测和分析,为水土保持工程的实施提供科学依据。
四、模型四:MUSLE模型(修改通用土壤失蚀方程)MUSLE模型是一种基于降雨和径流关系的水土流失模型,它与RUSLE模型十分相似,但将降雨侵蚀力因子(R)替换为了径流侵蚀力因子(R)。
MUSLE模型通过分析地表径流的产生过程,考虑了不同地区的水文条件和土壤物理特性,提出了一种与降雨量相关的地表侵蚀力计算方法,可以更准确地估计水土流失量。
五、模型五:WEPP模型(水土保持评估程序)WEPP模型是一种基于物理过程的水土保持模型,广泛应用于不同地区和不同土地利用类型的水土流失研究。
德州武城高官屯输变电工程水土流失分析与预测
德州武城高官屯输变电工程水土流失分析与预测发布时间:2021-12-23T07:36:18.687Z 来源:《防护工程》2021年24期作者:刘亮亮樊庆[导读] 根据武城高官屯变电站施工现场勘查工程状况,结合产生水土流失的面积、预测的土壤侵蚀模数、预测水土流失时段,采用经验公式来计算土壤流失量。
刘亮亮樊庆延安水文水资源勘测中心 716000摘要:根据武城高官屯变电站施工现场勘查工程状况,结合产生水土流失的面积、预测的土壤侵蚀模数、预测水土流失时段,采用经验公式来计算土壤流失量。
关键词:土壤侵蚀模数;水土流失量预测1.工程概述武城高官屯110kV变电站位于武城县高官屯村,新建变电站布局为南北向布置,站区围墙内南北长87.0m,东西宽40.5m;变电站南侧为事故储油池、消防蓄水池、化粪池、集水池等辅助设施。
工程占地分为:变电站区、施工生产生活区、线路工程区、施工道路区。
2.水土流失现状根据《全国水土保持区划(试行)》,项目区属于北方土石山区(山地丘陵区)-华北平原区-黄泛平原防沙农田防护区,根据《土壤侵蚀分类分级标准》,项目区容许土壤流失量为200t/(km2?a)。
根据《全国水土保持规划国家级水土流失重点预防区和重点治理区复核划分成果》(办水保[2013]188号)及《德州市水土保持规划》(2018~2030年),确定项目区涉及黄泛平原风沙国家级水土流失重点预防区。
根据现场勘查发现,项目区水土流失以风蚀为主,兼有水蚀,侵蚀强度以轻度侵蚀为主,土壤侵蚀模数背景值为400t/(km2?a)。
3.水土流失量预测3.1预测单元根据项目分区,对占地地表产生扰动和损坏面积分别为:变电站工程区永久占地耕地(旱地)0.46hm2;施工生产生活区临时占地耕地(旱地)0.10hm2;线路工程区临时占地耕地(旱地)1.34hm2,临时占地林地(其他林地)0.18hm2;施工道路区临时占地耕地(旱地)0.87hm2。
综上所述,项目在建设过程中,将对占地地表产生扰动和损坏,扰动地表面积2.95hm2,损坏植被面积为0.18hm2。
林分空间结构
ORIGINAL ARTICLEAssessment of changes in the area of the water conservation forest in the Qilian Mountains of China’s Gansu province,and the effects on water conservationXiang Song •Changzhen Yan •Jiali Xie •Sen LiReceived:7October 2010/Accepted:20November 2011/Published online:3December 2011ÓSpringer-Verlag 2011Abstract The Qilian Mountains water conservation for-est in Gansu province is an important ecological barrier surrounding the oasis in China’s Hexi Corridor.The water they provide is the basis for the existence and sustainable socioeconomic development of those oases.As a result of unsustainable use of the water conservation forest until the 1980s,the oasis ecosystems of the Hexi region were seri-ously damaged,and the oasis areas experienced deterio-ration of their ecological environment.In this paper,Landsat images were used to monitor the temporal and spatial changes in area of water conservation in Qilian Mountains of China’s Gansu province and to assess the effect on water conservation by analyzed relationship between water conservation forest area,climatic data and hydrological data.The results showed that the forest cov-ered 15.1%of the study area in 2007and has followed different trends during the study period.From 1978to 1990,the forest area decreased;however,from 1990to 2007,the forest area increased,with a faster rate of increase from 1990to 2000,and the rate of increase averaged 2,733.89ha per year since 1990.The water conservation forest appears to play an important role in flood control,runoff regulation,the prevention of soil erosion,and water conservation;and these benefits increase with an increasing area of forest.Keywords Water conservation forest ÁWater conservation ÁQilian MountainsIntroductionA water conservation forest,which offers a variety of environmental benefits,is a special kind of soil and water conservation forest.It refers to the original forest (includ-ing the original forest and secondary forest)and plantations in the upstream catchment of rivers,reservoirs and lakes (Gao and Yu 2000).In addition to the usual ecological,economic,and social benefits of forests,it also protects a region’s water resources,controls flooding,prevents soil erosion,purifies the water,and regulates the climate (Kong et al.2009;Xin and Zhao 2004).The ecological functions and water conservation mechanism of a water conservation forest is a very complex physical process.By itself,the water conservation function of a water conversation forest is not powerful.However,due to its presence,a water conservation forest enhances regulation and storage mois-ture capacity of soil (Fan and Yu 2000).Meanwhile,the precipitation redistribution role of a water conservation forest is very clear as the water conservation forest plays an important role in the prevention of soil erosion,regulation peak,water purification and water conservation by changing the precipitation,precipitation intensity,and precipitation time,thus affecting the watershed hydrolog-ical processes.With the development of modern society,increasing demand for water resources and deterioration of the water environment,water shortage has become a global problem,which is a widespread concern (Jiang 1998);therefore,a water conservation forest with the primary purpose of water conservation has drawn increasing attention.In recent years,water shortage problems have become more severe in China,which strengthen the fact that protection and construction of water conservation forests is an effective way to achieve sustainable use of water resources (Ma and Zhu 2002).X.Song (&)ÁC.Yan ÁJ.Xie ÁS.LiKey Laboratory of Desert and Desertification,Cold and Arid Regions Environmental and Engineering Research Institute,Chinese Academy of Sciences,No.260West Donggang Road,Lanzhou 730000,Gansu Province,China e-mail:Songxiang@Environ Earth Sci (2012)66:2441–2448DOI 10.1007/s12665-011-1468-zChina’s Qilian Mountains are located at the intersection of the Qinghai–Tibet Plateau,the Mongolia Plateau,and the Loess Plateau.Because of this region’s unique natural environment and fragile forest ecosystems,the Qilian Mountains is an important nature reserve of China.These mountains serve as an important watershed for the Qing-hai–Tibet Plateau and China’s northwestern inland desert region.The water they provide is the basis for the existence and sustainable socioeconomic development of the oasis in China’s Hexi Corridor.The Qilian Mountain water con-servation forest is the main component of the regional ecosystem and plays an important role in water and soil conservation,conservation of biological diversity,and air purification,and serves many other ecological functions, such as water conservation,regulation of runoff,andflood control(Chang et al.2009).The environment of the water conservation forest is in the hinterland of Eurasia and is therefore isolated from the impact of oceans by the region’s tall mountains.In addition,the forest is surrounded by the region’s natural arid desert,steppe,sandy desert,and saline desert landscapes.These forests are mainly distributed in the mountains that run along the southern edge of the Hexi Corridor and are shaded to some extent by the Lenglong Ridge and the Daban Mountains,which lie to the east of the Qilian Mountains.The Qilian Mountains water conservation forest in an important ecological barrier of Hexi Corridor.As a result of unsustainable use of the water conservation forest until the 1980s,the oasis ecosystems of the Hexi region were seri-ously damaged,and the oasis areas experienced deterioration of their ecological environment,with rivers drying up,soil erosion increasing,frequentfloods and droughts,and inva-sion of farmland by southern deserts.The authors’previous research also showed that the trend of land desertification is presently increased in Heihe River basin from1978to1990; it had more than40km2of net raise resulting from land desertification.If the function of water conservation pro-vided by the conservation forest ecosystems is lost,the Hexi Corridor oasis ecosystems will become increasingly vul-nerable to collapse.In this study,Landsat images obtained in 1978,1990,2000,and2007were used to monitor the changes in the area of the water conservation forest in the Qilian Mountains and the resulting effects on soil and water conservation.The objective of this paper was to provide a scientific basis for future protection,management,and comprehensive utilization of this forest and sustainable development of the oasis areas of the Hexi Corridor. Study areaThe Qilian Mountains are located in the southern portion of China’s Hexi Corridor,in Gansu province.The climate is divided among cold arid and semi-arid areas,and both temperature and precipitation exhibit strong vertical and horizontal gradients.The average annual temperature in the study area ranges from-0.6°C to2.0°C(Che et al.1996), with a maximum temperature of28.0°C,a minimum temperature of-36.0°C,and July temperature ranging from10.0to14.0°C(Gao2003).The annual frost-free period is90–120days.Annual precipitation ranges from 300to600mm,of which more than60%is concentrated in the June to September period.The mean annual relative humidity is60%,and annual evaporation is about1,200mm (Zhang and Zhou2003).The water conservation forest is mainly distributed from 2,300to3,800m in altitude(Wang et al.2001);therefore, a digital elevation model(DEM)obtained from the Global Land Cover Facility(GLCF;)was used to select areas more than2,300m above sea level as this study area.The forest in this study was located between 97°220E and103°400E,and between36°450N and39°400N. This covers parts of the Tianzhu Tibetan Autonomous County,Su’nan,Gulang,Shandan,Minle,and Yongchang counties,and Wuwei City.(Note that in China,cities cover large areas and are the equivalent of a western regional municipality)The forest covers a total area of28,210km2, equivalent to about6%of Gansu province’s total land area (Fig.1).The main forest species in the Qilian Mountains include Picea crassifolia,Sabina przewalskii,alpine shrubs,and bushes in the low hill.A total of7.26billion m3 of water(average annual runoff)flowed through the Shiyang,Heihe,and Shule river systems(Chang et al. 2009),sustaining the four million people who live in the oasis of the Hexi Corridor.Materials and methodsData sourcesIn this study,three sets of data were used:Landsat TM images with a spatial resolution of30m from1990and 2007,Landsat ETM images with the same spatial resolu-tion from2000,and Landsat MSS images with a spatial resolution of60m from1978.As it was difficult to acquire cloud-free images that covered the whole study area in a given year due to the frequency of cloudy weather in the Qilian Mountains,some images from the previous or sub-sequent year were chosen to replace unsuitable images from a given year.Some images acquired from the China–Brazil Earth Resources satellite(/ n16/n92006/index.html),which have characteristics and spatial resolution similar to those of the Landsat images, were also used as a reference to confirm the results of our interpretation of the Landsat data.Digital topographic and thematic maps were also used by scanning pre-existing 1:100000maps of climatic zones,vegetation,and forest types,and these images were used for geometric correction of the satellite images and to confirm the classification results.A DEM acquired from GLCF,with a spatial resolution of 90m,was also used to confirm interpretations of the study area and slope aspects.Climatic and hydrological data were also obtained for use in analyzing the effects and causes of changes in the area of the water conservation forest.Image pre-processingAccording to the characteristics of different Landsat image bands and statistical characteristics,all satellite images were used to create false-color composite images using bands 4(the most appropriate vegetation monitoring),5(the maximum amount of information),and 3(red,green,and blue,respectively).Using the Image Analyst function of the Modular GIS Environment (MGE)software (Inter-graph Corporation,Huntsville,Alabama,US),the 2000ETM images were georeferenced and othorectified using 50–60ground control points (GCPs)derived from a 1:100000topographic map.The mean positional error for this georectification was less than 1pixel (i.e.,\30m).The 1990TM images to the 2000images were then matched by means of an image-to-image matching method.During the process,40–50GCPs in 1990and 2000were randomly selected to cover most of the area represented by the two sets of images.The root-mean-square (RMS)error of the geometrical rectification between the two images was lessthan 2pixels (i.e.,\60m)for plains areas and less than 3pixels (i.e.,\90m)for mountainous regions.The same method was used to process the 2007TM images and the 1978MSS images.The RMS error of the MSS images was less than 2pixels (i.e.,\120m)for plains areas and less than 3pixels (i.e.,\180m)for mountainous regions.A second-order transformation based on the nearest-neighbor method to resample the images was used to produce 30930m pixels for the TM and ETM images and 60960m pixels for the MSS images.Forest classificationIn this study,a classification system of four forest types (coniferous forest,broad-leaved forest,mixed coniferous,and shrubs)were used (because of their similar spectral characteristics,the alpine and low-elevation shrubs were combined into a single category during this study;Table 1).The visual interpretation method was used to derive the forest information.Although the visual interpretation of TM,ETM,and MSS images is labor intensive and time con-suming,the mapping accuracy of this method is higher than that of image classification using only the algorithms pro-vided by image-processing software because of the low spatial and spectral resolution of TM,ETM,and MSS images (Liu 1996;Liu et al.2003,2005;Zhuang et al.1999).Manual visual interpretation and digitization of the TM and ETM images at a scale of 1:100000and manual visual interpretation and digitization of the MSS images at a scale of 1:250000were performed.The abovementioned ancil-lary materials (regional land-use maps,topographicmaps,Fig.1Location of the study areaclimatic zone data,and vegetation maps)were used to assist in labeling the map patches during the interpretation process.During interpretation,the following mapping principles were adopted:(1)the minimum mapping patch was797pixels(approximately292mm2on the maps);(2)the deviation of delineating locations was less than1pixel on the screen;and(3)the accuracy of labeling patches was greater than95%based on our ground-truthing results.After interpretation and digitization were complete, the change in forest area between years was derived for each pixel by comparing the all patches between pairs of consecutive years.Fifteen percent of patches were randomly selected to evaluate the classification accuracy by comparing the land-scapes photographs with GPS coordinates obtained byfield survey,and classification accuracy is greater than95%. ResultsStatus of the region’s forests in2007In2007,forest covered480,366.36ha,amounting to 15.1%of the total study area.Among all counties and cities,this proportion was highest(52.5%)in Su’nan County,and the lowest(0.3%)was in Gulang County (Table2).At the range of altitudes in the study area,only coniferous forest and shrub communities were found.The proportions of coniferous forest and shrubs were51.3and 48.7%,respectively.Coniferous forests were mainly dis-tributed on mountain slopes at relatively low altitude, whereas shrubs were found at relatively high altitudes and on southern slopes with relatively low altitude.Figure2 shows that the coniferous forest was most abundant in Su’nan County(50.6%of the total area of this forest type) and Tianzhu County(32.4%),whereas shrubs were most abundant in Su’nan County(54.6%),Tianzhu County (14.6%),and Shandan County(11.5%).Changes in the area of forest since1978From1978to1990,the area of forest decreased by15 917.4ha,representing an average rate of decrease of 1,326.45ha per year(i.e.,0.3%of the original area).The areas of coniferous forest and shrubs decreased by8,428.31 and7,489.04ha,respectively,both representing3.4%of the original area.The forest cover totaled only14.2%of the study area which was the lowest value during the study period.From1990to2007,the area of forest increased by 30,667.85ha,representing an average rate of1,803.99ha per year(i.e.,0.4%of the original area).The forest area increased faster from1990to2000than from2000to2007, by27333.89ha(an average of2,733.89ha per year, amounting to0.6%of the original area).From1990to 2007,the area of shrubs increased more quickly than the area of coniferous forest,by a total of23,189.39ha,which amounted to75.6%of the total increase in forest area (Table3).This suggested that woodland restoration is more difficult than shrub restoration in an ecologically fragile region such as the study area.Table1Classification of the forest types in the Qilian Mountains Type DescriptionConiferous Coniferous,canopy cover C30%,height C2m,distance between rows B8mBroad-leaved forest Broad-leaved forest,canopy cover C30%,height C2m,distance between two rows B8mMixed coniferous Mixed coniferous forest,canopy cover C30%, height C2m,distance between two rows B8mShrub Shrubs and coppice forest,canopy cover C30%,height B2m,distance between two rows B8mTable2The areas of forest in the study area in2007Area Forest type All categories of forestcombinedConiferous ShrubArea(ha)%of totalconiferousArea(ha)%of totalshrubArea(ha)%of totalarea Yongchang County6,349.16 2.587,734.13 3.3114,083.29 2.93 Su’nan County124,776.8650.64127,627.6054.55252,404.4652.54 Minle County13,492.21 5.4819,027.048.1332,519.24 6.77 Shandan County11,844.49 4.8126,863.5311.4838,708.018.06 Wuwei City9,418.63 3.8217,587.297.5227,005.91 5.62 Gulang County681.210.28920.880.391,602.100.33 Tianzhu County79,854.4832.4134,188.8714.61114,043.3423.74 Total246,417.03100.00233,949.33100.00480,366.3615.12Water conservation by the Qilian Mountains forests In this study,climatic data recorded at the Qilian (38°110N,100°150E)and Yeniugou (38°250N,99°350E)weather sta-tions and hydrological data recorded at the Yingluoxia hydrological station (38°490N,100°110E)were used to evaluate the water conservation effect of the forests in the upper reaches of the Heihe River.However,the correlation (R 2=0.6921,P \0.05)between runoff and precipitation recorded at the Qilian weather station was greater than the correlation (R 2=0.5127,P \0.05)between runoff and precipitation recorded at the Yeniugou weather station;therefore,only precipitation data from the Qilian weather station were used in the subsequent analysis.Only the factor of precipitation was used;the runoff is proportional to precipitation.Figure 3shows two periods in which runoff decreased greatly (1989to 1991and 1998to 2001).Although a decrease in precipitation was accompanied by a decrease in runoff,the times of mini-mum runoff and minimum precipitation were different from those of 1998to 2001,and the rate of decrease was slower than it was from 1989to 1991,possibly because of the large increase in forest area during this period.It was determined that although precipitation was higher in 1998than in 1989,the runoff was smaller in 1998.This sug-gested that the water conservation forest played an important role in flood control and regulating runoff vol-umes at an interannual scale.According to distribution of the runoff in a hydrological year,a hydrological year was divided into three periods,which included low flow period,snowmelt runoff period,and flood period.The runoff in the low flow period is mainly from the underground runoff conservation by for-est.The greater proportion of runoff in this period indi-cated a stronger effect of the water conservation forests (Wang et al.1999).The runoff from September to next January is mainly affected by the water conservation forest in the study area (Wang et al.1999);therefore,the pro-portion of total runoff during September to December was used to evaluate the effect of water conservation also.Figure 4shows that from 1975to 1992,this proportion decreased,whereas from 1992to 2007,theproportionFig.2Map of forestdistribution in the study area in 2007Table 3The changes in the area of forest from 1978to 2007in the study area Type1978199020002007Area (ha)%of total area Area (ha)%of total area Area (ha)%of total area Area (ha)%of total area Coniferous 247,356.887.79238,928.577.52245,306.617.72246,417.037.76Shrub 218,248.98 6.87210,759.94 6.63231,715.797.29233,949.337.36Total465,605.8614.66449,688.5114.15477,022.4015.01480,366.3615.12increased.These changes paralleled the changes in the area of forest,suggesting that the degree of water conservation by the forest was proportional to the area of forest.The precipitation and runoff data from 2years (1989and 1998)in which the maximum precipitation and runoff occurred were used to analyze the effect of the water conservation forest on an annual scale.Figure 5a,b shows that precipitation increased most rapidly starting in March and April,which began to decrease in July,and did not decrease to the April level until October.From April to July,precipitation and runoff increased continuously,but the simultaneous increase in runoff was slower than the increase in precipitation.Expression (1)was used to cal-culate the ratio of runoff to precipitation to estimate the ability of producing runoff of precipitation.As only a ratio was calculated to compare the value in different months,difference of units of runoff and precipitation were not considered.To avoid decimal,the result was increased to 100times.Based on the ratio of runoff to precipitation (Fig.5c),it is found that as the area of forest increased,the ratio of runoff to precipitation decreased between March and July.In other words,the same intensity of rainfall produces less runoff when the area of the water conser-vation forest is larger.Therefore,the region’s water con-servation forest has a significant flood control effect and can potentially prevent soil erosion as a result of this change.Ratio ¼runoffprecipitationÂ100ð1ÞDiscussion and conclusionsThe study used Landsat data to monitor the temporal and spatial changes in area of water conservation in Qilian Mountains of China’s Gansu province and assessed the effect on water conservation by analyzed relationship between the water conservation forest area,climatic data,and hydrological data.The results showed that 1.In 2007,forest covered 480,366.36ha of the study area (15.1%of the total area).Only coniferous forest and shrub communities distributed in the study area.The proportion of the area covered by coniferous forest was slightly larger than the proportion of shrubs.2.The area of forest decreased from 1978to 1990,by an average of 1,326.45ha per year.From 1990to 2007,the area of forest increased significantly,particularly from 1990to 2000,with an average increase of 2,733.39ha per year since 1990.3.The runoff decreased significantly,particularly from April to July,as the area of forest increased.4.The changes of the proportion of total runoff during September–December paralleled the changes intheFig.3The changes in annual precipitation and annual runoff in the upper reaches of the HeiheRiverFig.4The change in theproportion of total annual runoff that occurred from September to Decemberarea of forest,suggesting that the degree of water conservation by the forest was proportional to the area of forest.The hydrological response with respect to rainfall–runoff processes is very complicated.It is dependent on many factors such as climate,precipitation,rainfall intensity,vegetation cover and its structure,and topo-graphical features as well as by different scales (Bi et al.2009).The water conservation forest appears to play an important role in flood control,runoff regulation,the prevention of soil erosion,and water conservation.Although these benefits increase with an increasing area of forest,it cannot explain that changes in the water conservation forest area are a major factor to impact water conservation function.Since the beginning of the study of the relationship between forest and water,since the early twentieth century,water conservation function of forests has been the focus of the study of the ecology and hydrology,and a large number of papers have been published (Andreassian 2004;Gao andYu 2000;Nunez et al.2006).Although a larger number of studies show that forest cover increased to reduce the runoff (Bosch and Hewlett 1982;Stednick 1996;White-head and Robinson 1993)as an important part of forest ecology,the effects on the ecology of the water conser-vation forest has been the community’s consensus.Because China is facing severe ecological and envi-ronment problems,especially water shortage and severe soil erosion,the Chinese government has made great effort to solve these problems.For example,several large-scale forestation programs were initiated in the late 1990s to protect and restore various ecological functions of forests,such as ‘‘The Three-North Shelter Forest Programme’’and ‘‘Natural Forest Protection Project’’.A closed forest,which is an effective way to recovery and growth of vegetation in a short-term,is a major ecological environment rehabili-tation measure of those forestation programs.It is the direct ecological effects of vegetation change better that included forest cover increased,prevention of soil erosion and water conservationenhancement.Fig.5a Changes inprecipitation and runoff during the year in 1989.b Changes in precipitation and runoff during the year in 1998.c Changes during the year in the ratio between runoff andprecipitation in 1989and 1998Acknowledgments This research was supported by the China National Key Basic Research Program(2009CB421301).The authors also thank Mr.Geoff Hart for his detailed edits of the manuscript. ReferencesAndreassian V(2004)Waters and forests:from historical controversy to scientific debate.J Hydrol291(1–2):1–27Bi H,Liu B,Wu J,Yun L,Chen Z,Cui Z(2009)Effects of precipitation and landuse on runoff during the past50years in a typical watershed in Loess Plateau,China.Int J Sediment Res 24(3):352–364Bosch J,Hewlett J(1982)A review of catchment experiments to determine the effect of vegetation changes on water yield and evapotranspiration.J Hydrol55(1–4):3–23Chang J,Niu Z,Wang Q(2009)Study on changes in water resources and ecological pretection in Qilian Mountains.Gansu Water Consrevancy Hydropower Technol45(007):1–2(in Chinese with English abstract)Che K,Fu H,Wang J(1996)Positioned research on ecosystem of water conservation forest in Qilian Mountains.J Gansu For Sci Technol21(004):1–12(in Chinese with English abstract)Fan Z,Yu X(2000)Chinese water conservation forest ecosystem evaluation and construction technology system.World For Res 13(001):51–58(in Chinese with English abstract)Gao F(2003)Survey natural regenration of water conservation forest in Qilian Mountains.J Gansu For Sci Technol28(004):55–57(in Chinese with English abstract)Gao C,Yu X(2000)Review on researchs of water conservation forests.J Beijing For Univ22(5):78–82(in Chinese with English abstract)Jiang W(1998)Value of water.Science Press,BeijingKong W,Zhou B,Xu S,Cai X,Li B(2009)Study on ecological and hydrology effects of water conservation forest.J Mod Agric Sci Technol6:235–236(in Chinese with English abstract)Liu J(1996)Macro-scale survey and dynamic study of natural resources and environment of China by remote sensing.China Sci Technol Publ H,Beijing Liu J,Liu M,Zhuang D,Zhang Z,Deng X(2003)Study on spatial pattern of land-use change in China during1995–2000.Sci China Ser D Earth Sci46(4):373–384Liu J,Liu M,Tian H,Zhuang D,Zhang Z,Zhang W,Tang X,Deng X (2005)Spatial and temporal patterns of China’s cropland during 1990–2000:an analysis based on Landsat TM data.Remote Sensing Environ98(4):442–456Ma Y,Zhu Z(2002)Strengthen the construction of water conserva-tion forests sustainable use of water resources.Qinghai Agric For Technol003:25–25(in Chinese with English abstract) Nunez D,Nahuelhual L,Oyarzun C(2006)Forests and water:the value of native temperate forests in supplying water for human consumption.Ecol Econ58(3):606–616Stednick JD(1996)Monitoring the effects of timber harvest on annual water yield.J Hydrol176(1–4):79–95Wang J,Che K,Yan K,Wang Y,He H(1999)Analysis of the runoff components in the forestry areas of the Qilian Mountains and their temporal and spatial variation.J Glaciol Geocryol 21(1):59–63(in Chinese with English abstract)Wang J,Zhang X,Zhang H,Wang Y,Jin M(2001)Water conservation forest composition and growth condition in Qilian Mountains.J Northwest For Univ16:4–7(in Chinese with Englishaabstract)Whitehead P,Robinson M(1993)Experimental basin studies—an international and historical perspective of forest impacts.J Hydrol145(3–4):217–230(in Chinese with English abstract) Xin Y,Zhao Y(2004)Advances in studies of water conservation forest’s ecohydrological effects.Prot For Sci Technol2:23–26 (in Chinese with English abstract)Zhang M,Zhou L(2003)The forest ecosystem service and their valuation on Qilian Mountain.J Gansu For Sci Technol 28(1):7–9(in Chinese with English abstract)Zhuang D,Liu J,Liu M(1999)Research activities on land-use/cover change in the past ten years in China using space technology.Chin Geogr Sci9(4):330–334。
- 1、下载文档前请自行甄别文档内容的完整性,平台不提供额外的编辑、内容补充、找答案等附加服务。
- 2、"仅部分预览"的文档,不可在线预览部分如存在完整性等问题,可反馈申请退款(可完整预览的文档不适用该条件!)。
- 3、如文档侵犯您的权益,请联系客服反馈,我们会尽快为您处理(人工客服工作时间:9:00-18:30)。
PlantSpatialPatternPredictsHillslopeRunoffandErosioninaSemiaridMediterraneanLandscape
SusanaBautista,*A´ngelesG.Mayor,JamalBourakhouadar,andJuanBellotDpto.deEcologı´a,UniversidaddeAlicante,Apdo.99,E-03080Alicante,SpainABSTRACT
Theimportanceofthespatialpatternofvegetationforhydrologicalbehaviorinsemiaridenvironmentsiswidelyacknowledged.However,thereislittleempiricalworktestingthehypotheticalcovariationbetweenvegetationspatialstructureandhillslopewaterandsedimentfluxes.Weevaluatedtherelationshipsbetweenvegetationstructuralattri-butes(spatialpattern,functionaldiversity),soilsurfaceproperties(crust,stone,plant,andgroundcover,andparticlesizedistribution)andhillslopehydrologicfunctioninginasemiaridMediterra-neanlandscape;inparticular,wetestedwhetherdecreasingpatchdensityorcoarseningplantspatialpatternwouldincreaserunoffandsedimentyieldatthehillslopescale.Runoffandsedimentyieldweremeasuredovera45-monthperiodonnine8·2-mplotsthatvariedinvegetationtypeandspatialpattern.Wegroupedvegetationintofunc-tionaltypesandderivedplantspatialpatternattri-butesfromfieldplotmapsprocessedthroughaGIS
system.Wefoundthattherewasaninverserela-tionshipbetweenpatchdensityandrunoff,andthatbothrunoffandsedimentyieldsincreasedasthespatialpatternofvegetationcoarsened.Vege-tationpatternattributesandplantfunctionaldiversitywerebetterrelatedtorunoffandsedimentyieldthansoilsurfaceproperties.However,asig-nificantrelationshipwasfoundbetweenphysicalcrustcoverandplantspatialpattern.Ourresultspresentempiricalevidenceforthedirectrelation-shipbetweenthehydrologicfunctioningofsemi-aridlandsandboththespatialpatternandthefunctionaldiversityofperennialvegetation,andsuggestthatplantspatialpattern,physicalcrustcover,andfunctionaldiversitymaybelinkedthroughfeedbackmechanisms.
Keywords:ecohydrology;spatialpattern;runoff;erosion;plantfunctionaldiversity;ecosystemfunctioning;surfaceproperties;semiaridhydrology.
INTRODUCTION
Itiswidelyacceptedthatvegetationstronglyaffectshydrologicprocesses.Manystudieshaveshownthenegativerelationshipbetweenplantcoverandrunofforsedimentyield(see,forexample,ElwellandStocking1976;Thornes1990).Plantcanopyandgroundcoveraretheparametersthathavemostcommonlybeenusedinthestudyoftheeffect
ofvegetationonwaterandsedimentfluxes.How-ever,especiallyindrylandswithpatchyvegetation,otherlandscapemetricsmayhaveanimportantinfluenceinthehydrologicbehavior.Thus,strongecohydrologiclinkagesbetweenplantspatialpat-ternandrunoffanderosionhavebeenpointedoutforseveraldrylandenvironments(Abrahamsandothers1995;LudwigandTongway1995;Davenportandothers1998;CammeraatandImeson1999;Wilcoxandothers2003;Puigdefa´bregas2005).Inaridandsemiaridlandscapes,thevegetationiscommonlydistributedinpatchesinterspersed
Received7December2006;accepted14June2007;publishedonline7
August2007.*Correspondingauthor;e-mail:s.bautista@ua.es
Ecosystems(2007)10:987–998DOI:10.1007/s10021-007-9074-3
987withinamatrixofbaregroundandlowvegetationcover.Ingeneral,therearedifferencesinsoilpropertiesbetweenvegetationpatchesandopenareasthatmayexertanimportantinfluenceonsoilandwaterfluxes.Soilsbeneathvegetationpatchesarecommonlycharacterizedbyhighersoilorganiccontent,totalporosityandsoilaggregatestability,lessdevelopedmineralandbiologicalsoilcrusts,andlowersurfacecompactionthansoilsinthein-terpatchareas(Greene1992;Bochetandothers1999;Puigdefa´bregasandothers1999;Schlesingerandothers1999;Maestreandothers2001,2002).Thesedifferencescommonlyresultinlowerrunoffandsedimentyields,andhighersoilmoisturecontentsinvegetationpatchesthaninopenareas(LudwigandTongway1995;Puigdefa´bregasandSa´nchez1996;Cerda`1997;Bergkamp1998;Reidandothers1999;BharkandSmall2003;Bochetandothers2006).Athillslopeandcatchmentscales,otherhydrologicprocessessuchasreinfil-trationandconcentrationofsurfacerunoffhavetobetakenintoaccount.Vegetationpatternswithhighpatchdensitycanbeexpectedtoinvolveimportantobstructionstothesurfaceflowandthereforeincreasedopportunitiesforreinfiltration.Incontrast,inlowpatchdensitypatterns,thesur-faceflowismorelikelytopresentahighercon-centrationandthusahighervelocitybecausethebaresurfacesarelargerandpotentiallymorecon-nected(TongwayandLudwig1997;CrossandSchlesinger1999).Moreover,feedbackslinkingthespatialpatternsofvegetationandsoilpropertiescanexacerbatetheeffectofplantpatternonwaterflowsanderosion,asthesurfacesoildegradationandthelossofwaterandnutrientsresultingfromenhancedrunoffanderosioninlow-densitypat-ternsmayinturnadverselyimpactthevegetationandfurtherreducethepatchdensity.Similarmechanismshavebeenconsideredinconceptualmodelsthatrelatethresholdsinsoilerosionratestotheconnectivityofinterpatchareas(Davenportandothers1998).Recentsimulationmodelinghasalsoshownthathillslopeswithclumpydistribu-tionsofvegetationyieldmorerunoffanderosionthanidenticalhillslopeswithspatiallyuniformdistributions,althoughthesedifferencesdecreaseforstormsofhighmagnitude(BoerandPuigdefa´-bregas2005).Thissimulationapproachalsoshowsthatfine-grainedvegetationpatternsaremoreefficientthancoarse-grainedpatternsincapturingwaterandsedimentfluxes,assuggestedbyseveralpreviousfieldobservations(Abrahamsandothers1995;Wainwrightandothers2000).Plantspatialpatternhasalsobeenshowntoberelatedtokeystructuralvariablesasspeciesrich-