中国社会统计年鉴2018指标数据:10_8_分地区供水水情况_2017年_
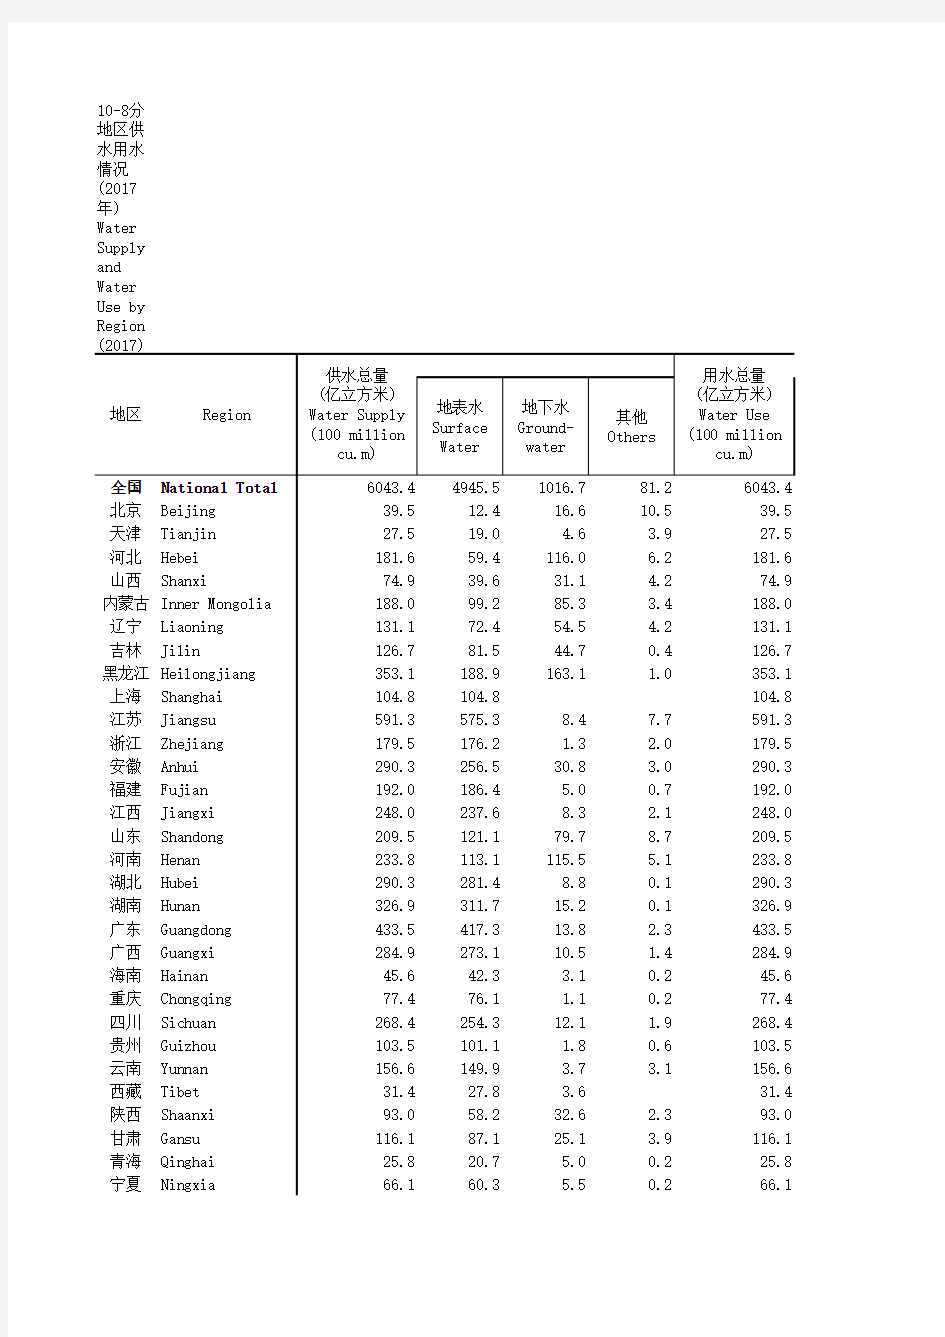

10-8分地区供水用水情况(2017年) Water Supply and Water Use by Region
注:生态用水仅包括部分河湖、湿地人工补水和城市环境用水。Note: Water use by ecologi cal protect ion only include s
artific ial supplem ent of river & lake, wetland and
city entiron ment.
5.1 3.518.312.7181.9 10.7 5.5
6.1 5.2176.3 126.120.32
7.0
8.2242.3 45.513.512.8 3.0202.9 138.115.711.023.1744.7 81.618.625.4 5.529
9.8 89.818.114.1 4.7465.0 316.419.715.4 1.5930.7 16.762.724.60.8433.3 280.6250.158.5 2.1737.8 80.946.147.0 5.5319.2 158.292.233.8 6.2466.3 91.264.433.2 3.2493.3 156.360.528.9 2.3538.3 134.028.834.612.0210.0 122.851.040.219.8244.9 148.187.853.2 1.2492.6 193.786.044.5 2.8477.8 220.3107.0100.9 5.3391.1 195.846.040.2 3.0586.0 33.3 3.08.40.8494.8 25.430.420.5 1.1252.8 160.551.450.7 5.8324.1 58.924.818.80.9290.1 108.523.421.7 3.1327.2 26.9 1.5 2.70.2940.8 58.214.317.0 3.5243.2 92.310.48.7 4.7443.5 19.2 2.5 2.9 1.2433.1 56.7 4.5 2.3 2.5974.3
514.413.114.710.22280.8