作文小作文雅思
雅思小作文大全及范文

101.You should spend about 20 minutes on this task.The line graph below gives information about the number of visitors to three London museums between June and September 2013.Summarise the information by selecting and reporting the main features, and make comparisons where relevant.Write at least 150 words.Test TipCheck the horizontal axis to find whether the graph refers to past, present, future or all three.We use the present simple to describe the graph: The graph … , We can see … showsIf the graph refers to past period of time,we use the past simple,andif the graph includes future times,we use will or it is predicted.that Look at the line graph and complete the text with the correct forms of the verbs in brackets and the correct prepositions.The graph shows(show) how many people visited(visit) three London museums in the summer of 2013. Most visitors went(go) to the British museum between June and September. The number fluctuated(fluctuate) between 500 and 750. By contrast, the Science Museum and the Natural History Museum received(receive) fewer visitors. The number of people who visited the Science Museum dropped(drop) gradually from 400 thousand to 300 from June to August then rose(rise) to 450 thousand in September. We can see(see) that the trend for the Natural History Museum was(be) similar. There was a sharp drop in visitors from June to July. The number remained stable(remain stable) in August and then increased(increase) steadily in September.102.You should spend about 20 minutes on this task.The chart below shows the percentage change in the share of international students among university graduates in different Canadian provinces between 2001 and 2006.Summarise the information by selecting and reporting the main features, and make comparisons where relevant.Write at least 150 words.Source:Statistics Canada,Postsecondary Student Information SystemTest TipIn Task 1 of the IELTS Writing modules, you may be asked to describe a graph which shows changes over a period of time. To do this you need to use language expressing change and appropriate tenses. In the exam, make sure you leave time to edit your written answer. You will lose marks if you make too many mistakes in grammar and vocabulary.Model answerThe chart shows changes in the share of international students who graduated from universities in different Canadian provinces over a period of 5years.In 2001, this share had a relatively narrow range, from 3% in Ontario to 7.0% in New Brunswick. Nova Scotia had the second highest proportion at 6.5%.Five years later,the figures for most provinces had risen,with the exception of Alberta.There,the figures fell by 1% to just over 4%. By 2006, some parts of Canada experienced a considerable increase in their share of international graduates.Growth in this share was especially strong in the case of New Brunswick, where the figures rose from 7% to 12%. The largest growth occurred in British Columbia, where it more than doubled to 11%.Over this five-year period,changes in the proportion of international graduates have been very uneven across the provinces of Canada. However, New Brunswick remained the province with the highest percentage overall. (158 words)103.You should spend about 20 minutes on this task.The chart below gives information about the UK's ageing population in 1985 and makes predictions for 2035.Summarise the information by selecting and reporting the main features, and make comparisons where relevant.Write at least 150 words.Source:Office for National Statistics,National Records of Scotland,Northern Ireland Statistics and ResearchAgencyExam TipIn Writing Task 1, it is essential to understand what the graph or chart is representing.Look closely at the information in the instructions as well as all details of the graph or chart.The graph in this task shows the percentage of over 65s in each country of the UK.The following are incorrect statements:•Wales had more over 65s than England. (The graph is in percentages, not numbers)• Northern Ireland had 12% of over 65s in 1985. (The countries do not add up to 100% so Northern Ireland did not have 12% of all over 65s. The graph shows that 12% of thepopulation of Northern Ireland was over 65.)Model answerThe graph shows how the size and distribution of the UK's ageing population is likely to change over a 50-year period.Overall,the proportions are predicted to increase in all UK countries.In 1985, 15 per cent of the UK population was over 65, but by 2035, this will account for 23per cent of the total population.A closer look at the data reveals that the ageing population is expected to rise more in some parts of the UK than in other. In 1985, Wales had the highest percentage of people aged 65 and over, at 16 per cent. The second-largest group could be found in England and the third in Scotland. Northern Ireland had lowest proportion, with 12 per cent aged 65 and over. By 2035,Wales is still going to have by far the greatest percentage of over 65s,with figures likely to reach 26per cent.However,the biggest increases in this age group,relative to the rest of the population,are predicted to occur in Northern Ireland and Scotland. In Northern Ireland, for example,this figure will increase almost double to 23per cent. (189 words)104.You should spend about 20 minutes on this task.The diagrams below give information on transport and car use in Edmonton. Summarise the information by selecting and reporting the main features, and make comparisons where relevant.Write at least 150 words.People’s reasons for using the car in cityCommute to work ShoppingLeisure activities Taking children to school Business 55% 15% 15% 40% 45%Test TipIn IELTS Writing Task 1, when you must describe two figures, ask yourself the following:1)What do both figures relate to?2)What kind of relationship is evident?(a similarity, a difference, a cause and effect relationship or some other type of relationship)3) Which aspects of each figure should be highlighted?4) Should I describe the figures in separate paragraphs, or should I compare different aspects of the figures within a series of paragraph? Model answerThe table shows the reason why people in Edmonton use their cars in the city and the pie chart explains what type of transport people prefer to use most of the time.Looking at the pie chart first,it is clear that the car is the most popular means of transport in this city.45%of the people say that they prefer to commute by car. The second most popular form of transport is the LRT, while busses and taxis are the main means of transport for the rest of the people.The table gives more detailed information about why people use their cars. Surprisingly, 55% of the people need to commute to work by car. Cars are also used a lot for taking children to school or business purposes.Only 15% of drivers are doing their shopping and, similarly, 15% need to travel by car for leisure.Overall, people in Edmonton make good use of alternative methods of transport but there is a heavy dependence on cars for work.(170 words)105.You should spend about 20 minutes on this task.The bar chart below shows shares of expenditures for five major categories in the United States, Canada, the United Kingdom, and Japan in the year 2009.Write a report for a university lecturer describing the information below.Write at least 150 words.Source: U.S. Bureau of Labor StatisticsTest TipIn Writing Task 1, it is a good idea to end your answer by summarizing the main information shown by the diagram. You are not required to explain this information.Read the following sample answer. Complete the answer by filling the gaps with the words in the box.by contrast indicates lowest comparesoverall whereas except higherhighest however largest amongThe bar chart compares how consumers in the United States, Canada, the United Kingdom,and Japan allocated different shares of total spending to categories such as food, housing, and transportation in 2009.We can see that the United States had the highest housing expenditure share, 26% of total expenditures in 2009. The United Kingdom and Japan followed, with 24% and 22%, respectively. Canada had the lowest housing share at 21%. Housing was the largest expenditure component in all countries except Japan.By contrast,Canada had the largest transportation share of all four countries at 20%. The United States and the United Kingdom had the next-highest transportation shares, 17% and 15%, respectively. Japan had the lowest, at 10%.However, in Japan, consumers spent 23% of their total expenditures on food in 2009. The United Kingdom had the second-highest share at 20%. Canada, with 15%, and the United States, with 14% had the lowest food expenditure shares among the countries studied.Overall,the data indicates that housing and health care shares of total expenditures were higher in the United States than in Canada, the United Kingdom, and Japan in 2009, whereas Americans had the lowest clothing share.Canada had the highest clothing and transportation shares,and Japan had the highest food share, among the countries compared.Show Answers - Hide Answers(214 words)106.Vocabulary TipNotice the following rules for the spelling of the words programme and program :programme (UK only) = a show on televisionprogram (US only) = a show on televisionprogram (UK and US) = instructions for a computer (a verb and a noun) You should spend about 20 minutes on this task.The charts give information about two genres of TV programmes watched by men and women and four different age groups in Australia.Summarise the information by selecting and reporting the main features, and make comparisons where relevant.Write at least 150 words.IELTS Tip•With graphs, make sure you understand what each axis is measuring.• With bar and pie charts, there is often a key which tells you what each different bar or area represents.• With tables, read the data across the rows and down the columns to identify the key features.Fill in the gaps in the model answer.The charts give information about the genres of TV programmes that Australian men and women and different age groups watch.It is clear from the charts that women tend to watch more television than man overall, although they watch slightly fewer game shows. The people who watch themost television are in the 45+ age group.Nearly 70% of women watch reality shows, which is almost twice as many as the percentage of men who choose this genre of programme.Nevertheless, most age groups watch more reality shows than game shows revealing that game shows are generally less popular than reality shows.The percentage of people watching reality shows increases steadily from ages 16 to 45 with the lowest / smallest percentage of viewers, at just over 50% of the age group 16-24 and the highest / biggest / largest / greatest percentage, at 68% of the over-45s.However,the pattern is different for game shows.The number of programmes watched by25-to44-year-olds is significantly/considerably lower than the number watched by 16- to 24-year-olds and those over 45. Just over 50%of16-to24-year-olds watch game shows,but this share is not as high as the share of people aged 45 and over watching game shows, at nearly 70%. Only 41% of 35- to 44-year-olds watch game shows, and the share of 24- to 34-year-olds is slightly / even lower at 38%.107.You should spend about 20 minutes on this task.The graph below shows the changes in food consumption by Chinese people between 1985 and 2010.Summarise the information by selecting and reporting the main features, and make comparisons where relevant.Write at least 150 words.Writing TipIt is best to use amount and quantity for uncountable nouns,although both are used for countable nouns as well, particularly quantity.The amount of consumption decreased in the last 25 years.AnswerThe graph shows changes in the amount of fish, salt and meat eaten per person per week in China between 1985 and 2010.From the graph we can see that people in China consumed more fish than either meat or salt throughout the period. In 1985, the consumption of fish stood at 610 grams, then increased to 700 grams in 1990. Although it dipped in 1995, it then rose steadily and reached 850 grams in 2010.In contrast, there was a consistent drop in salt consumption. The amount consumed decreased steadily from almost 500 grams per person to only 200 grams by 2010. The amount of meat consumed weekly started at about 100grams. However, this gradually increased throughout the period. By 2010 it was at the same level as the consumption of salt.Overall,the consumption of fish rose,while the consumption of salt fell. In addition, the consumption of meat, while at a relatively low level, rose significantly during this period.108.You should spend about 20 minutes on this task.The graph below shows the population change between1940and2000in three different counties in the U.S. state of Oregon.Summarise the information by selecting and reporting the main features, and make comparisons where relevant.Write at least 150 words.IELTS TipThe structure of your answer would look like this:Introduction - Explain briefly in your own words what the information shows. Give more detail than the question and make comparisons where appropriate.Main Body - Decide how to organise your paragraphs. For example, in the model answer below, paragraph 2 is about 1940- 1970, paragraph 3 is about 1970-2000 for Columbia and Yamhill, and paragraph 4 is about 1970-2000 for Washington. Use words such as although and however to make contrasts, and words such as likewise to introduce similarities.Always include the actual data you have been given. The final paragraph is not a conclusion in this type of task.Model answerThe graph shows the increase in population of three counties, Columbia, Yamhill and Washington in the U.S. state of Oregon, between 1940 and 2000. In 1940, Columbia had the lowest population of the three counties, at around 25,000. This compared with about 30,000 in Yamhill and approximately 75,000 in Washington.By 1970, Columbia’s population had risen to just under 36,000. Although this appears on the graph to be a gentle increase, it is in fact an increase of approximately 50%. Yamhill’s population also rose by nearly 50% between 1940 and 1970: from 30,000 to just under 45,000. However, the greatest real increase was in Washington, where the population in 1970 had increased by approximately 75,000, to 125,000.The years 1970 to 2000 saw the populations of Columbia and Yamhill increase by approximately the same amounts that they had increased by the thirty years before. In 2000, Columbia’s population – at approximately 76,000 – was triple what it had been in 1940. Likewise, Yamhill’s population, at around 90,000, was almost triple what it was in 1940.Although Washington ’s increase in population between 1940 and 1970 w as large,its increase in the following thirty years was even sharper,rising from about 125,000 in 1970 to more than 240,000 in 2000.(206 words)109.IELTS TipYou will lose marks if you make grammatical errors in your writing, particularly when errors are frequent and effect meaning. Be careful of the following common mistakes when describing numbers.amount and number: amount is used with uncountable nouns; number is used with countable nouns, e.g. The amount of meat consumed in China between 1985 and 2010. NOT .per cent and percentage:per cent is always used with a number;percentage is used on its own without a number,e.g.The percentage of male teachers in the UK. NOT . According to the graph, four per cent of the total household budget went towards transportation . NOT .You should spend about 20 minutes on this task.The graph below shows the amount of money spent on books in Germany,France, Italy and Austria between 1995 and 2005.Write a report for a university lecturer describing the information below.Write at least 150 words.Read the following sample plete the answer by filling the gaps with the words in the box.biggest much sharplessleastmoredramaticallythree timesThe line graph compares the amount of money spent on buying books in Germany, France, Italy and Austria over a period of ten years between 1995 and 2005.In 1995 Austria spent the least amount of money on books, while Italy and France spent about as much as each other. However, by 2001, the gap in spending between these two countries had widened and considerably more money was spent in France than In Italy.As can be seen from the graph, the amount of money spent increased in all four countries but rose the most dramatically in Austria.The period between 2000 and 2005 saw a sharp growth and in 2005 the Austrians spent three times as much money as they did in 1995.However, during this ten-year period, Germany remained the biggest spenders on book, with all three other countries spending much less on them.110.IELTS TipIt is quite common for IELTS Writing Task 1 to involve more than one piece of information relating to the topic. For example, you may get two or three pie charts that you must compare. The pie charts may represent different years and show trends over time.In this case,you will have to describe the changes and similarities/differences between the pie charts. Related Topic: Comparing pie chartsYou should spend about 20 minutes on this task.The three pie charts below show the changes in annual spending by local authorities in Someland in 1980, 1990 and 2000.Summarise the information by selecting and reporting the main features, and make comparisons where relevant.Write at least 150 words.Expenditure by local authorities in SomelandModel answerThe charts show how much local authorities spent on a range of services in Someland in three separate years: 1980, 1990 and 2000.In all three years,the greatest expenditure was on education.But while K-12 education saw a fall from 25% in 1980 to only 18% of spending in 2000, higher education remained the largest proportion, reaching 45% of total spending in 1990 and ending at 40% in 2000.Expenditure on health and human resources had increased to 20% by 1990before decreasing to only 10% by the end of the period. In contrast, the share of transportation saw an opposite trend. This cost decreased to only 6% of total expenditure in 1990 but rose dramatically in 2000 when it represented 22% of the total budget. Similarly, the cost of environmental services saw a rising trend, growing from only 4% to 9% by 2000. Overall,higher education constituted the largest cost to local authorities,and while spending increased for transportation and environmental services, there were corresponding drops in expenditure on health and human resources and K-12 education.(178 words)。
剑桥雅思14作文范文(合集3篇)

剑桥雅思14作文范文(合集3篇)(经典版)编制人:__________________审核人:__________________审批人:__________________编制单位:__________________编制时间:____年____月____日序言下载提示:该文档是本店铺精心编制而成的,希望大家下载后,能够帮助大家解决实际问题。
文档下载后可定制修改,请根据实际需要进行调整和使用,谢谢!并且,本店铺为大家提供各种类型的经典范文,如工作总结、工作计划、合同协议、条据文书、策划方案、句子大全、作文大全、诗词歌赋、教案资料、其他范文等等,想了解不同范文格式和写法,敬请关注!Download tips: This document is carefully compiled by this editor. I hope that after you download it, it can help you solve practical problems. The document can be customized and modified after downloading, please adjust and use it according to actual needs, thank you!Moreover, our store provides various types of classic sample essays for everyone, such as work summaries, work plans, contract agreements, doctrinal documents, planning plans, complete sentences, complete compositions, poems, songs, teaching materials, and other sample essays. If you want to learn about different sample formats and writing methods, please stay tuned!剑桥雅思14作文范文(合集3篇)剑桥雅思14作文范文第1篇The chart illustrates a countrys eXport revenue in a variety of goods in the years 20XX and 20XX.The charts horizontal aXis shows the different goods that include petroleum products,engineered goods, gems and jewellery,agricultural products and teXtiles,whereas the vertical aXisshows the amount in billions of dollars The table represents the changes between the 2 years as a percentage and indicates whether it is a rise or fall.图表显示了某国家20XX年和20XX年不同商品的出口收入。
雅思小作文_最全万能模板

雅思小作文写作万能模板1、通过第一个曲线图,我们可以知道,也说明了结果是According to the first graph,it can be seen that,it can also be concludedfrom it that.2、一张有趣、有教育意义的、(内容)的图片(这句模板在雅思小作文中的应用非常的广泛。
)There is an interesting and instructive picture which goes like this:.3、当前有一张涉及的增长曲线图,许多人,然而其他人倾向于Nowadays there is a growing concern over.Many people like ,while others are inclined to.4、目前,共同之处是,许多人喜欢因为除此之外还由于Nowadays,it is common to.Many people like because .Besides,.5、(图表所示),就像许多其他事物,被更加喜爱,然而这一观点正被所抨击,一些人认为,他们指出,just like many other things,are preferred by.While being attacked by the idea that,some people consider .They point that.6、每种事物都有两面性和,是没有异议的,包括利和弊Everything has two sides and is not an exception,it has both advantagesand disadvantages.7、作为被观察了许多年,但是人们现在像发现新大陆一样注视着它For years had been viewed as.But people are takinga fresh look at it now.8、政府保证,对于这份保证,大多数人做出了强烈地回应,因为It has stipulated by the government that.To this stipulation,many people respond actively because.9、出现在我们日常生活中是很平常的,无论我们做什么,都是不可避免的is a common occurrence in our daily life.Whatever we do,can't be avoided.10、在人群中已经成为热门话题,特别是在年轻人中,激烈的争论无休止has become a hot topic among people,especially among the young,and heated debates are right on their way.1according to the chart```2the date lead us to the conclusion that```3the date show```4the tree diagram reveals how```5the figures show```6this is a cure graph which describes the trend of```7the pie graph depicts```8the graph provides some interesting date regrarding```9the table shows the changes in the number of```over the periodfrom```to```10as is shown in the table```11from the table,we can clearly see that```12this table shows the changing proportion of X and Y from```to````13the graph,presented in a pie chart,shows the general trend in```14as can be seen from the grape,the two curves show the flutuation of```15over the period from```to```the```remained level.16in the year between```and```.17in the3years spanning from2005through2008.18the number of```remained steady from```to````.19the number sharply went up to```20the percentage of```stayed the same between```and```21the percentage remainede steady at```22the percentage of```is sightly large than that of.23there is not a great deal of differece between```and```24the graphs show a three fold increase in the number of```25```decreased year by year while```increased steadily.26there is an upward trend in the number of```27a considerable increase occurred from```to```28from```to```the rate of decrease slow down.29from this year on,there was a gradual declinel reduction in the```reaching a figure of.30be similar to```be the same as31there are a lot similarities between```and```32the difference between X and Y lies in```雅思学术性写作考试中Task1考查考生解释,说明信息的能力,这些信息通常体现在图解,表格和插图中,这一部分的模式化程度更高一些。
【雅思写作真题】剑桥8 Test4小作文实例批改丨附考官范文
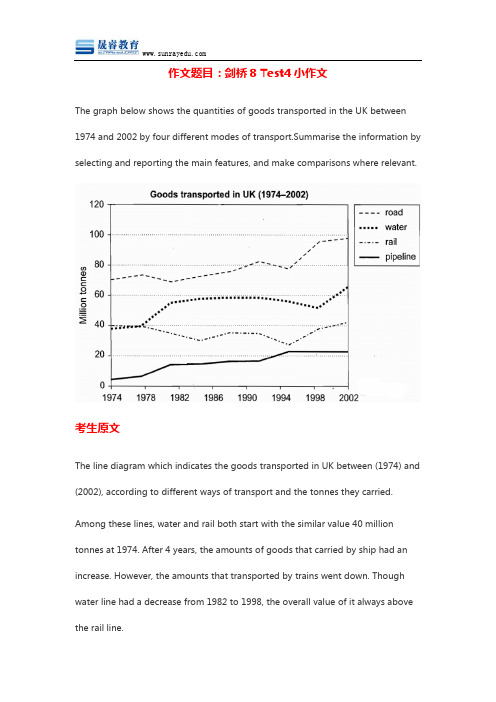
作文题目:剑桥8 Test4小作文The graph below shows the quantities of goods transported in the UK between 1974 and 2002 by four different modes of transport.Summarise the information by selecting and reporting the main features, and make comparisons where relevant.考生原文The line diagram which indicates the goods transported in UK between (1974) and (2002), according to different ways of transport and the tonnes they carried. Among these lines, water and rail both start with the similar value 40 million tonnes at 1974. After 4 years, the amounts of goods that carried by ship had an increase. However, the amounts that transported by trains went down. Though water line had a decrease from 1982 to 1998, the overall value of it always above the rail line.The most obvious line which can find on the top of chart is the quantity of goods that transported by road. It held the highest position during 28 years(start at 78 tonnes and finish at 98 tonnes). Turning to the bottom of the chart, the black straight line reveal the pipeline. It is clear that the black line had two climbing points, but it is still the minimum figure.Overall, the chart demonstrates that the technology is developing. Because all the lines have a positive gradient or the final value is greater than start value.批改By 晟睿葡萄本次批改严格按照IELTS小作文评分标准进行。
雅思2024年1月小作文范文

雅思2024年1月小作文范文
雅思2024年1月小作文范文(口语化版)。
段落一:
全球智能手机销量这五年真是突飞猛进啊!看这图表,销量一
路飙升,2023年更是达到了巅峰。
这背后的原因嘛,技术越来越先进,价格也越来越亲民,大家都意识到了智能手机的好处。
段落二:
说到市场份额,苹果和三星可是领头羊。
他们的产品功能新颖,性能稳定,应用生态也丰富。
不过,小米和华为这些品牌也不甘示弱,提供了性价比超高的选择,逐渐在市场中占据了一席之地。
段落三:
5G技术崛起后,大家对智能手机的需求更是爆炸式增长。
现在
大家都想要速度快、连接稳定的手机。
制造商也赶紧推出了支持5G
的新机型,销量也跟着水涨船高。
段落四:
不过,市场饱和也是个问题。
发达国家智能手机普及率已经很高了。
所以,制造商们开始把目光投向了新兴市场,希望能找到新的增长点。
同时,竞争越来越激烈,产品更新换代也越来越快,制造商得不断创新才能保持领先。
段落五:
总的来说,智能手机市场还是很有活力的,未来几年还会继续增长。
但消费者口味和技术都在变,制造商得灵活应对才能立于不败之地。
现在市场上的产品琳琅满目,既有机会也有挑战啊!。
剑桥英语10雅思考官范文(大作文+小作文)1
剑10 1-2It is important for children to learn the difference between right and wrong at an early age.Punishment is necessary to help them learn this distinction.To what extent do you agree or disagree with this opinion?What sort of punishment should parents and teachers be allowed to use to teach good behavior to children?One important stage in a child’s growth is certainly the development of a conscience, which is linked to the ability to tell right from wrong.This skill comes with time and good parenting, and my firm conviction is that punishment does not have much of a role to play in this.Therefore I have to disagree almost entirely with the given statement.To some extent the question depends on the age of the child.To punish a very young child is both wrong and foolish, as an infant will not understand what is happening or why he or she is being punished.Once the age of reason is reached however, a child can be rewarded for good behavior and discouraged from bad.This kind but firm approach will achieve more than harsh punishments, which might entail many negative consequences unintended by the parents.To help a child learn the difference between right and wrong, teachers and parents should firstly provide good role modelling in their own behavior.After that, if sanctions are needed, the punishment should not be of a physical nature, as that merely sends the message that it is acceptable for largerpeople to hit smaller ones-an outcome which may well result in the child starting to bully others.Nor should the punishment be in any way cruel.Rather, teachers and parents can use a variety of methods to discipline their young charges, such as detention, withdrawal of privileges, and time-out.Making the punishment fit the crime is a useful notion.Which would see children being made to pick up rubbish they have dropped, clean up graffiti they have drawn, or apologise to someone they have hurt.In these ways responsibility is developed in the child, which leads to much better future behavior than does punishment.剑10 2-1The tables below give information about sales of Fairtrade-labelled coffee and bananas in 1999 and 2004 in five European countries. Summarise the information by selecting and reporting the main features, and make comparisons where relevant.The two tables contain sales date for Fairtrade coffee and bananas in 1999 and 2004, in five nations of Europe.The first shows low-level coffee sales increasing in all five countries, albeit to widely varying degrees.In two places sales increased by the same small amount: 1.8-2 million euros in Denmark, and 0.8-1 million in Sweden.The increment was slightly larger in Belgium, from 1-1.7 million euros.Meanwhile, in Switzerland sales doubled from 3-6 million euros.Finally, in the UK there was an enormous increase, from 1.5-20 million euros.In the second table, it is Switzerland which stands out as buying far more Fairtrade bananas than the other four countries.Swiss sales figures jumpedfrom 15-47 million euros across these five years, while in the UK and Belgium sales only grew from 1-5.5 and from 0.6-4 million euros respectively.Sweden and Denmark showed a different pattern, with fails in banana sales from 1.8-1 and 2-0.9 million euros.Comparing the two tables, it is clear that in 1999 Fairtrade coffee sales ranged from 0.8-3 million euros in these five countries, while banana sales also mostly cluster between 0.6 and 2 million euros, with Switzerland the outlier at a huge 15 million euros.By 2004, sales figures for both products had risen across the board, except for Sweden and Demark which recorded drops in banana sales.剑10 3-2Countries are becoming more and more similar because people are able to buy the same products anywhere in the world.Do you think this is a positive or negative development?It is said that countries are becoming similar to each other because of the global spread of the same products, which are now available for purchase almost anywhere.I strongly believe that this modern development is largely detrimental to culture and traditions worldwide.A country’s history, language and ethos are all inextricably bound up in its manufactured artefacts.If the relentless advance of international brands into every corner of the world continues, these bland packages might one day completely oust the traditional objects of a nation, which would be a loss of richness and diversity in the world, as well as the sad disappearance of the manifestations of a place’s character.What would a Japanese tea ceremony be without its specially crafted teapot, or a Fijian kava ritual without its bowl made from a certain type of tree bark?Let us not forget either that traditional products, whether these be medicines, cosmetics, toys, clothes, utensils or food, provide employment for local people.The spread of multinational products can often bring in its wake a loss of jobs, as people turn to buying the new brand, perhaps thinking it more glamorous than the one they are used to.This eventually puts old-school craftspeople out of work.Finally, tourism numbers may also be affected, as travellers become disillusioned with finding every place just the same as the one they visited previously.To see the same products in shops the world over is boring, and does not impel visitors to open their wallets in the same way that trinkets or souvenirs unique to the particular area do.Some may argue that all people are entitled to have access to the same products, but I say that local objects suit local conditions best, and that faceless uniformity worldwide is an unwelcome and dreary prospect.剑10 4-1The diagrams below show the life cycle of a species of large fish called the salmon.Summarise the information by selecting and reporting the main features, and make comparisons where relevant.Salmon begin life as eggs on a pebbly riverbed, hidden among reeds in the slow-moving upper reaches of a river.After five to six months the eggs hatch into “fry”.For approximately the next four years, these baby salmon will live in the lower, faster-flowing waters of their river.During this time they measure between three and eight centimetres in length.By the time salmon reach twelve to fifteen centimetres, they are termed ‘smolt’, and at this time they migrate further downriver into the open sea.After five years at sea the salmon will have grown to adult size, which is between seventy and seventy-six centimetres.They then begin swimming back to their birthplace, where they will lay their eggs, and the cycle startsanew.In summary, the salmon passes through three distinct physical stages as it grows to maturity.Each of these stages takes place in a very different aquatic location.It is noteworthy that the first two stages of this fish’s life occur in a freshwater environment, while the third stage is lived in saltwater.。
雅思写作饼图小作文满分
雅思写作饼图小作文满分雅思写作饼图小作文满分范文(通用20篇)饼图写作也是雅思写作常见的作文类型之一。
下面,店铺就为大家送上两篇雅思写作饼图小作文满分范文,希望对大家有用。
雅思写作饼图小作文满分篇1The pie charts compare visitors’ responses to a survey about customer service at the Parkway Hotel in 2005 and in 2010.It is clear that overall customer satisfaction increased considerably from 2005 to 2010. While most hotel guests rated customer service as satisfactory or poor in 2005, a clear majority described the hotel’s service a s good or excellent in 2010.Looking at the positive responses first, in 2005 only 5% of the hotel’s visitors rated its customer service as excellent, but this figure rose to 28% in 2010. Furthermore, while only 14% of guests described customer service in the hotel as good in 2005, almost three times as many people gave this rating five years later.With regard to negative feedback, the proportion of guests who considered the hotel’s customer service to be poor fell from 21% in 2005 to only 12% in 2010. Similarly, the proportion of people who thought customer service was very poor dropped from 15% to only 4% over the 5-year period. Finally, a fall in the number of ‘satisfactory’ ratings in 2010 reflects the fact that more people gave positive responses to the survey in that year. 雅思写作饼图小作文满分篇2The charts compare Korea, Sweden and the UK in terms of the methods used in each country to dispose of harmful waste.It is clear that in both the UK and Sweden, the majority of dangerous waste products are buried underground. By contrast,most hazardous materials in the Republic of Korea are recycled.Looking at the information in more detail, we can see that 82% of the UK’s dangerous waste is put into landfill sites. This disposal technique is used for 55% of the harmful waste in Sweden and only 22% of similar waste in Korea. The latter country recycles 69% of hazardous materials, which is far more than the other two nations.While 25% of Sweden's dangerous waste is recycled, the UK does not recycle at all. Instead, it dumps waste at sea or treats it chemically. These two methods are not employed in Korea or Sweden, which favour incineration for 9% and 20% of dangerous waste respectively.雅思写作饼图小作文满分篇3Dear Sir or Madam,I’m writing in response to the advertisement you placed in Shanghai Daily for the position of overseas mechanical engineer on Mon. Feb.23.I would like to apply for this post. I graduated with a Master’s degree in Machine-Building and Electronics Industries in Tsinghua University in 1999 and began my career in Zhongshan ABB Company as a young mechanical engineer. In 20XX, I was promoted to be the chief engineer, taking charge of the projects in Southeast Asia. I have been seeking for chances overseas in my majored domain in the hope that I can develop my potential further.If possible, I would like to choose a mechanical company with good reputation located in Chicago. I would also prefer small private companies which allow me to enjoy a larger space of promotion.The reason I made the decision above is that my husbandhas recently been relocated to Chicago by his company and I am, therefore, seeking a position in the same area in Chicago.I have enclosed my resume that outlines in detail my qualifications and experience as well as an open letter of recommendation from my former employer.Please give me a feedback at your earliest convenience if my qualifications meet your requirements.I look forward to hearing from you soon.Yours sincerely,Lucy Liu雅思写作饼图小作文满分篇4As a result of constant media attention, sports professionals in my country have become stars and celebrities, and those at the top are paid huge salaries. Just like movie stars, they live extravagantlifestyles with huge houses and cars.Many people find their rewards unfair, especially when comparing these super salaries with those of top surgeons or research scientists, or even leading politicians who have the responsibilityof governing the country. However, sports salaries are not determined by considering the contribution to society a person makes, or the level of responsibility he or she holds. Instead, they reflect the public popularity of sport in general and the level of public support that successful stars can generate. So the notion of ‘fairness’ is not the issue.Those who feel that sp orts stars’ salaries are justified might argue that the number of professionals with real talent are very few, and the money is a recognition of the skills and dedication a person needs to be successful. Competition is constant and a player is tested every time they perform. in their relatively short career. The pressure from the media is intense and there is littleprivacy out of the spotlight. So all of thesefactors may justify the huge earnings.Personally, I think that the amount of money such sports stars make is more justified than the huge earnings of movie stars, but at the same time, it indicatesthat our society places more value on sport than on more essential professions and achievements.译文在媒体不断地推波助澜下,我国的许多职业运动员已成为了明星和名人。
剑桥雅思10text3小作文
剑桥雅思10text3小作文In Cambridge IELTS 10, Test 3, the small essay prompt presents a problemrelated to the increasing number of cars in urban areas and the potentialsolutions to this issue. The prompt specifically asks the test-taker to discussthe advantages and disadvantages of reducing the number of cars in cities, as well as to provide potential solutions to this problem.From an environmental perspective, reducing the number of cars in urban areas can have several advantages. Firstly, it can help to reduce air pollution, whichis a major concern in many cities around the world. With fewer cars on the road, there will be lower levels of harmful emissions such as carbon monoxide and nitrogen oxides, which can have a positive impact on air quality and public health. Additionally, reducing the number of cars can also help to mitigate the effects of climate change by decreasing the amount of greenhouse gases being released intothe atmosphere.On the other hand, there are also some disadvantages to reducing the number of cars in cities. One major concern is the potential impact on the economy. Many businesses rely on the transportation of goods and services via cars, and a significant reduction in the number of cars on the road could lead to logistical challenges and increased costs for businesses. Furthermore, for individuals whorely on their cars for transportation, such as those with mobility issues or individuals living in areas with limited public transportation options, reducing the number of cars could pose a significant challenge.In terms of potential solutions to this problem, there are several strategies that could be implemented to reduce the number of cars in urban areas. Onepossible solution is to improve and expand public transportation options. By investing in more efficient and accessible public transportation systems, individuals may be more inclined to use public transportation instead of relyingon their cars. Additionally, implementing policies such as congestion pricing or carpooling incentives could also help to reduce the number of cars on the road.However, it is important to acknowledge that there is no one-size-fits-all solution to this problem, and different cities may require different approaches. For example, in some cities, investing in infrastructure for walking and cyclingmay be more effective, while in others, implementing stricter emissions standards for vehicles may be necessary.In conclusion, the problem of the increasing number of cars in urban areas is a complex issue that requires careful consideration of its various implications. While there are clear environmental benefits to reducing the number of cars, it is also important to consider the potential economic and social impacts of such policies. By exploring a range of potential solutions and considering the unique needs of different cities, it may be possible to develop effective strategies for addressing this problem.。
雅思小作文例文3.0
雅思小作文例文题目1 :线图You should spend about 20 minutes on this task.Write at least 150 words.Model Answer :The graph shows the increase in the percentage of people aged 65 or more in Japan, Sweden and the USA.In 1940 the proportion of people over 65 years stood at only 5% in Japan, approximately 7% in Sweden and 9% in the US. However, while the figures for the Western countries grew to about 15% in around 1990, the figure for Japan dipped to only2.5% for much of his period, before rising to almost 5% again at the present time.In spite of some fluctuation in the expected percentages, the proportion ofolder The graph below shows the proportion of the population aged 65 and over between 1940 and 2040 in three different countries.Summarise the information by selecting and reporting the main features, and make comparisons where relevant.people will probably continue to increase in the next two decades in the three countries.A more dramatic rise is predicted between 2030 and 2040 in Japan, by which time it is thought that the proportion of elderly people will besimilar in the three countries.Overall, it indicates that the percentage of elderly people in all three countries is expected to increase to almost 25% of the respective populations by the year 2040.题目2: 饼图The charts below give information about the ages of the populations of Yemen and Italy in 2000 and projections for 2050.Summarise the information by selecting and reporting the main features, and make comparisons where relevant.The pie charts below show the percentages of different age groups in Italy and Yemen in 2000 and its prediction for 2050. The age groups can be divided into 0-14 years, 15-59 years and 60+years.In 2000, the population aged under 14 accounted for the largest proportion of the overall population in Yemen, at 50.1%. This figure is expected to drop to 37% in 2050. Yemen is expected to see a slight increase in the proportion of people over 60 years from 3.6% to 5.7% in 2050, despite the fact that this age group will still represent the smallest section of the population. There will also be an increase in the percentage of the 15-59 age group from 46.3% to 57.3%.In contrast, most of the population in Italy was between 15-19 in 2000, at 61.6%. This figure is expected to drop to 46.2% in 2050. Those aged under 14 are projected to dip from 14.3% to 11.5%, representing the least proportion of the total population in both years. While the percentage of people aged over 60 will almost double to 42.3% in 2050.Overall, the projection is that the populations of both countries will become older. Italy had an older population than Yemen in the year 2000, and the same is predicted in 2050.题目3 柱状图The charts below give information about the ages of the populations of Yemen and Italy in 2000 and projections for 2050.Summarise the information by selecting and reporting the main features, and make comparisons where relevant.The bar charts given show the amount of marriages and divorces every ten yearsfrom 1970 to 2000 as well as the specific information about the percentages of different marital status in the U.S. in 1970 and 2000.The first chart gives statistic information on marriages and divorces each decade between 1970 and 2000. The number of marriages remained higher than that of divorces throughout this period. There were 2.5 million marriages in both 1970 and 1980, higher than the rest two years. The figure then continued to decrease to around 2.3 million in 1990 and 2 million in 2000. In contrast, there were 1 million divorces in 1970, representing the lowest point between 1970 and 2000. The number increased to almost 1.5 million in 1980 before it dropped all the way down to 1 million in 2000.The second chart compares the proportion of adult Americans in 4 different marital status: never married, married, widowed and divorced. In 1970, the most common marital status of adult Americans was married, which took up the largest proportion at 70%. In contrast, the percentage of people in the rest three marital status remained much lower. Despite a slight decrease occurred in the percentage of the widowed, both figures for the divorced and never married saw moderate increases of less than 10 percentage point.Overall, with years, the marriage rate of adult Americans decreased while the opposite trend was apparent in the divorce rate.题目4 表格1The table below shows the changes in the average distance measured in milestravelled by different modes of transport per person per year in 1985 and 2000 in England. Overall, the distance travelled in all modes of transportation significantly increased from 4740 miles in 1985 to 6475 miles in 2000. Car travelled the longest distance for everyone in both 1985 and 2000, increasing from 3199 miles to 4899 miles. Taxi, the least popular mode of transportation in 1985, only travelled for 13 miles and this figure slightly increased to 42 in 2000. The amount of the travelling distance of long distance bus doubled from 1985 (54 miles) to 2000 (124 miles). However, the figure for local bus in 2000 was almost half of the figure for 1985. The other ways of transport including bicycle, train and walking barely changed in these two years in terms of travelling distance.In summary, the modes of transport which allow the travelling for relatively long distance such as car, long distance bus and train remained popular in both these two years.The table below gives information about changes in modes of travel in England between 1985 and 2000.Average distance in milestravelled per person peryear, by mode of travel题目5 表格2The table below gives information about the underground railway system in six cities.Summarise the information by selecting and reporting the main features and make comparisons where relevant.The table presents statistic information about six countries’ underground systems regarding the time of opening, the length of route measured in kilometres and the yearly number of passengers measured in millions.London has the oldest underground railway system among the six cities, which was opened in 1863 while the railway system in Los Angeles is the newest, opened in the year 2001. For the rest four cities, that is, Paris, Tokyo, Washington DC and Kyoto, the opening dates were all in the 20th century.Next, in terms of the length of route measured in kilometres, the underground system in London is the longest at 394, almost double the size of the second largest one located in Paris, while the figure for Kyoto is the smallest at 11, followed by Los Angeles at 28.Lastly, when it comes to the yearly amount of passengers travelled by the underground system in these six cities, Tokyo has the largest number of passengers at 1927 million followed by Paris at 1191 million. On the contrary, the numbers for Kyoto and Los Angeles are the smallest at 45 million and 50 million respectively.Overall, the underground systems in different cities vary a lot regarding the opening date, the size and the number of passengers. Tokyo and Paris use it as the main mode of transport while in Kyoto and Los Angeles the metro system was less popular.雅思小作文例文-信息图表1.流程图The diagrams below show the life cycle of the silkworm and the stages in the production of silk cloth.Summarise the information by selecting and reporting the main features, and make comparisons where relevant.The flow chart illustrates the life cycle of the silkworm and the making process of silk cloth.In the first stage, a moth lays eggs and it takes 10 days for eggs to grow into larva which feeds on mulberry leaves. This stage lasts for 4-6 weeks until the larva produces silk thread. 3-8 days later, a number of cocoons are produced. 16 days later, the adult moths emerge from these cocoons, where a new cycle begins.The cocoons are the raw material used for the production of silk cloth. Once selected, they are boiled in water and the threads can be separated in the unwinding stage. Each thread is between 300 and 900 metres long, which means they can either be twisted together, dyed and then directly used to produce cloth in the weaving stage, or the threads can first go through the steps of twisting and weaving before the dyeing procedure.Overall, the diagrams show that the cocoon stage of the silkworm can be used to produce silk cloth through a very simple process.2.地图The two maps illustrate how the island has changed before and after the construction of some tourist equipment.Looking first at the map before construction, we can see a huge island with a beach in the west. The island was almost bare despite a few trees in the western and eastern area.Looking at the maps in more detail, we can see that small huts have been built to accommodate visitors to the island. The other physical structures that have been added are a reception building, in the middle of the island, and a restaurant to the north of the reception. As well as the buildings mentioned above, the new facilities on the island include a pier, where boats can dock. There has also been a vehicle track linking the pier with the reception and restaurant, and some footpaths connecting the huts. Finally, a swimming area has been designated for tourists on the western tip of the island.Overall, the island has become more tourism focused after the construction of some tourist facilities.。
雅思13test4小作文
雅思13test4小作文英文回答:1. Do you agree that the government should ban cars from city centers to improve air quality?I believe that the government should ban cars from city centers to improve air quality. Car emissions are a major contributor to air pollution in cities, and banning cars from these areas would help to reduce the levels of harmful pollutants in the air. This would have a positive impact on the health of city residents, as air pollution has been linked to a number of health problems, includingrespiratory problems, heart disease, and stroke. In addition, banning cars from city centers would also help to reduce traffic congestion, which would make it easier for people to get around and would improve the quality of life for everyone.2. What are the advantages and disadvantages of livingin a small town?There are both advantages and disadvantages to livingin a small town. On the one hand, small towns can be agreat place to raise a family. They are typically safe and quiet, and there is a sense of community that is often lacking in larger cities. In addition, small towns often have a lower cost of living than larger cities, which canbe a major advantage for families on a budget. On the other hand, small towns can also be limiting. There may be fewer job opportunities and cultural amenities than in larger cities, and it can be difficult to get around without a car. In addition, small towns can be prone to gossip and social isolation, which can be a challenge for some people.3. What are the benefits of learning a foreign language?There are many benefits to learning a foreign language. For one, it can help you to connect with people from other cultures. When you speak another language, you are able to communicate with people from all over the world, which can be a great way to learn about different cultures andperspectives. In addition, learning a foreign language can also help you to improve your cognitive skills. Studieshave shown that people who speak multiple languages have better memory, attention, and problem-solving skills than those who only speak one language. Finally, learning a foreign language can also be a great way to boost your career prospects. In today's globalized world, employersare increasingly looking for employees who are able tospeak multiple languages.中文回答:1. 是否同意政府应禁止汽车进入市中心以改善空气质量?我认为政府应该禁止汽车进入市中心以改善空气质量。
- 1、下载文档前请自行甄别文档内容的完整性,平台不提供额外的编辑、内容补充、找答案等附加服务。
- 2、"仅部分预览"的文档,不可在线预览部分如存在完整性等问题,可反馈申请退款(可完整预览的文档不适用该条件!)。
- 3、如文档侵犯您的权益,请联系客服反馈,我们会尽快为您处理(人工客服工作时间:9:00-18:30)。
雅思写作基础主语1)old people should offer young people opportunities to practicetheir abilities and talents.2)Smoking is just a personal hobby and entertainment.3)It is hard to come to an absolute conclusion.4)It is obvious that wearing uniforms would make school life dulland monotonous.谓语1)they insist that the practice of censorship should be abolished.2)Computer affects people’s daily life and does harm to people.3)Children should achieve success through their own efforts.表语1)censorship is a violation of people’s freedom of expression.2)The methods of farming and slaughter of these animals areoften barbaric and cruel.3)What we should do is to tell children how to solve theseproblems properly.4)The focal point is that formal examinations are harmful tostudents’ creativity.宾语1)junk food impairs people’s health.2)Studies reveal that there is a definite link between smokingand some serious diseases such as lung cancer and heart disease.3)It brings us a lot of pleasure and amusement.定语1)it is hard to come to an absolute conclusion.2)In recent years, the internet has been gaining popularity at anamazing rate.3)Individuals with limited budgets usually get their prioritiesright.4)Those people who strongly oppose the practice claim that itviolates people’s basic rights of working. Infringe upon/on birth rights.5)状语1)outdoor activities can improve our health greatly.2)According to the laws, advertisements must be completelytruthful and healthy.3)To dispel loneliness and kill the time, they can cultivate someother hobbies such as growing flowers, collecting stamps and learning to paint.4)Living far away from home, one will suffer from lonelinessand homesickness.5)I still like to travel with friends because I think the mostimportant thing during travel is to get pleasure and relaxation.6)同位语1)shopping, a necessary activity in everyday life, is more convenient in the city.2)Love can tear students away from learning, the student s’main task.补语1)we consider compulsory military service a violation of human rights.2)Cloning technology can make humans redundant, replaceable and even extinct.3)I find the employment situation frustrating.英语句子结构的分类a.简单句1)television can widen our horizons.2)Students can get opportunities to experience a totally different culture.3)It brings us a lot of pleasure and amusement.4)More importantly, relatives, neighbors and his teachers should give the very kid as much love as possible to make him feel least abandoned.b.并列句1)solving the problem of traffic jams is not an easy job and I don’tthink any individual or organization can easily handle it.2)With the steady growth in the country’s economy as well as thepeople’s living standard, the rhythm of people’s living is speeding up and a lot of changes have taken place in their daily life.3)Some professors prefer to control discussion, while othersprefer to guide the class without dominating it.4)Television hasn’t been with us all that long, but we are alreadybeginning to forget what the world was like without it.5)I used to meet several vegetarians but I have never heard of anation that advocates vegetarian diet.c.复合句1)they insist that the practice of censorship should be abolished.2)It is evident that it can relieve the traffic congestion in the streets, thus accelerating the flow of buses and cars.3)At that moment only a language that can be accepted and understood by most of the people such as English, French and so on will function.4)However, we cannot think that parents should acceptresponsibility and be punished if their children behave badly. 5)But the problem is that the cost for telephone calls is so high that many cannot afford it.6)Nowadays, more and more people agree that smoking is an unwholesome hobby, which is equivalent to committing suicide.句型翻译练习(即席)雅思写作常见错误一,词性使用不当1)It is benefit to children. Beneficial2)I am agree with the later view. Latter , former3)The population was increased to 20 million in the past threedecades.4)I think we should sending old people to nursing homes.5)With the development of society and economy,communication through internet has instead of the traditional means of letters. Replace substitute supplement二,用词不当1)The government will cost a large sum of money on the masstransit system. Investment2)My father and mother are all old. A doctor and nurse3)The present situation becomes serious and serious.4)It is a tough job to handle the question of youth drug abuse.5)The old are inevitable to have generation gap with theirchildren.6)Please write to me if you are convenient. At your convenience7)I am easy to catch cold.8)May I borrow your phone?9)It seems that most of families are not as close as before.10)As the progress of the society, more and more peoples beginto be aware of the problem of …11)It is not an easy work to master a foreign language.三,代词使用问题sexual discrimination , racial discrimination 1)If one has talents and self-confidence, we will likely succeed. 2)If you try your best to get more aerobic exercise and practice it whenever and wherever possible, we can maintain good physical condition.3)It is June now. Many students are busy preparing for the Entrance Examination to college. The great noise always makes him crazy.4)The output of 1999 is more than 1998.四,句子结构混乱1)One of their reasons is the old buildings have a long history.2)As one of the most popularity thing is study abroad.3)First of all, foreign countries, which create a wonderfullanguage atmosphere for students.4)Young people go to abroad is difficult.五,存在句使用的问题1)There are more and more people go abroad nowadays.2)In nowadays, there is a great number of people choose tostudy abroad.六,时态和语态问题1)with the opening up to the outside world, greater changeshave been taken place in people’s attitude towardsmarriage.2)More and more children has been gone abroad to continuetheir study.3)Now more and more parents sent their children to studyabroad.七,主谓一致1)Exploring the unknown places are a great pleasure to manypeople.2)Rejecting the changes are unwise and passive.3)The above-mentioned disadvantages which are broughtabout by environmental pollution is very detrimental butoften miss people’s attention4)One of the most pressing problem confronting humanbeings are old age boom.八,非谓语动词1)I think set up a camera in the residential area is the best way toensure the security of the dwellers.2)Comparing with the advanced western countries, China is a bitslow in information technology.3)Rescue the adventurer in danger is a time-honored virtue inchina.4)The moral education plays an important role in bring familiescloser.5)It is commonly accepted that respect the old is a virtue.九,重复复累赘1)I could not bear my roommate who shares the room with menow.2)It is a true fact that…3)From what we have discussed above, we may safely draw afinal conclusion that …4)In my opinion, I think the owner is justified to do so.十,综合1)one of the most significant change is families are not as closeas before.2)As the internet comes into our life, our life has taken placemany changes.翻译练习1.国际贸易是一个公众感兴趣和关注的话题。