第五章任玉杰作业
计量经济学第五章课后作业
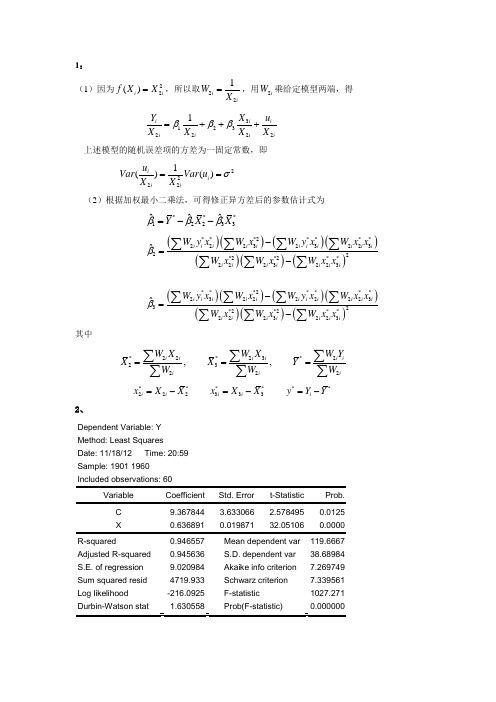
1:(1)因为22()i i f X X =,所以取221i iW X =,用2i W 乘给定模型两端,得312322221iii iiiiY X u X X X X βββ=+++上述模型的随机误差项的方差为一固定常数,即22221()()i i iiu Var Var u X Xσ==(2)根据加权最小二乘法,可得修正异方差后的参数估计式为***12233ˆˆˆY X X βββ=--()()()()()()()***2****22232322322*2*2**2223223ˆii ii i i i ii i iii i i i i iWy x W x W y x W x xWx W x W x x β-=-∑∑∑∑∑∑∑()()()()()()()***2****23222222332*2*2**2223223ˆii ii i i i ii i iiii ii iiWy x W x W y x W x xWxW x W xxβ-=-∑∑∑∑∑∑∑其中22232***23222,,i ii ii iiiiW X W X W Y X X YWWW===∑∑∑∑∑∑******222333i i i iix X X x X X y Y Y=-=-=-2、Dependent Variable: Y Method: Least Squares Date: 11/18/12 Time: 20:59 Sample: 1901 1960 C 9.367844 3.633066 2.578495 0.0125 X0.6368910.01987132.051060.0000R-squared0.946557 Mean dependent var 119.6667 Adjusted R-squared 0.945636 S.D. dependent var 38.68984 S.E. of regression 9.020984 Akaike info criterion 7.269749 Sum squared resid 4719.933 Schwarz criterion 7.339561 Log likelihood -216.0925 F-statistic 1027.271 Durbin-Watson stat1.630558 Prob(F-statistic)0.000000(1)根据eviws 输出结果,该模型样本回归估计式的书写形式为22ˆ9.347522+0.637069t= (2.569104) (32.00881)R =0.946423 R =0.945500 F=1024.564 D W =1.790431i iY X =(2)首先,用Goldfeld-Quandt 法进行检验。
时间的序列第五章作业的
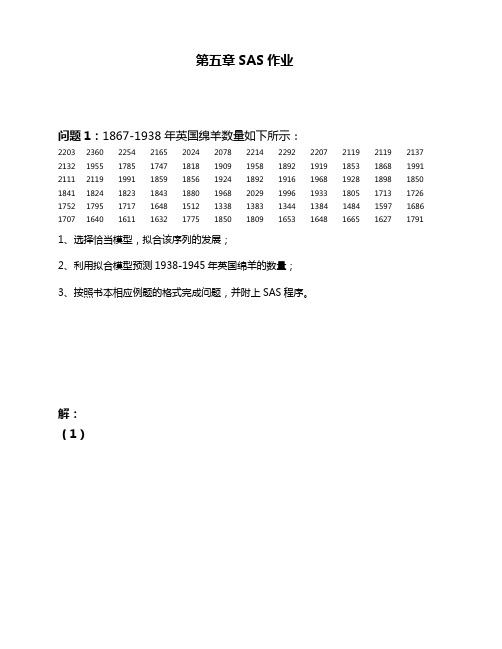
第五章SAS作业问题1:1867-1938年英国绵羊数量如下所示:2203 2360 2254 2165 2024 2078 2214 2292 2207 2119 2119 2137 2132 1955 1785 1747 1818 1909 1958 1892 1919 1853 1868 1991 2111 2119 1991 1859 1856 1924 1892 1916 1968 1928 1898 1850 1841 1824 1823 1843 1880 1968 2029 1996 1933 1805 1713 1726 1752 1795 1717 1648 1512 1338 1383 1344 1384 1484 1597 1686 1707 1640 1611 1632 1775 1850 1809 1653 1648 1665 1627 17911、选择恰当模型,拟合该序列的发展;2、利用拟合模型预测1938-1945年英国绵羊的数量;3、按照书本相应例题的格式完成问题,并附上SAS程序。
解:(1)时序图显示,序列具有长期趋势,对序列进行1阶差分▽Xt=Xt-Xt-1,观察差分后序列▽Xt的时序图。
时序图显示长期趋势信息基本被差分运算提取充分,考察差分后序列的自相关图和偏自相关图。
自相关图显示延迟3阶后自相关系数基本在2倍标准差范围内,因此认为该序列为平稳序列。
自相关图表现出拖尾现象,偏自相关图表现出3阶结尾现象,且自相关图中2阶自相关系数在2倍标准差范围内,所以考虑构造疏系数模型AR(1,3)。
残差自相关检验结果显示延迟6期后P值都大于0.05,因此认为残差为白噪声序列,即拟合模型显著有效。
参数估计结果显示两参数P值都小于0.05,都显著有效。
则拟合的AR(1,3)模型为▽Xt=0.32196▽Xt-1 –0.37616▽Xt-3 + εt(2)利用拟合模型对1938-1945年英国绵羊的数量进行预测结果如上图所示,预测图为(3)SAS程序为data a;input x@@;dif1=dif(x);t=1867+_n_-1;format time year4.;cards;2203 2360 2254 2165 2024 2078 2214 2292 2207 2119 211921372132 1955 1785 1747 1818 1909 1958 1892 1919 1853 186819912111 2119 1991 1859 1856 1924 1892 1916 1968 1928 1898 18501841 1824 1823 1843 1880 1968 2029 1996 1933 1805 1713 17261752 1795 1717 1648 1512 1338 1383 1344 1384 1484 1597 16861707 1640 1611 1632 1775 1850 1809 1653 1648 1665 1627 1791;run;proc gplot data=a;plot x*t dif1*t;symbol c=black i=join v=dot;proc arima;identify var=x(1) ;estimate p=(13) noint;forecast lead=7id=t out=out;proc gplot data=out;plot x*t=1 forecast*t=2 l95*t=3 u95*t=3/overlay;symbol1c=black i=none v=star;symbol2 c =red i =join v =none; symbol3 c =green i =join v =none; run ;问题2,使用Auto-Regressive 模型分析例5.9序列。
2021_2022学年高中生物第五章生态系统及其稳定性第4节生态系统的信息传递1作业含解析新人教版必

生态系统的信息传递一、选择题(每小题5分,共60分)1.有关生态系统信息传递的叙述中,错误的是( )A.信息传递把生态系统各组分联系起来成为一个整体B.生态系统的反馈调节必须依赖于生态系统的信息传递C.生态系统中用于传递的信息都是由生物产生的D.生物之间的捕食关系可通过信息传递实现【解析】信息传递把生态系统各组分联系起来成为一个整体,A正确;生态系统的反馈调节必须依赖于生态系统的信息传递,B正确;生态系统中用于传递的信息有物理信息、化学信息和生物信息,C错误;生物之间的捕食关系可通过信息传递实现,D正确。
【答案】 C2.为了控制甘蔗害虫,有人将蔗蟾带入澳大利亚。
由于蔗蟾的皮肤会产生毒素,起初袋鼬等蔗蟾的捕食者出现大量死亡的现象,但现在,袋鼬学会了只吃蔗蟾的幼仔而不吃毒性更强的成体。
蔗蟾和袋鼬之间肯定不存在( )A.物质循环B.能量流动C.信息传递 D.共同进化【解析】从题干中可以看出蔗蟾与袋鼬之间为捕食关系,都是消费者,消费者和消费者之间不可能实现物质循环,故A错误;袋鼬捕食蔗蟾的过程中,蔗蟾同化的能量中有一部分流向了袋鼬,故B正确;袋鼬捕食蔗蟾的过程中一定会发生信息传递,并且信息传递是双向的,故C正确;具有捕食关系的两种生物共同进化,以适应环境,故D正确。
【答案】 A3.下列有关生态系统信息传递的说法,不正确的是( )A.任何生命形式,如果没接收信息、处理信息和利用信息的能力,就无法适应环境B.信息传递在农业生产中,不仅可以提高农产品的产量,也可对有害动物进行杀灭C.延长短日照植物黄麻的光照时间可提高麻皮产量,这属于物理信息的合理使用D.在任何生态系统中,能量、物质和信息三者之间的关系都是密不可分的【解析】任何生命形式,如果没接收信息、处理信息和利用信息的能力,就无法适应环境,A正确;信息传递在农业生产中,不仅可以提高农产品的产量,也可对有害动物进行控制而不是杀灭,B错误;延长短日照植物黄麻的光照时间可提高麻皮产量,这属于物理信息的合理使用,C正确;在任何生态系统中,能量、物质和信息三者之间的关系都是密不可分的,D正确。
第五章-异方差性(作业任务)
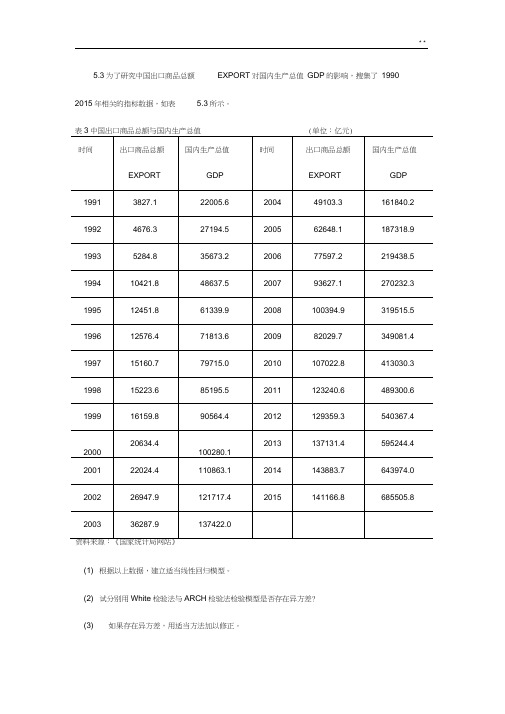
5.3为了研究中国出口商品总额EXPORT对国内生产总值GDP的影响,搜集了1990 2015年相关的指标数据,如表 5.3所示。
(1) 根据以上数据,建立适当线性回归模型。
(2) 试分别用White检验法与ARCH检验法检验模型是否存在异方差?(3) 如果存在异方差,用适当方法加以修正。
解:(1)Dependent Variable: YMethod: Least SquaresDate: 04/18/20 Time: 15:38Sample: 1991 2015Included observations: 25Variable Coefficient Std. Error t-Statistic Prob.C -673.0863 15354.24 -0.0438370.965 4X 4.061131 0.201677 20.136840.000 0R-squared 0.946323 Mean dependent var234690. 8Adjusted R-squared 0.943990 S.D. dependent var210356. 7S.E. of regression 49784.06 Akaike info criterion 24.5454Sum squared resid 5.70E+10 Schwarz criterion 24.64291 Log likelihood -304.8174 Hannan-Quinn criter. 24.57244F-statistic 405.4924 Durbin-Watson stat 0.366228Prob(F-statistic) 0.000000模型回归的结果:AY 673.0863 4.0611X it ( 0.0438 )(20.1368)R20.9463, n 25(2) white:该模型存在异方差Heteroskedasticity Test: WhiteF-statistic 4.493068 Prob. F(2,22) 0.0231Obs*R-squared 7.250127 Prob. Chi-Square(2) 0.0266 Scaled explained SS 8.361541 Prob. Chi-Square(2) 0.0153Test Equation:Dependent Variable: RESIDEMethod: Least SquaresDate: 04/18/20 Time: 17:45Sample: 1991 2015Included observations: 25Variable Coefficient Std. Error t-Statistic Prob.C -1.00E+09 1.43E+09 -0.7003780.491 0XA2 -0.455420 0.420966 -1.081847 0.2910 X 102226.2 60664.19 1.685117 0.1061R-squared 0.290005 Mean dependent var2.28E+0 9Adjusted R-squared 0.225460 S.D. dependent var 3.84E+09S.E. of regression 3.38E+09 Akaike info criterion 46.83295Sum squared resid 2.51E+20 Schwarz criterion 46.97922 Log likelihood -582.4119 Hannan-Quinn criter. 46.87352F-statistic 4.493068 Durbin-Watson stat 0.749886Prob(F-statistic) 0.023110ARCH检验:该模型存在异方差Test Equation:Dependent Variable: RESID A2Method: Least SquaresDate: 04/18/20 Time: 19:55Sample (adjusted): 1992 2015Included observations: 24 after adjustmentsVariableCoefficient Std. Error t-Statistic Prob. C8.66E+08 6.92E+08 1.251684 0.2238RESID A 2(-1) 0.817146 0.1889444.3248020.0003 R-squared0.459511 Mean dependent var 2.37E+09 Adjusted R-squared 0.434944 S.D. dependent var 3.90E+09S.E. of regression 2.93E+09 Akaike info criterion 46.51293 Sum squared resid 1.89E+20 Schwarz criterion 46.61110 Log likelihood -556.1552 Hannan-Quinn criter. 46.53898 F-statistic 18.70391Durbin-Watson stat0.888067Prob(F-statistic)0.000273(3)修正:加权最小二乘法修正却 WF Woricflil-ri UTLECi id tl e^cJ\ i « T t"l t-|<p-r f T 护i ■"i-i ■「■ H 1 < ~HV Prbll 1 T ffM r« 11 BHR 7 F r F -K * J *■ J —厂ilTHL 日芦£臼电*电引 OdiJ 1 0*左(■ 20 3>5r^lucilifl -MI^I TGR 1 Z7Q I S w= — T ,皿”=E Ba^-oa 山口 fE=-UH a P -OE = -口曰 3.2 1 且-口9 I B 之与尸-口口 ti .3-Z2E-DO 出q,峙尸・C 旦( 4.3-1 E-O^3 0 3IE 09 N.HMU O-QI 立o 右匚> - nO4 TDE--W Z.&15^=- DC1 hi-tiE - "IIIJ i. um r ci Q SJ ^F -iii i 旦日二-①口Dependent Variable: Y Method: Least Squares Date: 04/18/20 Time: 20:46 Sample: 1991 2015Included observations: 25 Weighting series: W2Weight type: Inverse variance (average scaling)VariableCoefficientStd. Errort-StatisticProb.C 10781.17 2188.706 4.925821 0.0001 X3.9316060.19200420.476670.0000Weighted StatisticsR-squared0.947998 Mean dependent var 51703.40 Adjusted R-squared 0.945737 S.D. dependent var 11816.72 S.E. of regression 8420.515 Akaike info criterion 20.99135 Sum squared resid1.63E+09Schwarz criterion21.08886「工 P U 『匕 7 日nQ r U J-4m y Q M-n!R-0 Kc D 」a 口 9m 日0: B 吝口 oaooom 口 「1 ;「m =2 Q 工H rKLog likelihood -260.3919 Hannan-Quinn criter. 21.01839F-statistic 419.2938 Durbin-Watson stat 0.539863 Prob(F-statistic) 0.000000 Weighted mean dep. 39406.30 Unweighted StatisticsR-squared 0.944994 Mean dependent var234690. 8Adjusted R-squared 0.942602 S.D. dependent var 210356.7S.E. of regression 50396.82 Sum squared resid 5.84E+1修正后进行white检验:Heteroskedasticity Test: WhiteF-statistic 0.261901 Prob. F(2,22) 0.7720 Obs*R-squared 0.581387 Prob. Chi-Square(2) 0.7477 Scaled explained SS 0.211737 Prob. Chi-Square(2) 0.8995Test Equation:Dependent Variable: WGT_RESID A2Method: Least SquaresDate: 04/18/20 Time: 20:41Sample: 1991 2015Included observations: 25Collinear test regressors dropped from specificationVariable Coefficient Std. Error t-Statistic Prob.C 71441488 22046212 3.2405340.003 8X*WGTA2 -2711.961 5055.773 -0.536409 0.5971 WGTA2 13536351 20714871 0.653461 0.5202R-squared 0.023255 Mean dependent var 65232673 Adjusted R-squared -0.065539 S.D. dependent var 61762160 S.E. of regression 63753972 Akaike info criterion 38.89113Sum squared resid 8.94E+16 Schwarz criterion 39.03739 Log likelihood -483.1391 Hannan-Quinn criter. 38.9317F-statistic 0.261901 Durbin-Watson stat 0.898907Prob(F-statistic) 0.771953修正后的模型为AY 10781.17 3.931606X it (4.925821)(20.47667)R20.9480, n 255.4 表5.4的数据是2011年各地区建筑业总产值(X)和建筑业企业利润总额(Y)。
第五章 相关分析作业(试题及答案)
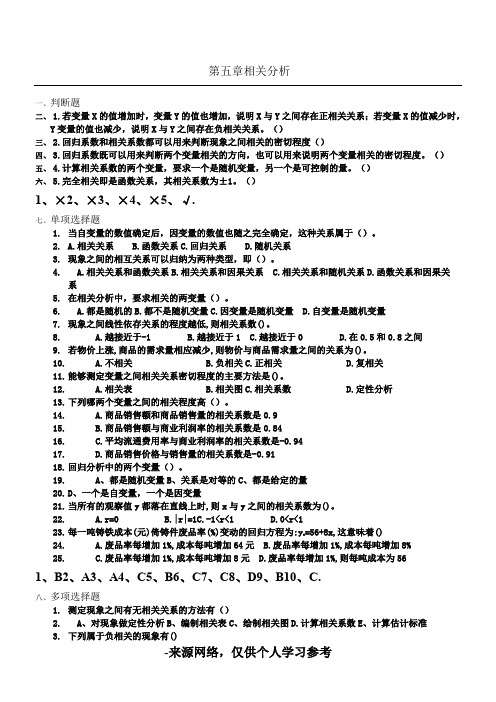
第五章相关分析一、判断题二、1.若变量X的值增加时,变量Y的值也增加,说明X与Y之间存在正相关关系;若变量X的值减少时,Y变量的值也减少,说明X与Y之间存在负相关关系。
()三、2.回归系数和相关系数都可以用来判断现象之间相关的密切程度()四、3.回归系数既可以用来判断两个变量相关的方向,也可以用来说明两个变量相关的密切程度。
()五、4.计算相关系数的两个变量,要求一个是随机变量,另一个是可控制的量。
()六、5.完全相关即是函数关系,其相关系数为±1。
()1七、1.2.3.4.5.6.7.8.9.22. A.r=0 B.|r|=1C.-1<r<1 D.0<r<123.每一吨铸铁成本(元)倚铸件废品率(%)变动的回归方程为:y c=56+8x,这意味着()24. A.废品率每增加1%,成本每吨增加64元 B.废品率每增加1%,成本每吨增加8%25. C.废品率每增加1%,成本每吨增加8元 D.废品率每增加1%,则每吨成本为561、B2、A3、A4、C5、B6、C7、C8、D9、B10、C.八、多项选择题1.测定现象之间有无相关关系的方法有()2.A、对现象做定性分析B、编制相关表C、绘制相关图D.计算相关系数E、计算估计标准3.下列属于负相关的现象有()4.A、商品流转的规模愈大,流通费用水平越低B、流通费用率随商品销售额的增加而减少5.C、国内生产总值随投资额的增加而增长D、生产单位产品所耗工时随劳动生产率的提高而减少E、产品产量随工人劳动生产率的提高而增加6.变量x值按一定数量增加时,变量y也按一定数量随之增加,反之亦然,则x和y之间存在()7.A、正相关关系B、直线相关关系C、负相关关系D、曲线相关关系8.E、非线性相关关系9.直线回归方程y c=a+bx中的b称为回归系数,回归系数的作用是()10.A、确定两变量之间因果的数量关系B、确定两变量的相关方向C、确定两变量相关的密切程度D、确定因变量的实际值与估计值的变异程度11.E确定当自变量增加一个单位时,因变量的平均增加量12.设产品的单位成本(元)对产量(百件)的直线回归方程为y c=76-1.85x,这表示()1九、1.2.3.4.5.6.7.8.1、1≤r<06、十、1.一种不完全的依存关系。
国际经济学第五章作业 内容

第五章作业内容1、假设挪威与瑞典相互贸易,挪威出口鱼,而瑞典出口沃尔沃汽车。
假定两国的消费偏好相同,但是生产可能性边界不同:挪威由于有较长的沿大西洋的海岸线,因此捕鱼效率高;瑞典的资本相对丰裕,故而汽车的生产效率高。
据此,根据标准贸易模型论述这两国的贸易利益。
2、在第一个问题的贸易情景中,由于过度捕鱼,挪威现在捕获的鱼量低于前些年。
这一变化不仅引起了挪威潜在产鱼数量的减少,而且导致了国际市场上鱼的相对价格的上涨。
a. 分析过度捕鱼导致挪威福利的下降。
b. 如果过度捕鱼可以提高挪威的福利水平,这将是如何实现的呢?3、在某些情况下,相对供给和价格的变动之间可能没有联系。
例如:如果生产要素在部门之间完全不可流动,生产可能性边界就会成为直角形状,两种产品的产出也不取决于它们的相对价格。
在这种情况下,贸易条件的改善是否会提高一国的福利水平请画图进行分析。
4、与供给方面要素不可流动性相当的就是需求方面的产品不可替代性。
试想一个国家的消费者购买的产品的比例是固定的。
例如,不论两种产品的相对价格是多少,每买1磅粮食就买1码棉布。
画图分析贸易条件的改善是否会提高这个国家的福利水平。
5、日本原本出口制造品进口原材料如石油、粮食。
分析以下情况日本贸易条件的变化。
a、中东战争使石油供应紧缺;b、韩国扩展了汽车的生产能力,并在美国和加拿大进行销售;c、美国的工程师建立了核反应堆以代替石油燃料发电厂;d、俄罗斯农业歉收;e、日本降低牛肉和柑橘的进口关税。
6、互联网使得诸如编程及技术支持等服务贸易增加,并且使得服务相对于制造品的价格下降。
印度尤其被认为是技术性服务的出口者,这曾经是美国的出口强项。
把制造品和服务看成可贸易品,为美印经济建立标准贸易模型,分析引起服务外包的可出口性服务的相对价格下降会降低美国的福利,而增加印度的福利。
7、A国和B国有两种生产要素——资本和劳动,用于生产两种产品——X和Y。
两国的技术水平一样,X是资本密集产品,A国是资本充裕的国家。
组织行为学作业——第5章 领导行为
组织行为学第三次作业姓名学号第5章领导行为一、单选1.能力是()的综合体现。
A.性格B.魅力C.体力D.知识和智慧2.领导的连续流理论是()提出的。
A.勒温B.坦南鲍母和施密特C.利克特D.莫顿3.一般认为,管理方格图中,最有效的领导方式有()A.贫困型B.任务第一型C.俱乐部型D.团队式4.“途径——目标”理论是()提出的。
A.菲德勒B.豪斯C.布莱克D.耶顿5.管理系统理论是由()提出的。
A.菲德勒B.豪斯 C .利克特 D.布莱克6.关于领导方式的研究最早是由心理学家()进行的,他认为存在着三种极端的领导工作方式。
A.坦南鲍母B.利克特C.布莱克D.勒温7.布莱克和莫顿认为()的领导方式是最有效的。
A.贫乏型B.俱乐部型C.团队式D.中间型8.领导者给下级提出挑战性的目标,并相信他们能达到目标是“途径--目标“理论中()领导方式。
A.支持型B.参与型C.指导型D.以成就为目标9.主要依靠行政命令.纪律约束.训斥和惩罚,只有偶尔的奖励是()领导方式。
A.专制方式B.民主方式C.放任自流方式D.协商式10.通晓马列主义,了解社会科学方面知识,比较精通管理科学方面的知识及熟悉社会生活方面的知识是领导者()素质。
A.政治素质B.能力素质C.知识素质D.身心素质11.领导者能积极发掘人才,善于培养和使用人才,并且创造条件发挥组织内每个人专长的能力是()A.决断能力B.人际交往能力C.组织指挥能力D.知人善任能力12.()提出了不成熟——成熟理论A.菲德勒B.豪斯C.布莱克D.阿吉里斯13.一般正常人都会从不成熟到趋于成熟,每个人随着年龄的增长有日益成熟的倾向,但能达到完全成熟的人是()。
A.大多数人B.极少数人C.一半人D.所有人二、多选1.鲍莫尔认为企业领导人应具有的条件是()A.合作精神B.决策能力C.领导能力 D .敢于创新 E.尊重他人2.概括起来,我国优秀的领导者的素质应当包括()A.政治素质B.知识素质C.协调素质D.能力素质E.身心素质3.勒温认为存在着()的领导工作方式。
微观经济第五章作业(附答案)
1、已知某厂商的短期生产函数为32921L L L Q -+=。
(1)写出劳动的平均产量L AP 函数和边际产量L MP 函数; (2)分别计算总产量、平均产量和边际产量的最大值;(3)证明当平均产量达到极大时,劳动的平均产量和边际产量相等。
解:(1) 根据32921L L L TP L -+= 可得:2921L L LTP AP L L -+==231821L L dQ dTP MP LL -+==(2)边际产量为零时,总产量最大 即 0318212=-+L L 解得 7=L (1-=L 不合题意) 代入24592132=-+=L L L TP L 同样,对于平均产量函数2921LL AP L -+=L AP dLdL 29-= 令0=L AP dLd即 029=-L 得 5.4=L(5.4=L 也可用L L MP AP =,即 2231821921L L L L -+=-+求得) 又因为02<-=⎪⎭⎫⎝⎛L AP dL d dL d 所以5.4=L 为平均产量达到极大时厂商雇用的劳动。
代入 2921L L AP L -+= 得平均产量AP L 的最大值为41.25 。
同样,对于231821L L MP L -+=L MP dLdL 618-= 令0=L MP dLd即 0618=-L 得 3=L又因为06<-=⎪⎭⎫⎝⎛L MP dL d dL d 所以3=L 为边际产量达到极大时厂商雇用的劳动。
将3=L 代入231821L L MP L -+=得到边际产量MP L 的最大值为48。
(3)证明:从(2)中可知:当5.4=L 时劳动的平均产量达到极大值为41.25而当5.4=L 时,劳动的边际产量25.41318212=-+=L L MP L 所以当平均产量达到极大时,劳动的平均产量和边际产量相等。
2、已知某企业的单一可变投入(X )与产出(Q )的关系如下:Q=1000X+10002X -23X ,当X 分别为200、300、400单位时,其边际产量和平均产量各为多少?它们分别属于哪一个生产阶段?该函数的三个生产阶段分界点的产出量分别为多少?解:TP=1000X+10002X -23X MP=1000+2000X-62X AP=1000+1000X-22XX=200 MP=161000 AP= 121000 X=300 MP=61000 AP= 121000 X=400 MP= -159000 AP= 81000 MP= AP, X=250MP=0,1000+2000X-62X =0,610060001000+=X =334第一阶段和第二阶段的分界点是X =250 ,第二阶段和第三阶段的分界点是334 因此,X=200处于第一阶段,X=300处于第二阶段;X=400处于第三阶段。
国际经济学作业答案-第五章
Chapter 5 The Standard Trade ModelMultiple Choice Questions1. The concept “terms of trade” means(a) the amount of exports sold by a country.(b) the price conditions bargained for in international markets.(c) the price of a country’s exports divided by the price of its imports.(d) the quantities of imports received in free trade.(e) None of the above.Answer: C2. A country cannot produce a mix of products with a higher value than where(a) the isovalue line intersects the production possibility frontier.(b) the isovalue line is tangent to the production possibility frontier.(c) the isovalue line is above the production possibility frontier.(d) the isovalue line is below the production possibility frontier.(e) the isovalue line is tangent with the indifference curve.Answer: B3. Tastes of individuals are represented by(a) the production possibility frontier.(b) the isovalue line.(c) the indifference curve.(d) the production function.(e) None of the above.Answer: C4. If P C/P F were to increase in the international marketplace, then(a) all countries would be better off.(b) the terms of trade of cloth exporters improve.(c) the terms of trade of food exporters improve.(d) the terms of trade of all countries improve.(e) None of the aboveAnswer: B5. If P C/P F were to increase,(a) the cloth exporter would increase the quantity of cloth exports.(b) the cloth exporter would increase the quantity of cloth produced.(c) the food exporter would increase the quantity of food exports.(d) Both (a) and (c).(e) None of the above.Answer: B6. If P C/P F were to increase,(a) world relative quantity of cloth supplied and demanded would increase.(b) world relative quantity of cloth supplied and demanded would decrease.(c) world relative quantity of cloth supplied would increases.(d) world relative quantity of cloth demanded would decrease.(e) None of the above.Answer: C7. When the production possibility frontier shifts out relatively more in one direction, we have(a) biased growth.(b) unbiased growth.(c) immiserizing growth.(d) balanced growth.(e) imbalanced growth.Answer: A8. Export-biased growth in Country H will(a) improve the terms of trade of Country H.(b) trigger anti-bias regulations of the WTO.(c) worsen the terms of trade of Country F (the trade partner).(d) improve the terms of trade of Country F.(e) decrease economic welfare in Country H.Answer: D9. Immiserizing growth is(a) likely to occur if the exporting country is poor.(b) likely to occur if the exporting country is rich.(c) likely to occur when terms of trade change.(d) likely to occur if relative supplies are elastic.(e) None of the above.Answer: Eword格式-可编辑-感谢下载支持10. If the U.S. Agency for International Development transfers funds to poor countries in Sub-SaharanAfrica, this must(a) worsen the U.S. terms of trade.(b) improve the U.S. terms of trade.(c) worsen the terms of trade of the African aid recipients.(d) improve the terms of trade of the African aid recipients.(e) None of the above.Answer: E11. If the poor USAID recipient countries have a higher marginal propensity to consume each and everyproduct than does the United States, then such aid will(a) worsen the U.S. terms of trade.(b) improve the U.S. terms of trade.(c) leave the world terms of trade unaffected.(d) worsen the terms of trade of both donor and recipient countries.(e) None of the above.Answer: B12. If the U.S. has a higher marginal propensity to consume (MPC) imports as compared to both its MPC forexportables and nontradables, then such aid will(a) worsen the U.S. terms of trade.(b) improve the U.S. terms of trade.(c) leave the world terms of trade unaffected.(d) worsen the terms of trade of both donor and recipient countries.(e) None of the above.Answer: B13. If the U.S. (a large country) imposes a tariff on its imported good, this will tend to(a) have no effect on terms of trade.(b) improve the terms of trade of all countries.(c) improve the terms of trade of the United States.(d) cause a deterioration of U.S. terms of trade.(e) raise the world price of the good imported by the United States.Answer: C14. If the U.S. (a large country) imposes a tariff on its imported good, this will(a) have no effect on economic welfare.(b) improve the terms of trade of all countries.(c) improve the economic welfare of the United States.(d) harm the economic welfare of U.S.’ trading partners.(e) None of the aboveAnswer: D15. A country will be able to consume a bundle which is not attainable solely from domestic production onlyif(a) the world terms of trade differ from its domestic relative costs.(b) the country specializes in one product.(c) the country avoids international trade.(d) the world terms of trade equal the domestic relative costs.(e) None of the above.Answer: A16. Terms of trade refers to(a) what goods are imported.(b) what goods are exported.(c) the volume of trade.(d) the prices at which trade occurs.(e) None of the above.Answer: D17. If a country’s (net-barter) terms of trade increase (“improve”) we know from this th at economic welfarein this country(a) increases(b) increases, but only relative to that of its trade partners(c) is unchanged(d) decreases(e) None of the aboveAnswer: E18. If points a and b are both on the production possibility frontier of a country, then(a) consumers are indifferent between the two bundles.(b) producers are indifferent between the two bundles.(c) at any point in time, the country could produce both.(d) Both cost the same.(e) The country could produce either of the two bundles.Answer: E19. If the economy is producing at point a on its production possibility frontier, then(a) all of the country’s workers are specialized in one product.(b) all of the county’s capital is used for one product.(c) all of the county’s workers ar e employed.(d) all of its capital is used, but not efficiently.(e) None of the above.Answer: Cword格式-可编辑-感谢下载支持20. If at point A on the production possibility frontier, and the community indifference curve cuts throughpoint a from northwest to southeast, then the optimal autarky production bundle is(a) at point A.(b) to the right of point A.(c) to the left of point A.(d) to the northeast of point A.(e) to the southwest of point A.Answer: B21. A bundle indicated by a point to the northeast of the production possibility frontier is(a) unattainable at a point in time.(b) unattainable at a point in time without international trade.(c) unattainable at a point in time without domestic trade.(d) unattainable as a consumption point.(e) None of the above.Answer: B22. If two countries with diminishing returns and different marginal rates of substitution between twoproducts were to engage in trade, then(a) the shapes of their respective production possibility frontiers would change.(b) the marginal rates of substitution of both would become equal.(c) the larger of the two countries would dominate their trade.(d) the country with relatively elastic supplies would export more.(e) None of the above.Answer: B23. If a country began exporting product A and importing product B, then, as compared to the autarky (no-trade) situation, the marginal cost of product A will(a) increase.(b) decrease.(c) shift outward.(d) shift inward.(e) None of the above.Answer: A24. If, beginning from a free trade equilibrium, the (net barter) terms of trade improve for a country, then itwill(a) increase production of its import competing good.(b) increase consumption of its export good.(c) increase the quantity of its imports.(d) experience an export-biased shift in its production possibility frontier.(e) None of the above.Answer: C25. If a small country were to levy a tariff on its imports then this would(a) have no effect on that country’s economic welfare.(b) increase the country’s economic welfare.(c) decrease the coun try’s economic welfare.(d) change the terms of trade.(e) None of the above.Answer: C26. An increase in a country’s net commodity terms of trade will always(a) increase the country’s economic welfare.(b) increase the country’s real income.(c) increas e the country’s quantity of exports.(d) increase the country’s production of its import competing good.(e) None of the above.Answer: E27. After WWI, Germany was forced to make large reparations—transfers of real income- to France. If themarginal prope nsity to consume was equal in both countries, and if France’s demand was biased toward food (relative to Germany’s demand pattern) then we would expect to find(a) the world’s relative price for food remains unchanged.(b) the world’s relative price for fo od increase.(c) the world’s relative price for food decrease.(d) the world relative price for both food and non-food rise.(e) None of the above.Answer: B28. If we add to Question 27 that France exported manufactures, whereas Germany exported food, then thereparations from Germany to France would(a) improve France’s international terms of trade.(b) cause France’ terms of trade to deteriorate.(c) cause both France’ and Germany’s terms of trade to deteriorate.(d) cause both France’ and Germany’s term s of trade to improve.(e) None of the above.Answer: B29. If a country lent money to another, this must(a) lower the terms of trade of the recipient country.(b) lower the terms of trade of both countries.(c) improve the terms of trade of the recipient country.(d) improve the terms of trade of the donor country(e) None of the above.Answer: Eword格式-可编辑-感谢下载支持30. During the 19th Century, economic growth of the major trading countries was biased towardmanufactures and away from food. The less developed countries of that time were net exporters of food.From this information, we would expect to have observed(a) falling terms of trade for the less developed countries.(b) improving (rising) terms of trade for the less developed countries.(c) no change at all in the terms of trade of the less developed countries.(d) a decrease in the relative price of food.(e) None of the above.Answer: B31. Immiserizing growth could occur to(a) a poor country experiencing export-biased economic growth.(b) a poor country experiencing import-biased economic growth.(c) a poor country experiencing growth in its non-traded sector.(d) a poor country experiencing capital-intensive biased growth.(e) None of the above.Answer: A32. A large country experiencing import-biased economic growth will tend to experience(a) positive terms of trade.(b) deteriorating terms of trade.(c) improving terms of trade.(d) immiserizing terms of trade.(e) None of the above.Answer: C33. In the period preceding the recent Financial Crisis in Asia, the South East Asian countries were receivinglarge inflows of financial capital. Following John Maynard Keynes’ theory, this should have caused(a) a glut in their banking asset situation.(b) an improvement in their terms of trade.(c) deterioration in their terms of trade.(d) a fluctuation upward and then downward in their terms of trade.(e) None of the above.Answer: B34. If Slovenia is a small country in world trade terms, then if it imposes a large series of tariffs on many ofits imports, this would(a) have no effect on its terms of trade.(b) improve its terms of trade.(c) deteriorate its terms of trade.(d) decrease its marginal propensity to consume.(e) None of the above.Answer: A35. If Slovenia is a large country in world trade, then if it imposes a large set of tariffs on many of itsimports, this would(a) have no effect on its terms of trade.(b) improve its terms of trade.(c) deteriorate its terms of trade.(d) decrease its marginal propensity to consume.(e) None of the above.Answer: B36. If Slovenia were a large country in world trade, then if it imposes a large set of tariffs on its imports, thismust(a) cause retaliation on the part of its trade partners.(b) harm Slovenia’s real income.(c) improve Slovenia’s real income.(d) improve the real income of its trade partners.(e) None of the above.Answer: E37. If Slovenia were a large country in world trade, then if it instituted a large set of subsidies for its exports,this must(a) have no effect on its terms of trade.(b) improve its terms of trade.(c) deteriorate its terms of trade.(d) decrease its marginal propensity to consume.(e) None of the above.Answer: C38. If Slovenia were a large country in world trade, then if it instituted a large set of subsidies for its exports,this must(a) cause retaliation on the part of its trade partners.(b) harm Slovenia’s real income.(c) improve Slovenia’s real income.(d) improve the real income of its trade partners.(e) None of the above.Answer: D39. If the United States exports skilled-labor intensive products and services, then we should expect unionsrepresenting skilled labor to(a) lobby in favor of tariffs.(b) lobby against the imposition of tariffs.(c) be indifferent to the issue of tariffs.(d) lobby in favor of improved terms of trade.(e) Not enough information.Answer: Eword格式-可编辑-感谢下载支持40. If the United States exports skilled-labor intensive products and services, then we should expect unionsrepresenting unskilled labor to(a) lobby in favor of tariffs.(b) lobby against the imposition of tariffs.(c) be indifferent to the issue of tariffs.(d) lobby in favor of improved terms of trade.(e) Not enough information.Answer: B41. If a there are no international loans or capital flows, then if a country’s terms of trade improve, we wouldfind that(a) the value of its exports exceeds the value of its imports.(b) the value of its exports becomes less than that of its imports.(c) the value of its exports exactly equals that of its imports.(d) the quantity of its exports equals that of its imports.(e) None of the above.Answer: C42. If the U.S. Agency for International Development transfers funds to poor countries in Sub-SaharanAfrica, the conventional assumption, following Keynes’ analysis would presume that this would tend to(a) worsen the U.S. terms of trade.(b) improve the U.S. terms of trade.(c) worsen the terms of trade of the African aid recipients.(d) improve the terms of trade of the African aid recipients.(e) None of the above.Answer: AEssay Questions1. Other things bei ng equal, a rise in a country’s terms of trade increases its welfare. What would happen ifwe relax the ceteris paribus assumption, and allow for the law of demand to operate internationally?Answer: Let us assume that the terms of trade (or technically the net commodity terms of trade) improve, thus the relative price of a country’s exports increase. This would, logically, lead to ashift away by world consumers to substitute goods. If the demand for a country’s exports iselastic, the quantity decrease would be proportionally larger than the per unit price increase.This term of trade effect would actually lower the country’s real income and economic welfare.2. If a country’s growth is biased in favor of its import, this should unequivocally improve its terms oftrade and its economic welfare. Discuss.Answer: Suppose Japan experiences economic growth biased in favor of its import substitutes. For example, assume that Japan imports components and exports final goods, but that itexperiences a major growth in its components manufacture sector. Since Japan isinternationally a large country in these markets, this would tend to hurt its componentsupplier’s terms of trade (and help Japan’s). However, such a bias in economic growth maytend to lessen the volume of international trade. At an extreme, Japan may become an exporterof components and an importer of final goods. If the result is a lessening of specialization andof the volume of trade, then this effect will lower Japan’s welfare associated with gains fromtrade. If an actual change in the pattern of comparative advantage occurs (a possibility) thismay cause dynamic dislocations whose harm overpowers static gains for a relatively longperiod of time.3. It is impossible for economic growth in a small country to lower that country’s economic welfare,regardless of the bias of the growth. Explain.Answer: This is a true statement. The reason economic growth may hurt a country is if the terms of trade effect counters and dominates the growth effect. In the case of the small country there isno terms of trade effect.4. At the conclusion of World War I, Germany, as a punishment, was obliged to make a large transfer toFrance in the form of reparations. Is it possible that the actual reparations may have improvedGermany’s economic welfare?Answer: Such a result is not likely. However, theoretically, if France’s income elasticity of demand for Germany’s exports was higher than Germany’s income elasticity of demand for its ownexportable, then the real income transfer associated with these reparations may have improvedGermany’s terms of trade, and improved its balance of payments, thus helping Germany inmanner unanticipated in the Treaty of Verssaille. Explain.5. An export subsidy has the opposite effect on terms of trade to the effect of an import tariff. Domesticallya tariff will raise the price of the import good, deteriorating the domestic terms of trade. A productionsubsidy for the export product will lower the local price of the export good, lowering the domestic terms of trade for the country. Hence the export subsidy and the import tariff have the same effect. Thisanalysis seems to contradict the first sentence in this paragraph. Discuss this paradox.Answer: While this (Lerner) equivalence may well occur domestically, internationally the tariff will improve a country’s terms of trade. An export subsidy on the other hand will in fact lower theinternational price of the (now readily available) export good, hence hurting a country’s termsof trade.6. If a country’s net barter terms of trade improve (increase), it is possible that this could decrease the valueof its exports demanded, and hence harm its economic welfare. Discuss this possibility. What alternative measure for “terms of trade” does this suggest?Answer: An “improvement” in the terms of trade occurs when the price of a country’s exports rises by more than the price of its imports. If demand for this country’s exports is inelastic, then thiscould decrease demand for its exports in the world. This is treated under the topics of theMarshal-Lerner conditions for the effects of a depreciation on the balance of payments. Thissuggests that we may wish to use some kind of “income terms of trade,” the would explicitlyconsider both changes in relative tradeables prices, and also quantities of export (the latter notdealt with by the net barter terms of trade).word格式-可编辑-感谢下载支持Quantitative/Graphing Problems1. Albania refused to engage in international trade for ideological reasons. To maximize its economicwelfare it would choose to produce at which point in the diagram above? Suppose the P A/P B at point a was equal to 1. Given this information, in which good (A or B) does Albania enjoy a comparativeadvantage?Now that the Cold War is over, Albania is interested in obtaining economic welfare gains from trade.The relevant international relative price is P A/P B = 2. Albania would therefore choose to produce atwhich point (a, b, or c)? Given this additional information, in which good does Albania enjoy acomparative advantage?Answer: Albania would choose to produce at point a. With no reference to world terms of trade, one cannot establish Albania’s comparative advantage.Later, when Albania discovers that the relative price of A equals twice the price of B, it knowsthat it has a comparative advantage in A. Therefore Albania would produce at production pointb.2. Now, suppose that the relative price of A is actually not higher than Albania’s autarkic level of 1, butquite the opposite (e.g. P A/P B = 0.5). Would Albania still be able to gain from trade? If so, where would be its production point? Given the information in this question, where is Albania’s comparativeadvantage?Answer: Yes. As long as the world’s terms of trade differed from thos e of Albania, that country stands to gain from international trade. In this particular case, its point of production with trade wouldbe at point c.3. Suppose, as a result of various dynamic factors associated with exposure to international competition,Albania’s economy grew, and is now represented by the rightmost production possibility frontier in the Figure above. If its point of production with trade was point c, would you consider this growth to be export-biased or import biased? If Albania were a large country with respect to the world trade of A and B, how would this growth affect Albania’s terms of trade? Its real income?Answer: If point c is the production point with trade, then Albania has a comparative advantage in goodB. Therefore, from the shape of the new production possibility frontier (as compared to theoriginal one), this is clearly an export-biased growth. This ceteris paribus would tend toworsen Albania’s terms of trade. The terms of trade effect would, again ceteris paribus,worsen its real income. However, the growth itself acts in the opposite direction.4. Suppose, as a result of various dynamic factors associated with exposure to international competition,Albania’s economy grew, and is now represented by the ri ghtmost production possibility frontier in the Figure above. If its point of production with trade was point b, would you consider this growth to be export-biased or import biased? If Albania were a large country with respect to the world trade of A and B, how would this growth affect Albania’s terms of trade? Its real income? What if Albania were a small country?Answer: If the production with trade point was point b,then the observed growth is a case of import-biased growth, and would improve Albania’s t erms of trade. If Albania were a small country,the world’s terms of trade would not change at all. In such a case, economic growth (with noinduced change in income distributions) would always increase its real income.word格式-可编辑-感谢下载支持5. Suppose Albania is exporting product B, and experienced economic growth biased in favor of product Bas seen in the Figure above. We are also told that Albania’s new consumption point is at point d. Would you still consider the economic growth, which took place biased in favor of B? If Albania were a large country how would this growth affect its terms of trade?Answer: This is a relatively difficult case. On the one hand, the growth is still technically export biased.However, Albania’s consumption clearly shifted in favor of its import product, A. In this case,the deterioration in the terms of trade would be much more pronounced than before, and maylead to a case of immiserizing growth. However, for this to occur, there must have been amajor shift in the taste patterns (the old community indifference map is not longer applicable).Therefore, when we try to judge the direction and magnitude of the welfare change, we arecomparing the old versus new taste preferences, which raises the classic index numberproblem.。
国际经济学第五章作业内容word精品
第五章作业内容1、假设挪威与瑞典相互贸易,挪威出口鱼,而瑞典出口沃尔沃汽车。
假定两国的消费偏好相同,但是生产可能性边界不同:挪威由于有较长的沿大西洋的海岸线,因此捕鱼效率高;瑞典的资本相对丰裕,故而汽车的生产效率高。
据此,根据标准贸易模型论述这两国的贸易利益。
2、在第一个问题的贸易情景中,由于过度捕鱼,挪威现在捕获的鱼量低于前些年。
这一变化不仅引起了挪威潜在产鱼数量的减少,而且导致了国际市场上鱼的相对价格的上涨。
a. 分析过度捕鱼导致挪威福利的下降。
b. 如果过度捕鱼可以提高挪威的福利水平,这将是如何实现的呢?3、在某些情况下,相对供给和价格的变动之间可能没有联系。
例如:如果生产要素在部门之间完全不可流动,生产可能性边界就会成为直角形状,两种产品的产出也不取决于它们的相对价格。
在这种情况下,贸易条件的改善是否会提高一国的福利水平?请画图进行分析。
4、与供给方面要素不可流动性相当的就是需求方面的产品不可替代性。
试想一个国家的消费者购买的产品的比例是固定的。
例如,不论两种产品的相对价格是多少,每买 1 磅粮食就买 1 码棉布。
画图分析贸易条件的改善是否会提高这个国家的福利水平。
5、日本原本出口制造品进口原材料如石油、粮食。
分析以下情况日本贸易条件的变化。
a 、中东战争使石油供应紧缺;b 、韩国扩展了汽车的生产能力,并在美国和加拿大进行销售;c 、美国的工程师建立了核反应堆以代替石油燃料发电厂;d 、俄罗斯农业歉收;e 、日本降低牛肉和柑橘的进口关税。
6、互联网使得诸如编程及技术支持等服务贸易增加, 并且使得服务相对于制造品的价格下降。
印度尤其被认为是技术性服务的出口者,这曾经是美国的出口强项。
把制造品和服务看成可贸易品,为美印经济建立标准贸易模型,分析引起服务外包的可出口性服务的相对价格下降会降低美国的福利,而增加印度的福利。
7、A国和B国有两种生产要素资本和劳动,用于生产两种产品X和丫。
两国的技术水平一样,X是资本密集产品,A国是资本充裕的国家。
- 1、下载文档前请自行甄别文档内容的完整性,平台不提供额外的编辑、内容补充、找答案等附加服务。
- 2、"仅部分预览"的文档,不可在线预览部分如存在完整性等问题,可反馈申请退款(可完整预览的文档不适用该条件!)。
- 3、如文档侵犯您的权益,请联系客服反馈,我们会尽快为您处理(人工客服工作时间:9:00-18:30)。
第五章任玉杰作业
6.2 第六题
解:先保存名为lagranzi.m的M文件如下:
function [y,R]=lagranzi(X,Y,x,M)
n=length(X); m=length(x);
for i=1:m
z=x(i);s=0.0;
for k=1:n
p=1.0; q1=1.0; c1=1.0;
for j=1:n
if j~=k
p=p*(z-X(j))/(X(k)-X(j));
end
q1=abs(q1*(z-X(j)));c1=c1*j;
end
s=p*Y(k)+s;
end
y(i)=s;
end
R=M*q1/c1;
在matlab里输入主程序:
x=2*pi/9; M=1; X=[pi/6 ,pi/4, pi/3];Y=[0.5,0.7071,0.8660]; [y,R]=lagranzi(X,Y,x,M)
运行得结果:
y =
0.6434
R =
8.8610e-004
6.3 第四题
解:先保存牛顿插值调用函数:
function [y,R,A,C,L]=newdscg(X,Y,x,M)
n=length(X); m=length(x);
for t=1:m
z=x(t); A=zeros(n,n);A(:,1)=Y';
s=0.0; p=1.0; q1=1.0; c1=1.0;
for j=2:n
for i=j:n
A(i,j)=(A(i,j-1)- A(i-1,j-1))/(X(i)-X(i-j+1));
end
q1=abs(q1*(z-X(j-1)));c1=c1*j;
end
C=A(n,n);q1=abs(q1*(z-X(n)));
for k=(n-1):-1:1
C=conv(C,poly(X(k)));
d=length(C);C(d)=C(d)+A(k,k);
end
y(k)= polyval(C, z);
end
R=M*q1/c1;L(k,:)=poly2sym(C);
再输入主程序:
syms M,X=[-3,0,1,2]; Y =[27,1,2,17]; x=1.4;
[y,R,P]=newdscg(X,Y,x,M)
运行得结果:
y =
6.0120
R =
77/1250*M
P =
27.0000 0 0 0
1.0000 -8.6667 0 0
2.0000 1.0000 2.4167 0
17.0000 15.0000 7.0000 0.9167
6.4 第五题
给出节点数据(3.15)37.03f,(1.00)7.24f,(0.01)1.05f,03.215.3'f,
06.1700.1'f,
05.2301.0'f
作埃尔米特插值多项式,并写出估计其误差的公式。
解:
保存名为hermite.m的M文件:
function [Hc, Hk,wcgs,Cw]= hermite (X,Y,Y1,M1)
m=length(X); n=m-1;s=0; H=0;q=1;c1=1; L=ones(m,m); G=ones(1,m);
for k=1:n+1
V=1;
for i=1:n+1
if k~=i
s=s+(1/(X(k)-X(i)));
V=conv(V,poly(X(i)))/(X(k)-X(i));
end
h=poly(X(k));g=(1-2*h*s);G=g*Y(k)+h*Y1(k);
end
H=H+conv(G,conv(V,V));b=poly(X(k));b2=conv(b,b);
q=conv(q,b2);t=2*n+2;
Hc=H;Hk=poly2sym(H); Q=poly2sym(q);
end
for i=1:t
c1=c1*i;
end
syms M,wcgs=M*Q/c1; Cw=q/c1;
在MATLAB工作窗口输入程序
>>X=[-3.15,-1.00,0.01];Y=[37.03,7.24,1.05];Y1=[2.03,17.06,23.05];
[Hc,Hk,wcgs,Cw]=hermite(X,Y,Y1)
运行后输出埃尔米特插值多项式Hk及其系数向量Hc,误差公式wcgs及其系数向量Cw如下
Hc =
1.0e+02 *
Columns 1 through 5
0.136316058211219 0.954914816902903 2.153699318501380 1.563807894332014
0.236785931159195
Column 6
0.008078596636877
Hk =
(1918477965514565*x^5)/140737488355328 + (6719615646210121*x^4)/70368744177664 +
(1894413954740411*x^3)/8796093022208 + (5502159882963045*x^2)/35184372088832 +
(6664931445844529*x)/281474976710656 + 7276552960702781/9007199254740992
wcgs =
(M*(x^6 + (207*x^5)/25 + (1643574610260027*x^4)/70368744177664 +
(7226976987537243*x^3)/281474976710656 + (5292828581206899*x^2)/562949953421312 -
(3527858739303659*x)/18014398509481984 + 35749573842067/36028797018963968))/720
Cw =
Columns 1 through 5
0.001388888888889 0.011500000000000 0.032439722222222 0.035660250000000
0.013058267013889
Columns 6 through 7
-0.000271993750000 0.000001378125000
其上机如下图:
6.5 第二题
解:先保存名为xxczhjt1的M文件如下:
function s= xxczhjt1(x0,y0,xi,x,y)
s= interp1(x0,y0,xi);
Sn= interp1(x0,y0,x0);
plot(x0,y0,'o',x0,Sn,'-',xi,s,'*',x,y,'-.')
legend('节点(xi,yi)','分段线性插值函数Sn(x)','插值点(x,s)','被插值函数y')
再输入主程序如下:
>> h=2*pi/13; x0=-pi:h:pi;
y0=sin(3-cos(4*x0)./(1+25*x0.^2));
xi=-pi+h/2:h:pi-h/2;
fi= sin(3-cos(4*xi)./(1+25*xi.^2));
b=max(x0); a=min(x0);
x=a:0.001:b; y= sin(3-cos(4*x)./(1+25*x.^2));
si=xxczhjt1(x0,y0,xi,x,y);
Ri=abs((fi-si)./fi);
i=[xi',fi',si',Ri']
title('y= sin(3-cos(4 x)./(1+25 x^2))的分段线性插值的有关图形')
运行后得到结果:
i =
-2.8999 0.1438 0.1421 0.0115
-2.4166 0.1346 0.1370 0.0182
-1.9333 0.1424 0.1440 0.0117
-1.4500 0.1575 0.1487 0.0554
-0.9666 0.1106 0.1086 0.0186
-0.4833 0.0896 0.2184 1.4368
0 0.9093 0.3640 0.5997
0.4833 0.0896 0.2184 1.4368
0.9666 0.1106 0.1086 0.0186
1.4500 0.1575 0.1487 0.0554
1.9333 0.1424 0.1440 0.0117
2.4166 0.1346 0.1370 0.0182
2.8999 0.1438 0.1421 0.0115