Starburst in HS 0822+3542 induced by the very blue LSB dwarf SAO 0822+3545
一种用于星上半导体制冷器的温度控制方法

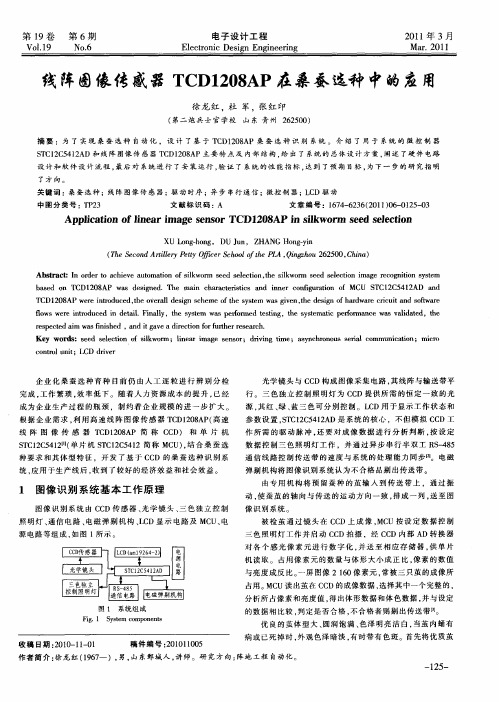
一种用于星上半导体制冷器的温度控制方法付智红【期刊名称】《空间电子技术》【年(卷),期】2016(013)003【摘要】The black-body calibration is the major in orbit measure method of Infrared Radiation camera. The tempera-ture controlling precision and stability of the device affect directly to the data validity of calibration. The refrigeration of blackbody facet is always realized by the semiconductor refrigeration. This paper introduces a design of a high accuracy tem-perature measuring and controlling method of the black-body based on constant current source temperature measuring cir-cuit, static temperature calibration method and PID controlling method. Compared with the traditional temperature measure-ment circuit,the method of temperature difference sampling in this method can obtain a wider dynamic range and a higher measuring accuracy. In order to exclude the interference noise of amplifier in the temperature measurement circuit and im-prove the accuracy of temperature measurement,the method of input and output direct calibration of static temperature cali-bration,and polynomial fitting of the calibration data were used. The blackbody temperature measurement precision can reach ± 0. 05℃. The piecewise PWM control method is combined with the PID algorithm to achieve high precision temperature control. The method is verified in the laboratory experiment.The temperature measurement and temperature control precision can reach the requirement of the index by tracking the temperature of the black body. This method has the advantages of higher precision,smaller size,wider applicability,and stronger transferability,so it can be widely used in infrared camera.%黑体定标是实现红外相机在轨非均匀性校正的主要手段,黑体温度的控温精度及稳定性决定了红外相机在轨定标的可靠性。
糊精 nadex 772 分子量

糊精 nadex 772 分子量英文回答:Dextrin NADEX 772 is a modified starch that is used as a food additive and thickener. It is produced byhydrolyzing starch with acids or enzymes, which breaks down the starch into smaller molecules. Dextrin NADEX 772 is a white or cream-colored powder that is soluble in water. It has a mild flavor and does not add any significant sweetness to food.Dextrin NADEX 772 is used in a variety of food products, including soups, sauces, gravies, and baked goods. It is also used as a binder and stabilizer in processed meats and poultry products. Dextrin NADEX 772 can help to thicken and stabilize food products, prevent syneresis, and improve texture.The molecular weight of dextrin NADEX 772 can vary depending on the degree of hydrolysis. Typically, themolecular weight of dextrin NADEX 772 ranges from 1,000 to 100,000 g/mol. The molecular weight of dextrin NADEX 772 can be measured using a variety of methods, including gel permeation chromatography (GPC) and light scattering.中文回答:糊精 nadex 772 是一种改性淀粉,用作食品添加剂和增稠剂。
PerkinElmer0822平板探测器

PerkinElmer0822平板探测器PerkinElmer 平板探测器型号XRD 0822 AOXRD 0822 APXRD 1611 XPXRD 1620 XN CSXRD 1621 XNXRD 1622 AOXRD 1622 APXRD 1642 APXRD 0820系列X射线数字平板探测器维修德国PerkinElmer XRD 0820系列X射线数字平板探测器维修电路板维修XRD 0822 系列X射线数字平板探测器XRD-EP电源维修EL448197IXS160BP500P063X10071-b00303VJT1011283X射线检测技术和返修技术领先厂商VJ T echnologies伟杰科技苏州RD0822 平板X射线探测器珀金埃尔默公司 XRD-0820-ES XRD-0840-ES主板电路板维修XRD 0820NA/CN/MN ESDEXELA 2315MAM DEXELA 2315MAM CL DEXELA 2923MAM CL Dexela 2321(In Development) Dexela 2321(In Development)Dexela 2321 DEXELA 1313LiteratureXRD 0822 AO, APXRD 1611 xPXRD 1622 AP3XRD 1622 AO, APXRD 1642 APXRpad 3025XRpad 4336XRpad 4343XRD 4343 RFXRD Series Product NoteXRD AccessoriesDEXELA NDTDEXELA Standard ProductsDEXELA MAM GigEDEXELA 2315 MAM CLDEXELA 2923 MAM CLDEXELA 1313DEXELA 2321大连PerkinElmer(珀金埃尔默.美国)XRD 0822平板X射线探测器XRD 8英寸(20厘米)平板X射线探测器丹东奥龙射线丹东市中讯安防XRD 0822 平板X射线探测器(FPDs)是PerkinElmer(珀金埃尔默.美国)公司出品的8英寸(20厘米)非晶硅的平板X射线探测器。
晶体穿墙接收器说明书

FeaturesFor surface mounted application Easy pick and placeMetal to silicon rectifier, majority carrier conduction Low power loss, high efficiency High current capability, low VF High surge current capabilityPlastic material used carriers Underwriters Laboratory Classification 94V-0 Epitaxial constructionHigh temperature soldering:260o C / 10 seconds at terminalsMechanical DataCase: JEDEC SMA/DO-214AC Molded plastic Terminals: Pure tin plated, lead free Polarity: Indicated by cathode band Packaging: 12mm tapeWeight: 0.064 gramMaximum Ratings and Electrical CharacteristicsRating at 25o C ambient temperature unless otherwise specified. Single phase, half wave, 60 Hz, resistive or inductive load.For capacitive load, derate current by 20%Type NumberSymbol SS 12 SS 13 SS 14 SS 15 SS 16 SS 19 SS 110 SS 120 Units Maximum Recurrent Peak Reverse Voltage V RRM 20 30 405060 90 100VMaximum RMS VoltageV RMS 14 21 283542 63 70150 V Maximum DC Blocking VoltageV DC 20 30 405060 90 100VMaximum Average Forward Rectified Current at T L (See Fig. 1)I (AV) 1.0A Peak Forward Surge Current, 8.3 ms Single Half Sine-wave Superimposed on Rated Load (JEDEC method )I FSM 30AMaximum Instantaneous Forward Voltage(Note 1) IF= 1.0A @ 25oC@ 100oCV F 0.50.40.75 0.650.800.700.90 0.85V 0.40.1 Maximum DC Reverse Current @ T A =25 oC atRated DC Blocking Voltage @ T A =125 oC I R 105.0 2.0mAmA Maximum DC Reverse Current at VR=33V& T A =50 oCHT IR -5.0uA Typical Junction Capacitance (Note 3) Cj50pFTypical Thermal Resistance ( Note 2 )R ΘJL R θJA 28 88 oC/WOperating Temperature Range T J -65 to +125 -65 to +150o C Storage Temperature Range T STG -65 to +150 oCNotes: 1.Pulse Test with PW=300 usec, 1% Duty Cycle2.Measured on P.C.Board with 0.2” x 0.2” (5.0mm x 5.0mm) Copper Pad Areas.3.Measured at 1 MHz and Applied Reverse Voltage of4.0V D.C.200200SMA/DO-214AC0.181(4.60)0.161(4.10)0.209(5.30)0.193(4.90)0.063(1.60)0.051(1.30)Dimensions in inches and(millimeters)SS 115 150105 150RATINGS AND CHARACTERISTIC CURVES (SS12THRU SS120)FIG.2-MAXIMUM NON-REPETITIVE FORWARDP E A K F O R W A R D S U R G E C U R R E N T .(A )30NUMBER OF CYCLES AT 60HzFIG.1-MAXIMUM FORWARD CURRENT DERATINGCURVEA V E R A G E F O R W A R D C U R R E N T .(A )0LEAD TEMPERATURE.(C)FIG.3-TYPICAL FORWARD CHARACTERISTICSI N S T A N T A N E O U S F O R W A R D C U R R E N T .(A ).2.4.6.81.01.21.41.61FORWARD VOLTAGE.(V)FIG.4-TYPICAL REVERSE CHARACTERISTICSI N S T A N T A N E O U S R E V E R S E C U R R E N T .(m A )1PERCENT OF RATED PEAK REVERSE VOLTAGE.(%)FIG.5-TYPICAL JUNCTION CAPACITANCEJ U N C T I O N C A P A C I T A N C E .(p F )REVERSE VOLTAGE.(V)FIG.6-TYPICAL TRANSIENT THERMALCHARACTERISTICST R A N S I E N T T H E R M A L I M P E D A N C E .(C /W )10.010.1101001001010.1T,PULSE DURATION.(sec)PACKAGE SPQ/PCS CARTON SPQ/PCS CARTON SIZE/CM CARTON GW/KG CARTON NW/KG SMA5000/REEL8000036X30.6X3112.0011.00。
与植物保护专业相关的太赫兹方面的资料

与植物保护专业相关的太赫兹方面的资料下载提示:该文档是本店铺精心编制而成的,希望大家下载后,能够帮助大家解决实际问题。
文档下载后可定制修改,请根据实际需要进行调整和使用,谢谢!本店铺为大家提供各种类型的实用资料,如教育随笔、日记赏析、句子摘抄、古诗大全、经典美文、话题作文、工作总结、词语解析、文案摘录、其他资料等等,想了解不同资料格式和写法,敬请关注!Download tips: This document is carefully compiled by this editor. I hope that after you download it, it can help you solve practical problems. The document can be customized and modified after downloading, please adjust and use it according to actual needs, thank you! In addition, this shop provides you with various types of practical materials, such as educational essays, diary appreciation, sentence excerpts, ancient poems, classic articles, topic composition, work summary, word parsing, copy excerpts, other materials and so on, want to know different data formats and writing methods, please pay attention!太赫兹技术是指波长在0.11mm之间的电磁波的利用技术。
线阵图像传感器TCDl208AP在桑蚕选种中的应用
企 业 化 桑 蚕 选 种 育 种 目前 仍 由人 工 逐 粒 进 行 辨 别 分 检
完 成 , 作 繁琐 , 率 低 下 。 随 着 人 力 资 源 成 本 的 提 升 , 经 工 效 已
光 学镜 头 与 C D构 成 图 像 采集 电路 , 线 阵 与 输送 带 平 C 其 行 。三 色 独 立 控 制 照 明 灯 为 C D提 供 所 需 的 恒 定 一 致 的 光 C
(h eodA i r e yO we S ho o h L Qn zo 6 50 C ia TeSc n nl yP t j r colfteP A, i h u22 0 , h )  ̄ t  ̄ g n
Ab ta t I r e c iv uo t n o i wo m e d s lc in, e sl w r s e ee t n i g e o n t n s s m s r c n o d rt a h e e a tmai fsl r s e ee t o o k o t i o m e d s l ci ma e r c g i o y t h k o i e b s d o D1 0 AP w s d sg e .T e a e n TC 2 8 a e in d h man h r ce it s a d i n r c n g r t n f MC S i c a a trs c n n e o f u ai o U TC1 C5 2 i i o 2 41 AD n ad T CD1 0 A r nr d c d, e o e al e in s h meo e s se w sgv n t e d sg fh r w r r u t n o t a e 2 8 P wee i t u e t v rl d s c e ft y tm a ie , e in o a d a e c c i a d s f r o h g h h i w
METHOD AND DEVICE FOR STABILIZING OPERATION FREQUE

专利名称:METHOD AND DEVICE FOR STABILIZING OPERATION FREQUENCY OF COLOR LASER 发明人:SUTEIIBUN EMU JIYARETSUTO,HARORUDO DEII DOU BOOZU申请号:JP7089280申请日:19800529公开号:JPS55158688A公开日:19801210专利内容由知识产权出版社提供摘要:A dye laser is stabilized for operation at a narrow line width by a control system which utilizes two reference interferometers.< P> One reference interferometer has a small free spectral range for stabilizing the frequency of operation of the dye laser at the relatively narrow line width, and the other reference interferometer has a free spectral range substantially larger than the first reference interferometer.The dye laser is servo locked to a side of a transmission fringe of the first reference interferometer to maintain operation at a selected frequency with the narrow line width in the absence perturbations that can cause a mode hop.When a perturbation does cause a mode hop, the second reference interferometer detects the extent and the direction of the mode hop. It then automatically stops the scanning system of the dye laser, resets the servo back to the selected frequency and restarts the scanning system of the dye laser in operation at the selected frequency, all within a short period of time.申请人:SPECTRA PHYSICS 更多信息请下载全文后查看。
HT-69020NP-0, HT-69030NP-0 Duct Probe RH Transmitt

HT-69020NP-0, HT-69030NP-0 Duct Probe RHTransmitter Installation GuideIntroductionThe HT-69 Series Duct Probe Relative Humidity (RH)Transmitters use a highly accurate and reliable thermosetpolymer-based capacitance humidity sensor and state-of-the-art digital linearization and temperature-compensated circuitry to monitor humidity levels in a duct. The humidity sensor is encapsulated in a 60 micron HDPE filter at the end of a 9 in. (230 mm) stainless steel (S/S) probe and a compact enclosure.Figure 1: HT-69 Duct Probe RH Transmitter DimensionsFigure 2: Dimensions of the HT-69 Duct Probe RH Transmitter*241102556A*Part No. 24-11025-56 Rev. A2022-11-11MountingThe transmitter installs directly into any air duct with a minimum width or diameter of 10 in. (25.5 cm).-Select a suitable installation area in the middle of the duct wall.-To achieve the best reading, do not place in an area where air stratification may be present.-Mount the sensor at least 5 ft. (1.5 m) in either direction from elbows, dampers, filters, or other duct restrictions.-Avoid areas that expose the transmitter to vibrations or rapid temperature changes.To install the transmitter, complete the following steps:1.When you select a suitable spot, drill a 0.6 in. (15mm) to 0.75 in. (20 mm) hole for the probe.2.Slide the probe into the drilled hole until the enclosure is flush against the duct. The airflow direction is not important.3.Secure the enclosure to the duct with two No. 10 x 1 in. (25 mm) self-tapping screws (not provided).4.Tighten the screws until the enclosure is tight against the duct so that there is no movement of the enclosure. A foam gasket on the back of the enclosure provides a tight seal against any air leaks. See Step 1 in Figure 3.5.The enclosure includes a hinged cover with a latch.To open the cover, pull slightly on the latch on the right side of the enclosure. At the same time, pull on the cover as shown in Step 2 of Figure 3.6.A 0.5 in. NPT threaded connection hole is in the bottom of the enclosure. Screw the EMT or cable gland connector into the threaded connection holeuntil tight. See Step 3 in Figure 3.Note: Preferably use weatherproof EMT or cable gland fittings. The E-style enclosure includes 0.5 in. NPT to M16 thread adaptor and cable gland fitting.7.Make wire connections as shown in the wire diagram in Wiring .8.Swing the door closed until it securely latches. For added security, install the two provided screws in the integrated screw tabs. See Step 4 of Figure 3.Wiring•Deactivate the 24 VAC/DC power supply before you make all connections to the device to prevent electrical shock or equipment damage.•Use 14 AWG to 22 AWG shielded wiring for allconnections and do not locate the device wires in the same conduit with wiring that supplies inductive loads such as motors. Make all connections in accordance with national and local codes.•Pull at least 6 in. (15 cm) of wire into the enclosure,then complete the wiring connection according to the wire diagram for the applicable power supply and output signal type. See Figure 4.•Place the output switch in the required position to select the required signal output type (mA or VDC), as shown in Step 2 of Figure 4. The factory default setting is 4 mA to 20 mA.•If you select mA, no further output set up is required.If you select VOLT output as shown in Figure 5, place the voltage output switch to the required span position,that is 10 VDC = 0 VDC to 10 VDC. The factory default setting is 0 VDC to 10 VDC. See Step 1 of Figure 4.•Connect the DC positive or the AC voltage hot side to the PWR terminal. For voltage output or AC power,connect the supply common to the COM terminal.The device is reverse voltage-protected and does not operate if you connect it backwards. The device contains a half-wave power supply so the supplycommon is the same as the signal common. See Step 3of Figure 4.•The analog output is available on the OUT terminal.Check the controller Analog Input to determine the correct connection before you apply power as shown in Step 3 of Figure 4.Figure 3: Mounting the HT-69 Duct Probe RH TransmitterFigure 4: Wiring of the HT-60 Duct Probe TransmitterTechnical specificationsTable 1: HT-69020NP-0, HT-69030NP-0 Duct Probe RH Transmitter technical specificationsThe performance specifications are nominal and conform to acceptable industry standards. For application at conditions beyond these specifications, consult the local Johnson Controls office. Johnson Controls shall not be liable for damages resulting from misapplication or misuse of its products.Product warrantyThis product is covered by a limited warranty, details of which can be found at / buildingswarranty.Software termsUse of the software that is in (or constitutes) this product, or access to the cloud, or hosted services applicable to this product, if any, is subject to applicable end-user license, open-source software information, and other terms set forth at /techterms. Your use of this product constitutes an agreement to such terms. PatentsPatents: https://Single point of contactContact informationContact your local branch office: /locationsContact Johnson Controls: /contact-us© 2022 Johnson Controls. All rights reserved. All specifications and other information shown were current as of document revision and。
- 1、下载文档前请自行甄别文档内容的完整性,平台不提供额外的编辑、内容补充、找答案等附加服务。
- 2、"仅部分预览"的文档,不可在线预览部分如存在完整性等问题,可反馈申请退款(可完整预览的文档不适用该条件!)。
- 3、如文档侵犯您的权益,请联系客服反馈,我们会尽快为您处理(人工客服工作时间:9:00-18:30)。
a r X iv:as tr o -p h /0307556v 1 31 J u l 2003Astronomy &Astrophysics manuscript no.LSB˙accept February 2,2008(DOI:will be inserted by hand later)Starburst in HS 0822+3542induced by the very blue LSB dwarfSAO 0822+3545S.A.Pustilnik 1,4,A.Y.Kniazev 1,2,4,A.G.Pramskij 1,4,A.V.Ugryumov 1,4,and J.Masegosa 31Special Astrophysical Observatory RAS,Nizhnij Arkhyz,Karachai-Circassia,369167Russia 2Max Planck Institut f¨u r Astronomie,K¨o nigstuhl 17,D-69117,Heidelberg,Germany3Instituto de Astrofisica de Andaluc ´ia,Granada,Spain4Isaac Newton Institute of Chile,SAO BranchReceivedFebruary 26,2002;acceptedJuly 30,2003Abstract.One of the most metal-deficient blue compact galaxies (BCGs)HS 0822+3542(Z =1/34Z ⊙),is also one of the nearest such objects (D ∼11Mpc).It is in addition well isolated from known bright galaxies.A trigger mechanism for its current star-formation (SF)burst has thus remained unclear.We report the discovery of a veryblue ((B −V )0tot =0.08and (V −R )0tot =0.14)low surface brightness (LSB)(µ0B 23.m 4arcsec−2)dwarf irregular (dIrr)galaxy,which we have named SAO 0822+3545.Its small relative velocity and projected distance of only ∼11kpc from the BCG imply their physical association.For this LSB dIrr galaxy,we present spectroscopic results,total B,V,R magnitudes,and the effective radii and surface brightness (SB),and we describe its morphological properties.We compare the very blue colours of this dwarf with PEGASE.2models of the colour evolution of a Z =1/20Z ⊙stellar population,and combine this analysis with the data on the LSBD EW (H α)values.The models best describing all available observational data depend on the relative fraction of massive stars in the IMF used.For a Salpeter IMF with M up =120M ⊙,the best model includes a “young”single stellar population (SSP)with an age of ∼10Myr and an “old”SSP with the age of ∼0.2–10Gyr.The mass ratio of the old to young components should be in the range of 10to 30.If the age of the old component is more than ∼1Gyr,an additional coeval component of “intermediate”age (∼100Myr)with a mass comparable to that of the “young”population,although not required,provided a good fit to the current data.For the two options of a model IMF biased toward the low-mass end,the best match of the observed BV R and EW(H α)is for continuous star-formation rate (SFR)single-component models,with SF durations in the range of ∼0.1to ∼1Gyr.However,only a longer time-scale SF gives the stellar mass,compatible with the LSB galaxy mass estimates.Nevertheless,such a scenario would be inconsistent with the recent encounter of these two dwarfs.The role of interaction between the LSBD and BCG HS 0822+3542in triggering their major SF episodes during the last ∼100–200Myr is emphasized and discussed.For the BCG,based on the results of new spectroscopy with the Russian 6m telescope,we estimate the physical parameters of its SF region and present the first evidence of an ionized gas supershell.This pair of dwarfs lies deep within the nearby Lynx-Cancer void,with the nearest bright (L >L ∗)galaxies at distances >3Mpc.This is probably one of the main factors responsible for the unevolved state of HS 0822+3542.Key words.galaxies:star formation –galaxies:low surface brightness –galaxies:interaction –galaxies:photometry –galaxies:abundances –galaxies:individual (HS 0822+3542,SAO 0822+3545)–large-scale structure1.IntroductionA few known blue compact galaxies (BCGs)with ex-tremely low metallicities (1/50to 1/20Z ⊙)are considered to be the best candidates for truly young local low-mass galaxies,in which we are witnessing the first star forma-tion episode,with the oldest stars formed less than ∼100–200Myr ago.The best known examples are SBS 0335−052(Izotov et al.1997;Papaderos et al.1998;Pustilnik et al.2001a),and I Zw 18(Searle &Sargent 1972;Izotov1Note that debates on the possible youth of these BCGsstill continue in the literature (see,e.g.,the most recent ¨Ostlin2000;¨Ostlin &Kunth 2001;Kunth &¨Ostlin 2001).2S.A.Pustilnik et al.:Starburst in HS0822+3542induced by SAO0822+3545van Zee et al.1998,Izotov et al.2001).This,presumably, is a key moment of their history.Moreover,it is probably not by chance that in both the cases of Dw1225+0152 and SBS0335−052E the nearest neighbour is very gas-rich,and either is an H i cloud without any hint of past star formation(as in the case of Dw1225+0152,Salzer et al.1991),or is also an extremely metal-deficient,proba-bly truly young,blue compact galaxy(SBS0335−052W, Pustilnik et al.1997;Lipovetsky et al.1999).Low surface brightness galaxies(LSBGs)comprise a large fraction of the generalfield galaxy population and outnumber by a factor of several times the high sur-face brightness(HSB)population(e.g.,McGaugh1996, Dalcanton et al.1997,O’Neil&Bothun2000).Therefore, these LSBGs can be an important factor for interaction-induced star-formation activity in gas-rich galaxies in gen-eral,mostly through distant/weak tidal encounters(see, e.g.,Taylor et al.1995;O’Neil et al.1998;Pustilnik et al. 2001b).In particular,through interaction they can trig-ger thefirst starbursts in the hypothetical population of local protogalactic H i clouds.To check this hypothesis the authors are conducting a systematic study of the lo-cal environment of the most metal-deficient BCGs.We present here new evidence in support of this idea.We re-port the discovery of a LSB dwarf irregular galaxy(named SAO0822+3545)at a projected distance of∼11.4kpc from one of the most metal-deficient BCGs,HS0822+3542 (Kniazev et al.2000).We have used the SAO RAS6m telescope spectrum in the Hαregion,as well as BV R photometry from the Nordic Optical Telescope(NOT)to study its properties and estimate its tidal effect on the BCG HS0822+3542.We also present new high signal-to-noise(S/N)6m telescope spectra for HS0822+3542which allow us to make more accurate measurements of some of the physical parameters of its star-forming(SF)region and discover thefirst kinematic evidence of an ionized gas supershell.In Section2we describe the observations and their reduction.Results of the data analysis are presented in Section3.We discuss these results in Section4,and summarize ourfindings and draw conclusions in Section5.2.Observations and reduction2.1.Nordic Optical Telescope photometryThere are no cataloged galaxies around HS0822+3542in either NED or LEDA databases with V hel<1200km s−1 and projected distances less than 5.8◦.To search for fainter/non-cataloged galaxies in the close vicinity of this BCG we used B,V,R CCD images obtained with the2.5m NOT on May28,1998.These are the same frames which were used to derive B,V,R magnitudes for HS0822+3542. They were acquired with the ALFOSC spectrograph equipped with the LORAL(W11-3AC)CCD,which has a direct imaging mode.Exposure times were900s for the B-band image,and600s for both V and R images.For further details of these observations and data reduction we refer to the paper by Kniazev et al.(2000).2.2.Looking for possible companionsThe photometric data were reduced with MIDAS2 Command Language programs according to the method described in Kniazev(1997).The MIDAS INVENTORY package was used to classify all objects.Isophotal and total BV R magnitudes were computed using the trans-formation coefficients of Kniazev et al.(2000).Since the interaction between HS0822+3542and a possible neighbouring galaxy would probably result in some enhanced star formation in the latter,wefirst of all searched for candidate blue galaxies.The second criterion applied was that the brightness of any candidates should be comparable to that of HS0822+3542,since signifi-cantly fainter neighbours could tidally affect the BCG only from very small distances(see,e.g.,estimates in Pustilnik et al.2001b).Only two blue galaxies were found in the examined field.Thefirst one is HS0822+3542itself.The second is a LSB irregular galaxy(SAO0822+3545)at3.5′to the north-east from HS0822+3542(its coordinates are given in Table5).The Digitized Sky Survey(DSS-II)blue image of thisfield with the2objects of interest and Anon J0825+3534is presented in Fig.1.All other galaxies in the NOTfield were either significantly fainter or redder.2.3.Analysis of photometric dataWe performed the reduction of photometric data for SAO0822+3545using the IRAF3package ELLIPSE.The growth curve(GC)of the galaxy was constructed by sum-ming up the pixel values from the center outwards in the circles of successive radius.The total magnitudes(B tot,V tot,R tot)were estimated by asymptotic extrapolation of the respective radial GCs. Model-independent parameters were derived from each growth curve.The effective radii(r eff)were read on each GC at one half the asymptotic intensity,and effective SBs (SB eff)were determined as the mean brightness within a circle with the effective radius.These values are summa-rized in Table2.2.4.Long-slit spectroscopySpectroscopic data were obtained with the6m tele-scope of the Special Astrophysical Observatory of Russian Academy of Sciences(SAO RAS).The long-slit spec-trograph(LSS)(Afanasiev et al.1995)was used with a Photometrics1024×1024pixel CCD detector with a 24µm pixel size.The wavelength ranges of the spec-tra obtained for different hardware configurations areS.A.Pustilnik et al.:Starburst in HS0822+3542induced by SAO0822+35453Fig.1.The Digitized Sky Survey(DSS-II)blue image of thefield in the vicinity of BCG HS0822+3542.North is up, East is to the left.At the adopted distance of HS0822+3542(11Mpc)the scale is∼54pc=1′′.The two marked galaxies–LSBD SAO0822+3545and Anon J0825+3534have been checked as possible companions of the BCG.On our data the LSBD has V hel∼700km s−1,close to that of HS0822+3542.Its projected distance to the BCG is213′′or 11.4kpc.The galaxy Anon J0825+3534,very close to the position of2MASXi J0825440+353459(NED),is a distant background object with V hel=15590km s−1.Table1.Journal of the6m telescope spectroscopic observationsObject Date Exposure Wavelength Dispersion Seeing Airmass PAtime[s]Range[˚A][˚A/pixel][arcsec][degree](1)(2)(3)(4)(5)(6)(7)(8)4S.A.Pustilnik et al.:Starburst in HS 0822+3542induced by SAO0822+3545Fig.2.Top panel:2D spectrum of SAO 0822+3545with the H αline at λ6579˚A .Positive Y corresponds to the NW direction for the slit position shown in Fig.3.H α-emission is clearly seen on top of the continuum in the region of ±∼5′′from the central position.Furthermore,some very faint H α-emission (with S/N ratio of ∼1)can be traced out to ±∼10′′,in the regions without detectable continuum.Bottom panel:1D spectrum of the central region (±3′′),summed along the slit,EW (H α)=17˚A .grating,giving a sampling of 1.2˚A pixel −1and an effec-tive resolution (with the 2′′slit width)of 3.5˚A .Seeingduring these observations was 1.7′′.For the reduction of 2D spectra we obtained biases,flat fields and illumination correction images.The primary re-duction consisted of standard steps and was done using the IRAF package CCDRED .The IRAF package LONGSLIT was used to perform wavelength calibration,background subtraction,extinction correction and flux calibration.Straightening of the 2D spectra was performed using APALL ,another IRAF package.After that,aperture ex-tractions,continuum determination,flux and equivalent width measurements of spectral lines were performed in MIDAS (for details,see Kniazev et al.2000).The reduced 2D spectrum and extracted averaged 1D spectrum of SAO 0822+3545are shown in Fig.2.Fluxes and equivalent widths of blended lines were measured using Gaussian decomposition fitting.An av-erage sensitivity curve was produced for each night with r.m.s.deviations of 5%in the whole spectral range.The sensitivity curve and line intensity errors have been prop-agated in calculating elemental abundances.To construct the P–V diagram,the methodology described in Zasov et al.(2000)was used,which allowed us to measure points with sufficiently bright H αemission with r.m.s.errors on the level of 2–4km s −1.3.Results3.1.Spectrum of SAO 0822+3545The 2D spectrum of SAO 0822+3545in Fig.2shows H αemission spanning ∼10′′,comparable to the appar-ent extent of the galaxy continuum.Some fainter H αfea-tures can be detected in the peripheral regions,where no continuum is seen in our spectrum.The equivalent width of the H αline,measured on the 1D spectrum av-eraged over the central region with the a spatial extent of 6′′,is EW (H α)=17±2˚A .The integrated flux in thisline is 4.65(±0.55)×10−16erg s −1cm −2.Small variations of EW (H α)along the slit near the center of the galaxy on the level of ∼15−20˚A are within the observa-tional uncertainties.Closer to the edges the EW (H α)can be larger,but there the uncertainty reaches 70–100%,so we do not discuss these regions further.The measured velocity V hel =700±50km s −1is very close to that of HS 0822+3542.3.2.Photometry and morphology of SAO 0822+3545We calculated total magnitudes B tot =17.56±0.05,V tot =17.43±0.03and R tot =17.26±0.05for SAO 0822+3545us-ing the growth curve method as described in Sec.2.3.The respective integrated colours are (B −V )tot =0.13and (V −R )tot =0.17.Relatively large errors originate from the zero-point uncertainties of the transformation equa-tions (Kniazev et al.2000).Accounting for a foreground extinction of E (B −V )=0.047in our Galaxy (Schlegel et al.1998),and applying the extinction curve from Whitford (1958),these colours become somewhat bluer:(B −V )0tot=0.08±0.06,(V −R )0tot =0.14±0.06.The 2D spectrum in Fig.2and the irregular structure of the central part of SAO 0822+3545(see Fig.3)indicate that enhanced star formation took place at least in the inner part of that galaxy.The possibility of better distin-guishing individual regions of higher brightness (possible young superclusters and aged H ii regions)in the central part of the LSBD was the motivation for using the MIDAS package IMRES for deconvolution of the NOT images.This package employs an image restoration scheme devised by Richardson and Lucy and described in Adorf et al.(1992),Hook &Lucy (1992;and references therein).The num-ber of iterations was determined by comparisons between the input image and the output deconvolved images,after convolution with the point-spread function (PSF).The results of deconvolving the B -band image after 15iterations are plotted in the right panel of Fig.3.A number of filaments and relatively bright knots in the inner part of this LSB/dIrr galaxy are well resolved.Practically all of them are seen on the original image (left panel of Fig.3),although deconvolution makes the structure more visible.All these structures are easily visible in a deconvolved V -band image,but are less distinct in R -band.There is a faint tail in the SE direction in the outer part of the LSBD.This tail is visible on both blue DSS-S.A.Pustilnik et al.:Starburst in HS 0822+3542induced by SAO 0822+35455Fig.3.Left panel:Thesame B -band image of SAO 0822+3545,deconvolved after 15iterations using the FFT based Lucy algorithm (Adorf et al.1992).The angular resolution has improved from 1.′′25to ∼0.′′85(FWHM).Several filaments and many knots are easily visible within the brighter part of the galaxy.Knots are marked by letters from “a”to “i”,respectively.II and B -band NOT images.The surface brightness of this tail corresponds to µB =25.m 7arcsec −2,or 2σof the noise level for the B -band image.The tail direction coincides with that of the LSBD major axis.The major axis P A varies from –75◦for the inner part of the galaxy up to –60◦for the outer part.The axial ratio is essentially constant over the body:b/a ∼0.55.Evidence for recent star-formation activity over the in-ternal part of this dIrr galaxy is also seen,e.g.,in the (B −V )0colour map (Fig.4).This map shows a rather uniform distribution (mainly in the range from –0.05to +0.10)over a large part of the main body.Its maximum (+0.2to +0.25)and minimum (–0.15to –0.10)values are measured in the positions close to the edges,where the S/N is small,and these large colour variations are appar-ently spurious.SAO 0822+3545is a genuine LSB galaxy with traces of recent SF near its center.Since the central bright knots are seen with the lowest contrast in R -band,we made a rough estimate of the central SB of an underly-ing “disk”in R .From the data in Table 2,its effective surface brightness corrected for extinction (A R =0.12)isµR eff,0=23.m 63arcsec−2.For a purely exponential disk this corresponds to a central brightness of µR 0=22.m 50arcsec −2.Since the galaxy is significantly inclined to the line-of-sight,we need to make a corresponding correction to µR 0.For an observed axial ratio p =b/a =0.55,assuming anintrinsic axial ratio of q =0.2,and using the well-known formula cos 2(i )=(p 2−q 2)/(1−q 2),we calculate that i =58.5◦.The inclination correction for surface brightness is then −2.5·log(cos i )=0.m 7,giving a corrected centralbrightness of µR0,c =23.m 20arcsec −2.Even if the underly-ing “disk”is as blue,as the integrated light of this galaxy (that is,(B −R )0∼0.2),its central brightness in B -bandµB 0,c =23.m 40arcsec−2is well within the LSB galaxy regime.For an exponential law,r eff=7.94′′in R corresponds to the scalelength αR =4.73′′.Table 2.Photometric parameters of SAO 0822+3545BandTotal r effSB effmag arcsec mag arcsec −2(1)(2)(3)6S.A.Pustilnik et al.:Starburst in HS 0822+3542induced by SAO0822+3545Fig.4.Grey-scale map of (B −V )-colour for SAO 0822+3545smoothed with 2D median with the win-dow size of 1.′′6×1.′′6.The extinction corrected (E (B −V )=0.047)colour distribution is shown only for regions with S/N ratio larger than 4.The colour scale is shown in the right side column.B -band surface brightness (SB)isolines are superimposed,with the lowest SB level of 25.m 7arcsec −2.The other levels are:24.5,24.0,23.6,23.3,23.1,22.9,22.8and 22.6mag arcsec −2.tor of two (FWHM=0.′′6),and the restored BCG complex morphology is shown in Fig.5in grey scale,with a contour indicating the outer isophote µB =25.m 0arcsec −2super-imposed.With the letters “a”to “f”we have marked all bright features well resolved after deconvolution in each of B,V ,and R bands.The brightest region consists of two components,“a”and “b”,separated by ∼1.3′′(∼70pc),roughly in the N–S direction.The contrast in Fig.5is adjusted to show faint features.The real ratio of the intensities of knots “a”and “b”,derived from this image,is ∼8.While deconvolution does not preserve brightness proportions between individual features,we consider this ratio to be indicative of the real value.In addition to several bright knots,some filamen-tary structures are also visible.Some traces of them are also seen in other filters,but due to their lower surface brightness they are not as easily visible as the knots.Nevertheless,the prominent arc-like structure at the NW edge of the main body (stretching from X =+2,Y =+4to X =+6,Y =+4in Fig.5),is clearly visible on both B and V images,but is more noisy in R -band,presumably due to the lower S/N ratio.This feature probably repre-sents an ionized gas shell with a diameter of ∼4′′(∼200pc),caused by recent active SF in this region,Four more knots are seen in the restored image.One (“d”)is near the geometrical center of the main body.This,perhaps,might naturally be expected because of the gravitational well in the center of the galaxy.The others knots provide further evidence that the current SF episode in the BCG is spread across the galaxy.The P–V diagram in Fig.6indicates a supershell with a size of ∼480pc,comparable to the extent of H α-emission in the long-slit direction.The supershell velocity ampli-tude,as seen from our data,is about 30km s −1.Such supershells are well-resolved on high-resolution H αlong-slit spectra for many nearby starbursting galaxies (e.g.,Marlowe et al.1995;Martin 1996,1997,1998).The re-lated supershells of neutral gas are also seen in H i maps of such galaxies (e.g.,Walter &Brinks 1999).For the typ-ical case of a starburst off-set in position relative to the midplane of the gas disk,the asymmetry of the gas den-sity distribution in the z -direction results in the shell’s asymmetric appearance.This was shown,e.g.,in numer-ical simulations by Silich et al.(1996),and by Walter &Brinks (1999)for the observed types of P–V diagrams.That part of the shell propagating out of the plane should have a significantly lower Emission Measure due to de-creasing gas density,and usually appears much fainter in comparison to the part of the shell moving towards the midplane (e.g.,Martin 1996).Shells (or supershells)are produced by hot bubbles,caused by the injection of the energy from numerous massive star winds and supernova (SN)explosions into the interstellar medium (ISM)(e.g.,Tenorio-Tagle &Bodenheimer 1988).The asymmetric appearance of super-shells in H αemission is easily seen with the high-resolution data mentioned above.When the velocity resolution is not sufficient to distinguish motions on both sides of the shell,we measure the intensity-weighted velocity in the H α-line at each slit position.If the H αintensities in the segments on opposite sides of the shell differ significantly,we will see mainly the side approaching the midplane of the gas disk.However,since the observed velocity at each slit position is the weighted mean of the emission from the opposite sides of the shell,a shell velocity derived in this way rep-resents a lower limit of the real value.Depending on the relative strengths of H αemission on the shell sides the expected correction could reach tens of percent.If we accept the full amplitude of the radial veloc-ity difference between the two edges on the P–V di-agram (∼35km s −1)as the result of rotation in the BCG,then the apparent V rot is 17.5km s −1.With an apparent axial ratio p =b/a =0.5,and an assumed in-trinsic ratio q =0.2,using the same relation as for SAO 0822+3545in section 3.2we get an inclination an-gle i =63.6◦,and thus an inclination-corrected value of V rot =19.5km s −1.The latter value is quite consistent with that expected from the Tully-Fisher relation be-tween galaxy V rot and its blue luminosity,namely,using the relations derived by Karachentsev et al.(1999)for dwarf galaxies in the Local Volume.For HS 0822+3542,M B =–12.5(or L B =1.56×10⁷L ⊙)and so the expected V rot =17km s −1,with a ±1σconfidence range of 12to 24km s −1.S.A.Pustilnik et al.:Starburst in HS 0822+3542induced by SAO 0822+35457Fig.6.Upper panel:P–V dia-gram of ionized gas in HS 0822+3542based on the H αline from the same spectrum.Its form within a radius of ±4′′,and the characteristic diameter and velocity ampli-tude (∼480pc and ∼30km s −1),are consistent with the appearance of supershells observed in many star-bursting galaxies.Filled boxes show the velocities on both sides of the shell as derived from the Gaussian decomposition of the H αline at several positions along the slit.For details see section 3.3.In Fig.6we use filled squares to show the velocities on both sides of the shell,obtained by Gaussian decom-position of the H αprofiles.The two-component struc-ture is detectable only for sufficiently large S/N ratios and maximal velocity separation.The flux from the re-ceding components is several times lower than that from the approaching ones.These data confirm the existence of a large shell with a characteristic velocity amplitude of ∼30km s −1and exclude the interpretation of this feature in the P–V diagram as part of a rotation curve.Indeed,the rotation velocity should monotonously increase from one edge to another.The real P–V diagram certainly does not look like this.Thus,if the ionized gas in the BCG is rotating,its rotation velocity is sufficiently small to be practically hidden by the visible large shell.3.4.Chemical abundances in HS 0822+3542The spectrum of the brightest knot of HS 0822+3542,ex-tracted with an aperture of 3.′′6×1.′′2,is shown in Fig.7.It is dominated by very strong emission lines.The rel-ative intensities of all emission lines,together with the equivalent width EW (H β),extinction coefficient C (H β)and the EW of Balmer absorption lines are given in Table 3.C (H β)was derived from the Balmer decrementusing the self-consistent method of Izotov et al.(1994).The derived value of C (H β)=0.0±0.09is consistent,to within the uncertainties,with a reddening of E (B −V )=0.047±0.007,expected from foreground extinction in the Galaxy (Schlegel et al.1998).We analyzed chemical abundances and physical pa-rameters with the method described by Kniazev et al.(2000).The measured electron temperatures and den-sity,and derived chemical abundances are presented in Table 4.Our new data give a slightly higher value of 12+log(O/H)(7.44±0.06versus 7.35±0.04from the NOT spectrum),but the difference is not significant.The main source of this difference is the intensity of the [O iii ]λ4363line,relative to H β.Its measured value is 0.104on the 6m telescope spectrum,in comparison to 0.123on the NOT spectrum.Part of the derived differences in O/H could be due to the differences in observational conditions,resulting in the sampling of slightly different regions.However,both results are in fact consistent to within their uncertainties.The ratios of other heavy element abundances (Ne ,S ,N )to that of oxygen,derived from the NOT and the 6m tele-scope data,are also similarly consistent.With the higher resolution (1.2˚A pixel −1)spectrum near H αwe improved the precision of the N abundance,since the [N ii ]λ6584emission line was detected with a higher S/N ratio than in the NOT spectrum.The intensities of Ar lines are mea-sured for the first time in this BCG,and we present here its abundance.At the position of the [Fe iii ]line λ4658˚A we detected a signal at a level of 4σ.However,if log(Fe/O)is typical of other very metal-poor BCGs (∼−1.65),the signal in this line should be only ∼1.3σ.One possible ex-planation of the strength of this line is the contribution of the WR spectral feature C iv λ4658.In many BCGs with detected WR features the intensity of the C iv λ4658line is comparable to that of He ii λ4686(e.g.,Guseva et al.2000).Thus,a likely interpretation of the observed fea-ture is that it is the sum of the lines of [Fe iii ]and C iv .This suggests that higher S/N spectroscopy could detect the other WR features in this young starburst region.The He ii λ4686line in our spectrum is broadened to ∼15˚A ,but the S/N ratio is too low to accept this as direct evi-dence of a WR population.4.Discussion4.1.General parameters of the systemIn Table 5we present the main parameters relevant for further discussion of the properties and status of these dwarf galaxies.Their small mutual projected dis-tance (3.′5,or ∼11kpc)and relative velocity (∆V <25km s −1,Chengalur et al.2003)imply that both galaxies are physically associated.Some of the param-eters for HS 0822+3542in Table 5have been revised from those in Kniazev et al.(2000).In particular,the distance-dependent parameters have changed due to an improved distance estimate.H i related parameters have also changed due to correction of the 21-cm line flux8S.A.Pustilnik et al.:Starburst in HS 0822+3542induced by SAO0822+3545Fig.5.Left panel:Same as before,but for NOT V -band image.The filamentary structure on NW edge iswell seen on both images.(GMRT,Chengalur et al.2003).The integrated H i flux presented by Kniazev et al.(2000),based on observations with the NRT,appeared to be offby a factor of two due to the effects of confusion with the galaxy SAO 0822+3545.The adopted oxygen abundance is the weighted mean of current and previous (Kniazev et al.2000)values.4.2.On the evolutionary status of SAO 0822+35454.2.1.The very blue colours of SAO 0822+3545The integrated colours of SAO 0822+3545are unusually blue.Only two out of about 250LSB/dIrr galaxies with known integrated colours (B −V ),(V −R ),or (B −R )(from papers by Ronnback &Bergvall 1994,McGaugh &Bothun 1994,de Blok et al.1995,van Zee et al.1997,O’Neil et al.1997,van Zee et al.2001,and Burkholder et al.2001)have such blue colours.Only one of the 65dIrr galaxies studied by Makarova et al.(1998),Makarova &Karachentsev (1998),and Makarova (1999)appeared that blue;Makarova et al.(1998)noted that this particular LSBG (UGCA 292)has several blue stellar complexes,in which van Zee (2000)detected strong line emission,indicating young starbursts.Thus,the unusual colours of SAO 0822+3545could be due to its recent enhanced SF.To estimate the age of its stellar population,we can compare its (B −V )0totand (V −R )0tot colours with model values.Unfortunately,due to the age-metallicity degeneracy,similar colours cancorrespond to very different ages.Therefore some a priori information on galaxy metallicity is necessary to disen-tangle the degeneracy.This can be obtained from the dIrr galaxy metallicity–luminosity relation (Skillman et al.1989;Pilyugin 2001).For SAO 0822+3545it predicts Z ∼1/20Z ⊙.In fact,for LSB galaxies this relation likelygoes significantly below (e.g.,Kunth &¨Ostlin 2000)thatfrom Skillman et al.,so 1/20Z ⊙is probably the upper limit for the metallicity of SAO 0822+3545.parison of observed and model parametersTo get some insight on the evolution status of SAO 0822+3545,we compared its observed colours and EW (H α)with model predictions.For colours we used results derived from PEGASE.2models (Fioc &Rocca-Volmerange 1997,2000).We also used these models to estimate the mass of the stellar population.We calculated spectral energy distributions (SEDs)for instantaneous SF bursts with Z =1/20and 1/50Z ⊙,as well as the time be-havior of B ,V ,R luminosities and the respective colour tracks.In Fig.8,we show BV R colour tracks for instan-taneous SF bursts with Z =1/20and 1/50Z ⊙,using solid and dotted lines,respectively,assuming a Salpeter IMF with M low =0.1M ⊙,M up =120M ⊙.The track for con-tinuous SF with constant SFR (Z =1/20Z ⊙)and the same IMF is shown by dashed line.SAO 0822+3545ex-。