Determination of Ultra Trace Level of Uranium in Ground Water
用酶联免疫法检测猪肉中莱克多巴胺含量

用酶联免疫法检测猪肉中莱克多巴胺含量摘要用酶联免疫法对某区域内的猪肉进行莱克多巴胺含量检测,结果表明:在低添加水平为0.012 5mg/kg、0.025 0mg/kg、0.050 0 mg/kg、0.100 0mg/kg、1.000 0mg/kg时,均能将莱克多巴胺检出,该法具有灵敏度高、简单、快捷的优点。
关键词猪肉;莱克多巴胺;酶联免疫法近年来全社会对“瘦肉精”猪非常关注,政府出台了一系列相关法律法规,加大了对生产、销售以及在猪饲料、饮水中添加“瘦肉精”等违禁药物的打击力度,同时对饲料、尿样、内脏中“瘦肉精”残留量的检测水平和检测频率也有了很大的提高,现有证据表明,莱克多巴胺作为“瘦肉精”替代品已在养猪生产中被使用。
对于莱克多巴胺含量的测定,常用的检测方法有分光光度法、液相色谱法和气相色谱法等。
本试验用酶联免疫方法对某区域内的猪肉进行莱克多巴胺含量检测,以摸索有效、快速的莱克多巴胺检测方法。
1材料与方法1.1材料与试剂样品来源:采自某区域销售的5份猪肉样品。
莱克多巴胺标准品,纯度99.5%,购自中国药品生物制品检定所;超纯水由Milli-Q liocel纯水器制备;莱克多巴胺标准溶液,质量浓度为10ug/mL,用莱克多巴胺标准品自行配制。
1.2仪器96孔的酶标板;BP310S电子分析天平,感量为0.001g,Sartorius公司;RJ-TDL-40B离心机,转速为4 000rmp,锡市瑞江分析仪器有限公司;Wellscan MW.3型酶联检测仪,芬兰Labsystems;MS2型漩涡混合器,IKA公司;100μL 可调微量移液器,美国RAININ。
1.3试验方法1.3.1样品前处理。
加4倍样品抽提缓冲液到适量的样品中,用均质器混匀。
称取1.4g均质样品,4 000rmp在室温(20~25℃)下离心5min,转移0.5mL上清液到管子里,75℃孵育5min,最大速度涡旋1min。
4 000rmp室温离心5min,转移0.2mL上清液到1个新管子里,加5μL样品平衡缓冲液,混合,稀释因子为4。
超高效液相色谱法测定碳酸酯中的微量多元醇

2019年第7期广东化工第46卷总第393期 ·205 ·超高效液相色谱法测定碳酸酯中的微量多元醇曹宗泽,唐希武,邹贤帅,乐柳林(深圳新宙邦科技股份有限公司,广东深圳518118)[摘要]采用超高效液相色谱法开发了测定碳酸酯中各类微量多元醇的方法。
经验证,本方法具有较强的专属性,具有代表性的各类多元醇在1~150 ppm浓度范围内呈现良好的线性关系,样品加标回收率范围为90 %~110 %。
且此方法定量测试精密度良好,各RSD值均小于5.00 %,定性检出限为0.5 ppm,定量限为1.5 ppm。
另外此方法的耐受性良好,当色谱条件如柱温上下浮动5 ℃,流速上下浮动0.1 mL/min,检测结果仍准确。
目前锂电池行业电解液多以碳酸酯类为溶剂,此方法可同时监测碳酸酯中多种多元醇的含量,提高电解液生产的品质和效率。
[关键词]多元醇;碳酸酯;超高效液相色谱(UPLC);锂电池电解液[中图分类号]O65 [文献标识码]A [文章编号]1007-1865(2019)07-0205-03Determination of Trace Polyols in Carbonates by Ultra Performance LiquidChromatographyCao Zongze, Tang Xiwu, Zou Xianshuai, Yue Liulin(Shenzhen Capchem Technology Co., Ltd., Shenzhen 518118, China)Abstract: An ultra performance liquid chromatography method for the determination of various trace polyols in carbonates was established. The results showed that the method was well used to determine content of typical polyols with high specificity and strong linear correlation within 1~150 ppm. The recoveries of standard addition were 90 %~110 %, and the quantitative precision was good, which RSD was less than 5.00 %. Meanwhile, the limit of detection (LOD)and the limit of quantification (LOQ) could be as low as 0.5 ppm and 1.5 ppm respectively. The method was well tolerated thereby ensuring the detection results accurate when the chromatographic conditions changed, such as column temperature fluctuating 5 ℃, velocity of floating fluctuating 0.1 mL/min. At present, carbonates are mostly used in lithium battery electrolyte, the method can simultaneously monitor the content of various polyols in carbonates, which greatly improve the quality and efficiency of electrolyte production process.Keywords: polyols;carbonates;ultra performance liquid chromatography (UPLC);lithium battery electrolyte当前新能源产业蓬勃发展,锂电池行业也得到了越来越多的关注。
试剂纯度级别(Reagentpuritylevel)

试剂纯度级别(Reagent purity level)Reagent purity levelPart oneChinese appellation, English appellation, code name, label color, impurity content, application rangeA level of GR or guaranteed reagent Guarantee Reagent G.R green are rarely applicable to scientific research experiment and precision analysis, can be used as reference materialTwo grade analysis or analytical reagent Analytical, Reagent, A.R red is rare, purity is second only to grade one, used in general scientific research and demanding quantitative and qualitative analysis experimentsThree grade chemical pure or chemical pure reagent Chemical, Pure, C.P blue less, purity is inferior to two grade products, suitable for higher requirements of chemical experiments and demanding high analysis experimentsFour experimental reagents Laboratory, Reagent, L.R yellow more, purity inferior to grade three products, used for less demanding general chemical experimentThe industrial developing and not fixed, common quality fraction for middle school chemistry experiment is low, low priceSecond partUltrapure reagent:UP-S grade (that is, class MOS): metal impurities of less than 1ppb, suitable0.35 to 0.8 micron integrated circuit processing technology.Grade Pure (ICP-Mass) for plasma mass spectrometry:The content of most impurity elements is below 0.1ppb, which is suitable for Mass (ICP)Routine analysis work.(ICP, Pure, Grade) for plasma emission spectrometry:The majority of impurity elements are below 1ppb, suitable for plasma emission spectrometers (ICP)Routine analysis work.Atomic absorption spectrometry pure grade reagent (AA, Pure, Grade):The vast majority of impurity elements are below 10 ppb, suitable for atomic absorption spectrometry (AA)Routine analysis work.AR (Analytical, reagent analysis, pure);BC (Biochemical biochemical reagent);BP (British, Pharmacopoeia, British Pharmacopoeia);BR (Biological, reagent, biological reagent);BS (Biological, Stain biological stain);CP (Chemical, pure, chemically pure);EP (Extra, Pure, super pure);FCM (For, Complexometry complexometric titration);FCP (For, chromatography, purpose chromatography);FMP (For, microscopic, purpose microscope);FS (For, synthesis synthesis);GC (Gas, chromatography gas chromatography);GR (Guaranteed reagent gr);HPLC (High, Preussuer, Liquid, chromatography high pressure liquid chromatography);Ind (Indicator indicator);LR (Laboratory, reagent, experimental reagent);OSA (Organic, analyfical, standard organic analysis standard);PA (for Pro analysis analysis);Pract (Practical use internship);PT (Primary eragent reference reagent);Pur (Pure, purum, pure);Puriss (Purissmum ultra pure);SP (Spectrum, pure, spectral purity);Tech (Techincal, grade, industrial);TLC (Thin, Layer, chromatography thin layer chromatography);UV (Ultra, violet, pure, spectro pure, optically pure, violet spectrophotometry, pure)Ultra high purity is more than 99.99%GR = 99.8%Pure analysis of more than 99.7%Industrial pureThis product is applicable to strict laboratory work, such aswashing, dissolving or used as raw materials in the production of.Synthetic pureThese products are suitable for organic synthesis and prefabrication applications.Extra pureThese products are suitable for general laboratory work and, in most cases, conform to most Pharmacopoeia (BP, USP, etc.) standards.Pharmacopoeia classThe purity of these chemicals conforms to the Pharmacopoeia standards, such as (NF, BP, USP, Ph, Eur, DAB, DAC, JP, Ph, Franc.)Analytically pureThis type of product is suitable for most analysis, research and quality control.Gr (GR)These products are suitable for laboratory use,Each batch of products is subjected to strict quality control to ensure consistent analysis results. This level is equivalentto most of the manufacturer's analytical grade (A.R.), reagent grade (R.G.).ACS reagentACS reagent meets the American Chemical Association's analytical reagent and is widely used in research and development, quality control.HPLC reagentThis product is suitable for high performance liquid chromatography, has a different quality in this type of product, the quality of different reagents used by whether these agents will be used for preparative chromatography or for parallel analysis or gradient analysis. Such products includehigh-purity solvents that meet stringent UV light absorption values, specifications, and ion pair reagent specifications.ion pairing agentIon pair chromatography for the analyte in reverse chromatography to separate (including ionic compounds), it is used to increase to Movil and analyte ion neutral compounds formed by the combination, so that the analyte is easily reversed HPLC chromatography. We provide special HPLC grade cationic and anionic reagents to ensure the smooth progress of the separation process.Pesticide residue levelThe specially detected solvent can avoid more than 1/1000 of organic impurities. Such solvents are specially purified by glass in a number of steps. Keep the internal conditions stable in the bottle and avoid any possible contamination.Dry and anhydrous gradeThis solvent has very low water content and is suitable for analysis or organic synthesis. The drying solvent traditionally follows Karl FischeFor the analysis of the content of water I method for the determination of anhydrous solvent has gradually become a new part of the organic and inorganic chemical technology research indispensable, in our catalog, you can find a super dry solvent or molecular sieve with super dry solvent.Peptides and DNA synthetic gradeThe most distinctive features of these products are low UV absorption and low moisture content.Pure spectrumThese solvents have very high UV permeability and are suitable for rigorous IR spectroscopic tests.Food / FCC gradeProducts comply with the food chemical Codex (FCC) specification and maximum impurity content limits.Molecular biology levelThese products guarantee no enzyme, thus avoiding the interference of the analysis process, and the products are sufficiently transparent to be used in molecular biology.Biotechnology / biochemical gradeHighly purified reagents are suitable for biochemical research and analysis, and the critical parameters involved are no inhibitors, such as trace amounts of heavy metals, enzymes, coenzyme and enzyme ligands.Microbial gradeWe offer hundreds of microbial products, some dehydrated medium, adjuvant, and other demonstration systems.Phosphor gradeOur fluorescent HPLC grade is gradient and fluorescent controlled, particularly suitable for fluorescent HPLC analysis of PAH.microscopyProvide various types of chemical reagents for microscopy.PCParticularly stable tetrahydrofuran is suitable for FPC (gel permeation chromatography). Because it does not damage peroxoides, these tetrahydrofuran are used for column storage.Cell culture levelThe cell culture level includes cell media, laboratory specimens, biological extracts, selective and sterile reagents for a variety of uses.Protein levelProteomics is the use of qualitative and quantitative methods to compare proteins in different conditions or in different biological processes. We provide reagents in this regard.histological gradeWe provide solvents and reagents suitable for tissue research purity.Ultrapure gradeUltra pure grade is used in inorganic trace analysis, impurities must be controlled at ppt or ppb levels, and each reagent will be delivered together with a complete test certificate.Electronic / VLSI/ ULSI/ SLSI VLSI levelThese products are used in the semiconductor industry, and thevalues of cations, anions and particles are guaranteed to reach ppm to ppb levels. Our chemicals are suitable for cleaning and etching of all products in the semiconductor manufacturing process.ASTM productsIt is useful to analyze the oil derivatives when reagents and instruments conform to the guidelines of the astm.Low mercury content acidThese products are used for mercury analysis in environmental protection analysis to ensure that no mercury in the acid is added to the sample to cause disturbance.AA and ICP standard solutions, 1000ppmThey are made of high purity salts and acids and bases. The concentration was determined by titration and gravimetric analysis. They are used for atomic absorption spectrometry, polarography, or colorimetric techniques, and their accuracy is referenced by the United States Standards and Standards Institute of technology.Volumetric standard solutionFor measuring capacity, the accuracy is referenced by the United States Standards and Institute of technology standards.pH buffersWe provide a large number of pH buffer solutions to calibrate the pH meter. The accuracy is referenced by the United States Standards and Technology Institute standards. Color pH 4, 7, 10 solution is easy to distinguish.Murphy reagentKarl phenanthrene titration is used to determine moisture content in many different samples, including industrial and laboratory quality control. Our chi reagent does not contain toxic pyridine. It has a good cushioning capacity, allowing faster and more steady to the titration end.。
石墨炉原子吸收光谱法测定粮食中的镉
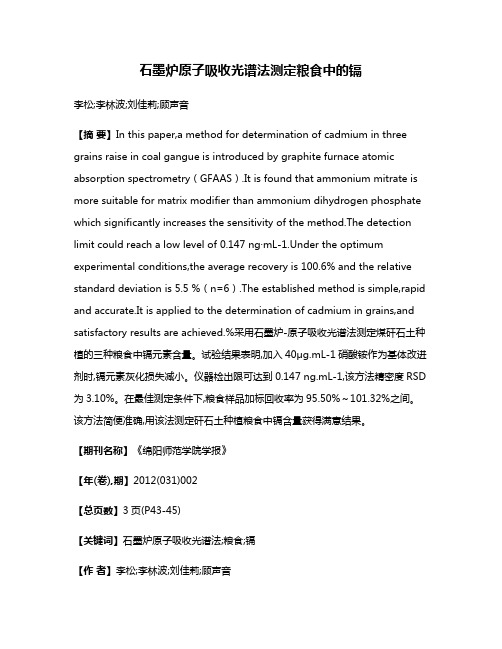
石墨炉原子吸收光谱法测定粮食中的镉李松;李林波;刘佳莉;顾声音【摘要】In this paper,a method for determination of cadmium in three grains raise in coal gangue is introduced by graphite furnace atomic absorption spectrometry(GFAAS).It is found that ammonium mitrate is more suitable for matrix modifier than ammonium dihydrogen phosphate which significantly increases the sensitivity of the method.The detection limit could reach a low level of 0.147 ng·mL-1.Under the optimum experimental conditions,the average recovery is 100.6% and the relative standard deviation is 5.5 %(n=6).The established method is simple,rapid and accurate.It is applied to the determination of cadmium in grains,and satisfactory results are achieved.%采用石墨炉-原子吸收光谱法测定煤矸石土种植的三种粮食中镉元素含量。
试验结果表明,加入40μg.mL-1硝酸铵作为基体改进剂时,镉元素灰化损失减小。
仪器检出限可达到0.147 ng.mL-1,该方法精密度RSD 为3.10%。
在最佳测定条件下,粮食样品加标回收率为95.50%~101.32%之间。
高考英语最新热点时文阅读:中国科学家开发口罩“黑科技” 可检测空气中病毒
Chinese scientists design face mask that detects viruses in 10 minutes中国科学家开发口罩“黑科技”可检测空气中病毒A group of Chinese scientists have developed a face mask that can detect viral exposure. Respiratory pathogens that cause COVID-19 and influenza spread through small droplets and aerosols released by infected people when they talk, cough, or sneeze. The wearable bioelectronic mask designed by researchers from Tongji University can detect common respiratory viruses, including influenza and the coronavirus, in the air in droplets or aerosols, and then alert the wearers via their mobile devices. The highly sensitive face mask is capable of measuring trace-level liquid samples of 0.3 microliters and gaseous samples at an ultra-low concentration of 0.1 femtograms per milliliter, according to the study published this week in the journal,Matter.中国的科学家团队研发出一款口罩,可以检测空气中的呼吸道病毒。
泡沫塑料富集-电感耦合等离子体质谱法测定土壤中超痕量金铂钯
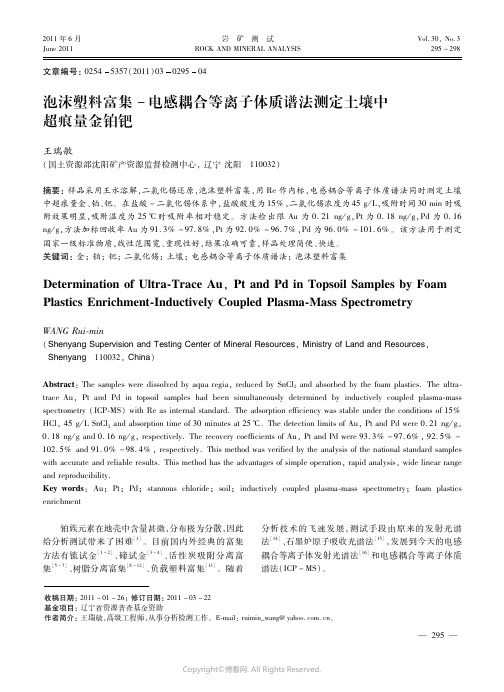
2011年6月June2011岩 矿 测 试ROCKANDMINERALANALYSISVol.30,No.3295~298收稿日期:2011-01-26;修订日期:2011-03-22基金项目:辽宁省资源普查基金资助作者简介:王瑞敏,高级工程师,从事分析检测工作。
E mail:ruimin_wang@yahoo.com.cn。
文章编号:02545357(2011)03029504泡沫塑料富集-电感耦合等离子体质谱法测定土壤中超痕量金铂钯王瑞敏(国土资源部沈阳矿产资源监督检测中心,辽宁沈阳 110032)摘要:样品采用王水溶解,二氯化锡还原,泡沫塑料富集,用Re作内标,电感耦合等离子体质谱法同时测定土壤中超痕量金、铂、钯。
在盐酸-二氯化锡体系中,盐酸酸度为15%,二氯化锡浓度为45g/L,吸附时间30min时吸附效果明显,吸附温度为25℃时吸附率相对稳定。
方法检出限Au为0.21ng/g,Pt为0.18ng/g,Pd为0.16ng/g,方法加标回收率Au为91.3%~97.8%,Pt为92.0%~96.7%,Pd为96.0%~101.6%。
该方法用于测定国家一级标准物质,线性范围宽、重现性好,结果准确可靠,样品处理简便、快速。
关键词:金;铂;钯;二氯化锡;土壤;电感耦合等离子体质谱法;泡沫塑料富集DeterminationofUltra TraceAu,PtandPdinTopsoilSamplesbyFoamPlasticsEnrichment InductivelyCoupledPlasma MassSpectrometryWANGRui min(ShenyangSupervisionandTestingCenterofMineralResources,MinistryofLandandResources,Shenyang 110032,China)Abstract:Thesamplesweredissolvedbyaquaregia,reducedbySnCl2andabsorbedbythefoamplastics.Theultra traceAu,PtandPdintopsoilsampleshadbeensimultaneouslydeterminedbyinductivelycoupledplasma massspectrometry(ICP MS)withReasinternalstandard.Theadsorptionefficiencywasstableundertheconditionsof15%HCl,45g/LSnCl2andabsorptiontimeof30minutesat25℃.ThedetectionlimitsofAu,PtandPdwere0.21ng/g,0.18ng/gand0.16ng/g,respectively.TherecoverycoefficientsofAu,PtandPdwere93.3%-97.6%,92.5%-102.5%and91.0%-98.4%,respectively.Thismethodwasverifiedbytheanalysisofthenationalstandardsampleswithaccurateandreliableresults.Thismethodhastheadvantagesofsimpleoperation,rapidanalysis,widelinearrangeandreproducibility.Keywords:Au;Pt;Pd;stannouschloride;soil;inductivelycoupledplasma massspectrometry;foamplasticsenrichment铂族元素在地壳中含量甚微,分布极为分散,因此给分析测试带来了困难[1]。
校级优秀共产党员陆柏益同学先进事迹-浙江大学生物系统工程与食品
浙江大学优秀学生共产党员推荐表填报学院:生物系统工程与食品科学学院级、班级、专业等。
附:研究生期间主要成果1.Baiyi Lu, Xiaoqin Wu, Xiaowei Tie, Yu Zhang and Ying Zhang, Toxicology and safety of anti-oxidants in bamboo leaves. Part 1: Acute and subchronic toxicity studies on anti-oxidant of bamboo leave. Food and Chemical Toxicology, 2005, 43 (5): 783-792 IF=2.082.Baiyi Lu,Xiaoqin Wu,Jiayi Shi, Yuejie Dong, Ying Zhang, Toxicology and safety of antioxidant of bamboo leaves. Part 2: Developmental toxicity test in rats with anti-oxidant of bamboo leaves. Food and Chemical Toxicology, 2006, 44 (6): 1739-1743 IF=2.083.Baiyi Lu, Ying Zhang, Separation and determination of diversiform phytosterols in food materials using SCE and UPLC-APCI-MS. Analytica Chimica Acta, 2007, 588: 50–633. IF=2. 894.Baiyi Lu, Xiaoqin Wu, Ying Zhang, Studies on phytosterols in bamboo shoot using UPLC-APCI-MS (ACS, Accepted)5.Yu Zhang, Bili Bao, Boyi Lu, Yiping Ren, Xiaowei Tie, Ying Zhang, Determination of flavone C-glucosides in antioxidant of bamboo leaves fortified foods by reversed-phase high-performance liquid chromatography. Journal of Chromatography A,2006, 1065: 177–185 IF=3. 156.Liming Cong, Baifen Huang, Qi Chen, Baiyi Lu, Jing Zhang, Yiping Ren, Determination of trace amount of microcystins in water samples using liquid chromatogramphy coupled with triple quadrupole mass spectrometer. Analytica Chimica Acta,2006, 569 (1-2): 157-168 IF=2. 897.Yiping Ren, Baiyi Lu, Wenqun Liao, zengxuan Cai, Tiexiao Wei, Simultaneous quantification of 4 water-soluble vitamins in fortified infant foods by ultra-performance liquid chromatography coupled with triple quadrupole mass spectrometer(Analytica Chimica Acta, in submission). IF=2. 898.陆柏益,张英,吴晓琴.黄酮类化合物的潜在毒性作用. 中国中药杂志, 2006, 131(7):533-5379.陆柏益,张英,吴晓琴.竹叶黄酮的抗氧化性及其心脑血管药理活性研究进展. 林产化学与工业, 2005, 25 (3) : 120-12410.陆柏益,龚金炎,刘志河,潘惠慧,张英.毛竹笋油的超临界CO2萃取及气质分析. 中国中药杂志,已录用11.张英, 沈建福, 俞卓裕,陆柏益,楼鼎鼎. 竹叶黄酮作为抗衰老护肤因子的应用基础研究. 林产化学与工业, 2(2004)96-10012.张英,陆柏益,吴晓琴, 等.从竹笋中提取的植物甾醇类提取物及其制备方法和用途.中国发明专利,CN 200410099219.813.张英,陆柏益,吴晓琴,等.竹笋氨基酸肽类提取物及其制备方法和用途, 中国发明专利,CN 200510025443.714.张英,陆柏益,吴晓琴,等. 竹笋氨基酸肽类提取物及其制备方法和用途. 国际PCT专利15.张英,陆柏益,吴晓琴, 等. 高品质不溶性植物膳食纤维微粉及其制法和用途. 中国发明专利, CN200610024729.816.张英,陆柏益,吴晓琴, 等. 梅树提取物的用途. 中国发明专利, CN200610118018.717.张英,陆柏益,吴晓琴, 等.梅树非果部分提取物的用途,中国发明专利, CN200610118773.518.张英,陆柏益,吴晓琴,等.梅树非果部分提取物及其制备方法和用途. 中国发明专利, CN200610118774.x19.张英,吴晓琴,陆柏益, 等. 竹叶总黄酮作为抗衰老护肤因子在化妆品中的应用. 中国发明专利,CN03115653.320.张英,吴晓琴,张泳华,蔡华芳,陆柏益.竹叶总黄酮在前列腺疾病防治药物及其保健食品中的应用.中国发明专利,CN 03128889.821.张英,吴晓琴,俞卓裕,楼鼎鼎,陆柏益,等.竹叶抗氧化物及其用途.中国发明专利,CN 200310107871.5。
【放射化学系列】铀、镎、钚的放射化学
~.
. . . . . . . . . . . . . . . . . . . . . . . . . . . . . . . . .... . . . . . . . . . . . . . . . . . . ...~i~ .
~."
1.
11.
Iii.
.... ... .. .. ... ... .... . ... .. . ... .. .. ..". . .. .. . . .. . . . . . . ..iv
Ratiochemical Determination of Plutonium in Marine Samples by Extraction.Chrmatography:.............”.44 The Determination of Plutonim in EnVir~ntal Samples by Extraction with Tridodecylamine ................46 .
8.
Determination Ikanlum in NaturalMaters of
Afte=Aaion-Exchange Sepa.ration. ..........................26 Uranium kalyais by Liquid Scfnttl18tlon Counting .........28
VI.
~
Introduction.................................. ....” . .‘h ...........28 “’. \
Discussionoft heProcedures. ..................................38 Procedures:
GBT 3634.2-2011 氢气 第2部分:纯氢、高纯氢和超纯氢 中英 bilingual
氢气Hydrogen第2部分:纯氢、高纯氢和超纯氢Part 2: Pure hydrogen, high pure hydrogen and ultrapure hydrogen1.范围Scope本部分规定了纯氢、高纯氢和超纯氢的技术要求、试验方法、包装标志、贮运及安全要求。
This section provides the technical requirements, test methods, packing marks and store safety requirements of pure hydrogen, high purity hydrogen and ultra-pure hydrogen.本部分适用于经吸附法、扩散法等制取的瓶装、集装格装和管道输送的氢气。
它主要用于电子工业、石油化工、金属冶炼和科学研究等领域。
This section applies to the bottled, container loaded and pipeline transferred hydrogen making with adsorption and diffusion method. It is mainly used in electronic industry, petrochemical industry, metal smelting and scientific research, etc.分子式:Molecular formula: H2.相对分子质量:2.01588(按2007年国际相对原子质量)。
Molecular weight: 2.01588 (as per 2007 international relative atomic mass)2.规范性引用文件The reference file下列文件对于本文件的应用是必不可少的。
凡是注日期的引用文件,仅注日期的版本适用于本文件。
测定四和六价Se
Talanta94 (2012) 167–171Contents lists available at SciVerse ScienceDirectTalantaj o u r n a l h o m e p a g e:w w w.e l s e v i e r.c o m/l o c a t e/t a l a n taPreconcentration and speciation of ultra-trace Se(IV)and Se(VI)in environmental water samples with nano-sized TiO2colloid and determination by HG-AFSJiaqi Fu,Xu Zhang,Shahua Qian∗,Lin ZhangSchool of Resource and Environmental Science,Hubei Biomass-Resource Chemistry and Environmental Biotechnology Key Laboratory,Wuhan University,Wuhan430079,Chinaa r t i c l e i n f oArticle history:Received17November2011Received in revised form26February2012 Accepted4March2012Available online 10 March 2012Keywords:Selenium speciationNano-sized TiO2colloidHG-AFS a b s t r a c tA united method for speciation analysis of Se(IV)and Se(VI)in environmental water samples was developed using nano-sized TiO2colloid as adsorbent and hydride generation atomicfluorescence spec-trometry(HG-AFS)as determination means.When the pH values of bulk solution were between6.0and 7.0,successful adsorption onto1mL nano-sized TiO2colloid(0.2%)was achieved for more than97.0%of Se(IV)while Se(VI)barely got adsorbed.Therefore,the method made it possible to preconcentrate and determine Se(IV)and Se(VI)separately.The precipitated TiO2with concentrated selenium was directly converted to colloid without desorption.Selenium in the resulting colloid was then determined by HG-AFS.The detection limits(3 )and relative standard deviations(R.S.D)of this method were24ng/L and 42ng/L,7.8%(n=6)and7.0%(n=6)for Se(IV)and Se(VI),respectively.This simple,sensitive,and united method was successfully applied to the separation and speciation of ultra-trace Se(IV)and Se(VI)in environmental water samples.© 2012 Elsevier B.V. All rights reserved.1.IntroductionSelenium is a metalloid element that naturally occurs in the environment.It can assume four valence states(−II,0,IV,and VI), each with varying reactivity,toxicity,and bioavailability[1].Selen-ites and selenates are usually water soluble,and the most frequent species in the water samples are inorganic Se(IV)and Se(VI)[2–4]. Acid and reducing conditions reduce inorganic selenite to elemen-tal selenium,whereas alkaline and oxidizing conditions favour the formation of selenate[5,6].Selenium is essential yet toxic,and it exhibits a narrow window between essential and toxic concentra-tions[7].The toxicity of the different species for selenium differs,in which the toxicity of Se(IV)is stronger than that of Se(VI)[8–10]. Therefore,it is more meaningful to analyze selenium speciation than to determine the total concentration of inorganic selenium in water samples.Sensitive methods for selenium analysis include graphite furnace atomic absorption spectrometry(GFAAS)[3,11], inductively coupled plasma atomic emission spectrometry(ICP-AES)[12]and HG-AFS.Among these methods,only HG-AFS can selectively determine Se(IV)from Se(IV)–Se(VI)mixture,and the concentration of Se(VI)can be calculated by the difference between total inorganic Se and Se(IV)[13,14].The background values of selenium in some groundwater and surface water,and ∗Corresponding author.Tel.:+862768778551;fax:+862768778893.E-mail address:qiansh@(S.Qian).selenium in tapwater samples from public water supplies around the world,are usually present at trace levels[1].Concentrations of selenium in natural water systems range from tens to hundreds of ng/L with inorganic Se(IV)and Se(VI)species dominating[8,15,16]. Such trace analyte levels lead to difficulties in quantifying individ-ual species by HG-AFS.Therefore,methods using preconcentration coupled with a highly sensitive detector are usually applied to the speciation of Se(IV)and Se(VI).Adsorption is one of the methods used to preconcentrate and separate selenium species,which has been proven efficient.Several adsorbents have been successfully applied to preconcentrating selenium species,including activated carbon[16–18],alkyl silica[19],resin[20,21],cross-linked chi-tosan[22,23],and nano-sized TiO2powder[24,25].However,a desorption procedure is indispensable when using all the adsor-bents above,which makes the operation complex and redundant.Our research group has been working on the analysis of ultra-trace metal ions by using nano-sized TiO2colloid as adsorbent coupled with HG-AFS and GFAAS[26,27].Nano-sized TiO2colloid has a smaller particle radius and a larger specific surface area than its powder.Also,the colloid is more stable and dispersive in water without agglomeration.The advantage of using nano-sized TiO2 colloid coupled with HG-AFS is that it can dispense with desorption. Although slurry sampling does not require desorption procedure either,stabilizers like agar and surfactant are usually needed and success of the slurry sampling technique depends on many param-eters such as the sample particle size,stabilizer ratio etc.[28,29]. The method proposed here is much simpler than the conventional0039-9140/$–see front matter© 2012 Elsevier B.V. All rights reserved. doi:10.1016/j.talanta.2012.03.012168J.Fu et al./Talanta94 (2012) 167–171methods with slurry sampling.The precipitated TiO2with con-centrated analytes can be directly converted to colloid by adding some HCl aqueous solution.The resulting colloid samples can be determined by HG-AFS directly.In this work,a method for speciation of Se(IV)and Se(VI)in envi-ronmental water samples was developed using nano-sized TiO2 colloid as adsorbent and HG-AFS as determination means.Under optimum conditions,the adsorption efficiency for Se(IV)reached higher than97.0%in a short time,while the adsorbent barely adsorbed Se(VI).Therefore,unlike using HG-AFS alone,Se(IV)and Se(VI)could be determined respectively by this method due to the apparent difference of the adsorption affinity.The developed method was simple,fast,sensitive,with nofiltration or desorption steps,and it possessed low detection limits for Se(IV)and Se(VI). It was applied to selenium speciation analysis in environmental water samples with satisfactory results.2.Experimental2.1.EquipmentsA PF6-2non-dispersive atomicfluorescence spectrometer (Beijing Purkinje General Instruments Co.,Ltd.,Beijing,China), equipped with an HAF-2selenium hollow cathode lamp,was used for selenium determination.The instrumental conditions of HG-AFS were listed in Table1.pH values were measured with the Mettler-Toledo320-S pH meter(Mettler-Toledo,Greifensee, Switzerland).An LD5-2A centrifuge(Beijing Medical Centrifuge Factory,Beijing,China)was applied to separating the suspensions. Particle size was determined by transmission electron microscope (JEM-100CXII,JEOL).The zeta potential of TiO2colloids was deter-mined using a ZetaSizer3600(Malvern Instrument,UK).2.2.Reagents,materials,and solutionsUltrapure water was used to prepare all solutions.2.0%(w/w) nano-sized TiO2colloid was supplied by Infrared Academy of Wuhan University(Wuhan,China),and was diluted10times to 0.2%(w/w)for use.The carrier liquid for AFS was prepared by1.5% (w/w)KBH4and2.0%(v/v)HCl.Ar(99.99%)was used as carrier gas. HNO3and NaOH aqueous solutions were used to adjust the pH. Selenium powder(99.98%)was used to prepare Se(IV)standard stock solution(0.1g/L).Se(VI)standard stock solution(1.0g/L)was prepared by using Na2SeO4·10H2O as metal ions precursor.A series of standard working solutions were prepared by diluting standard stock solution.The environmental reference material(GSBZ50031-94)was purchased from Institution for Environmental Reference Materials of Ministry of Environmental Protection(Beijing,China). Environmental water samples were from Donghu Lake(Wuhan, China)and Yangtze River.All salts used to prepare solutions were AR grade or higher.2.3.Principle of HG-AFSThe carrier liquid for AFS consists of HCl and KBH4,which can react to generate hydrogen.Se(IV)in the solution reacts with hydrogen to form H2Se.H2Se is separated from mother liquor and carried into the atomizer by argon.H2Se is atomized into hydrogen and selenium atom at the temperature of170◦C.With the selenium hollow cathode lamp as excitation source,selenium atom can emit fluorescence and the concentration of selenium can be determined from thefluorescence intensity.Considering that HG-AFS cannot detect Se(VI)directly,Se(VI)has to be reduced to Se(IV)first.2.4.Reduction process of Se(VI)to Se(IV)A certain volume of concentrated HCl was added into solution containing Se(VI),to obtain a HCl concentration of3–4mol/L.The processed solution was kept boiling for30min.2.5.Determination of adsorption efficiency for Se(IV)10mL working solution(0.2mg/L)of Se(IV)and about70mL ultrapure water were well mixed in a centrifuge tube(120mL). The mixture was added with a certain dosage of nano-sized TiO2 colloid and was adjusted to a certain pH value with HNO3and NaOH aqueous solutions.The resulting solution was subjected to centrifugation under4500rpm for20min.After centrifugation,the supernatant was transferred to a volumetricflask(100mL)and 5mL conc.HCl was added.The solution was then diluted to100mL. The Se(IV)concentration of the supernatant was determined by HG-AFS.Thefluorescence obtained was compared with that of Se (IV)working solution(20g/L)without adsorption to calculate the adsorption efficiency of nano-sized TiO2colloid for Se(IV).2.6.Determination of adsorption efficiency for Se(VI)2mL working solution(1mg/L)of Se(VI)was added into a cen-trifuge tube containing about40mL ultrapure water.The same treating steps with Se(IV)were taken,namely the addition of nano-sized TiO2colloid,adjustment of pH,and centrifugation.Since only Se(IV)will generate the hydride,Se(VI)needs to be reduced to Se (IV)in order to obtain an analytical signal for HG-AFS.After cen-trifugation,supernatant was transferred to a beaker(250mL).Se (VI)in the supernatant was converted to Se(IV)by the reduction process.The resulting solution was then diluted to100mL.Theflu-orescence of the above solution was compared with that of Se(IV) working solution(20g/L)to calculate the adsorption efficiency for Se(VI).2.7.Preconcentration and determination of Se(IV),Se(VI)andtotal inorganic Se in water samplesAll the vessels were washed with HCl(1:1)before use.Water samples were collected in an Erlenmeyerflask after air pumping filtration(0.45m nitrocellulose).100mL water sample was col-lected in a centrifuge tube and1mL nano-sized TiO2colloid(0.2%) was added.The pH of the solution was adjusted within a range from6.0to7.0.The solution was then centrifuged for20min with 4500rpm.After centrifugation,50mL of the supernatant was trans-ferred into a beaker(250mL)for the analysis of Se(VI).The residual supernatant was discarded.A small amount of2.0%(v/v)HCl was added to the precipitated TiO2to make it into colloid again.The col-loid was transferred to a colorimetric tube and diluted to5mL by 2.0%(v/v)HCl.Se(IV)in the resulting colloid was then determined by HG-AFS.20mL conc.HCl was added into the above mentioned beaker filled with50mL supernatant.The mixed solution was kept boiling for30min to convert Se(VI)to Se(IV).When the solution got cool, 1mL nano-sized TiO2colloid(2.0%)was added and pH value was adjusted to6.0–7.0.The following treating steps were the same with that of Se(IV).Thefluorescence of the obtained colloid sample was determined by HG-AFS and the concentration of Se(VI)was gained.Another50mL water sample was prepared for the determi-nation of total inorganic Se.The water sample was determined by following the same treating steps of Se(VI).The concentra-tions of Se(IV),Se(VI)and total inorganic Se were all calculated by standard calibration curve method.The standard curve wasJ.Fu et al./Talanta94 (2012) 167–171169 Table1Instrumental conditions of HG-AFS for the determination of Se(IV).Negative high voltage(V)Flow rate of Ar(mL/min)Lamp current(mA)Atomization T(◦C)Atomizer H(mm)Main Auxiliary28050045451708Fig.1.TEM images of nano-sized TiO2colloid:(a)original group;(b)control group.obtained with the samples determined in colloid state,with an R2 of0.999.2.8.Particle size determination of nano-sized TiO2colloidThe original group of nano-sized TiO2colloid was prepared by directly diluting0.5mL nano-sized TiO2colloid(2.0%)to10mL with ultrapure water.As for control group,about80mL ultrapure water and0.5mL nano-sized TiO2colloid(2.0%)was added into a cen-trifuge tube.The pH value of the mixture was adjusted to6.0–7.0. After centrifugation at4500rpm for20min,the precipitated TiO2 was converted to colloid with2.0%HCl.The obtained colloid was diluted with ultrapure water to10mL for testing.The particle size of nano-sized TiO2colloid in each group was determined by means of TEM.3.Results and discussion3.1.Particle size of nano-sized TiO2colloidTwo groups of nano-sized TiO2colloid were prepared for TEM test and their results are shown in Fig.1a and b.Seen from the results of original group(Fig.1a),the particles of nano-sized TiO2 colloid were coralloid and dispersed well.The size of particle was less than5nm and its specific surface area was large which made nano-sized TiO2colloid possess a strong adsorption ability.By com-paring the results of the two groups,similar patterns of the colloid particles and same particle sizes were observed.It showed that HCl could well convert the precipitated nano-sized TiO2to colloid with-out affecting the structure of colloid particles.And the viscosity of the obtained colloid solution was close to that of aqueous solution owing to the little use of adsorbent and its small particle size.There-fore this method was suitable for autosampler to obtain precise results.3.2.Selective adsorption and separation of Se(IV)and Se(VI)When pH is lower than4.0,the particles of nano-sized TiO2 colloid disperse well and cannot be effectively separated from the bulk solution.Therefore,the pH value should be set higher than4.0theoretically in order to separate nano-sized TiO2col-loid from the solution.A series of pH values were adjusted to determine the adsorption efficiencies for Se(IV)and Se(VI).The amount of nano-sized TiO2colloid(0.2%)used for adsorp-tion was1mL.The effect of pH on adsorption for selenium species was shown in Fig.2.The adsorption efficiency for Se (IV)could reach97.0%or higher when pH was between 6.0 and8.0,while the adsorbent barely adsorbed Se(VI)with pH being 6.0–7.0.Thus,Se(IV)and Se(VI)showed appar-ently different adsorption properties on nano-sized TiO2colloid surface when the pH value of solution was between 6.0and 7.0.TiO2surface was positively,null and negatively charged when the pH value is lower than the isoelectric point,at isoelectric point and higher than isoelectric point,respectively[30].Selenite or sele-nate species in a solution may be H2SeO3,HSeO3−,and SeO32−,or H2SeO4,HSeO4−,and SeO42−,depending on the pH values of solu-tion.The p K a values for selenic acid(H2SeO4)are<1and1.7,and those for selenious acid(H2SeO3)are2.75and8.5[31].Therefore, at pH6.0–7.0,the primary species for Se(IV)and Se(VI)are SeO42−and HSeO3−respectively[32].It allows the efficient adsorption of TiO2for Se(IV).The electrostatic attraction between Se(VI)and TiO2is too weak to get Se(VI)well adsorbed by TiO2.In order to verify the electrostatic attraction between TiO2col-loid surface and selenium species,zeta potential of TiO2samples with adsorbed Se(IV)and/or Se(VI)was measured.Results were shown in Fig.3.The results showed no significant changes inthe Fig.2.Effect of pH on the adsorption for selenium species:( )20g/L Se(VI);(᭹) 20g/L Se(IV).The volume of nano-sized TiO2colloid(0.2%)used for adsorption was1mL.170J.Fu et al./Talanta 94 (2012) 167–171Fig.3.Zeta potential of 0.1%TiO 2colloids as a function of pH,20g/L Se (IV)and 20g/L Se (VI).surface potential of TiO 2colloids in the presence of either 20g/L Se (IV)or 20g/L Se (VI).The same zeta potential patterns was also observed in the adsorption of 50mol/L Se (VI)(even up to 500mol/L)onto anatase TiO 2nano-powder [33].The unobvious change of the point of zero charge (pH pzc )indicated that both Se (IV)and Se (VI)formed out-sphere complexes with TiO 2colloids.Therefore,Se (IV)showed stronger adsorption affinity than Se (VI)because of its relative higher electrostatic attraction with TiO 2col-loids.The above results provided the basis for the separation of Se (IV)and Se (VI).Considering that the environmental water samples contained both Se (IV)and Se (VI),effect of Se (VI)on the adsorption for Se (IV)was studied.Se (IV)–Se (VI)mixed solution was prepared with each concentration being 20g/L,followed by determina-tion of adsorption efficiency for Se (IV).The adsorption efficiency reached higher than 97.0%,showing that 20g/L Se (VI)would not interfere the full adsorption for Se (IV).Therefore,when analysing environmental water samples,the trace Se (VI)in it would not affect the adsorption for Se (IV)either.3.3.Relations between ion strength and nano-sized TiO 2colloid amount100mL 20g/L Se (IV)solution was prepared with an adjusted pH value between 6.0and 7.0.Several different volumes of nano-sized TiO 2colloid (0.2%)were adopted.The adsorption efficiency increased from 46%to 97%when raising the volume of nano-sized TiO 2colloid (0.2%)from 0.3mL to 0.5mL.In consideration of con-venience,1mL was adopted to be the volume of nano-sized TiO 2colloid for adsorption efficiency determination.As for Se (VI)determination in environmental water samples,prereduction procedure was required.According to the reduction process introduced above,20mL conc.HCl was added as the reduc-tant.Therefore,a large amount of NaOH aqueous solution was needed to adjust the pH of solution to be 6.0–7.0.The solution was of high ion strength (approx.3.4mol/L)after neutralization,and the adsorption efficiency for Se (IV)was 57.4%.It was not unexpected that adsorption efficiency for Se (IV)on nano-sized TiO 2colloid decreased with the increase of ionic strength since out-sphere complex was formed [32].In order to possess higher adsorption efficiency,dosage of nano-sized TiO 2was optimized.It turned out that 1mL nano-sized TiO 2colloid (2.0%)could fully adsorb Se (IV)in high ion strength samples.Therefore,1mL nano-sized TiO 2colloid (2.0%)was adopted as the adsorbent dosage after reducing Se (VI)in environmental water samples to Se(IV).Fig.4.Dependence of the adsorption amount with the equilibrium concentration of Se (IV).The solid line corresponds to the fits of the data to Eq.(2).Inset:Linear fit of Langmuir adsorption isotherm of Se (IV)on nano-sized TiO 2colloid.3.4.Adsorption isotherm of Se (IV)on TiO 2To study the adsorption isotherms,a series of Se (IV)working solution were prepared with the concentration being 0.1,0.5,0.6,0.8,1.0and 1.5mg/L,respectively.The experiments were carried out under the optimized conditions.As shown in the inset of Fig.4,a good linear fit (the correlation coefficient R is 0.9996)of the exper-imental data to Eq.(1)indicates the adsorption of Se (IV)onto TiO 2colloids follows the Langmuir isotherm model.c e q e =c e q max +1Kq max (1)q e =Kq max c e1+Kc e(2)where q e is the amount of solute adsorbed by gram of TiO 2col-loid (mg/g).c e is the equilibrium concentration (g/L).K (L/g)and q max (mg/g)represent Langmuir equilibrium constant and the adsorption maximum capacity of the solute on the TiO 2surface,respectively.However,when using Eq.(1),a high weight is given to the data with largest errors.For this reason,K and q max values were recovered from the nonlinear fit of the experimental data to Eq.(2).The adsorption constants and adsorption capacity are 4.05(±1.96)×10−2and 27.10±1.65for Se (IV)adsorption onto TiO 2colloids,respectively (Fig.4).The adsorption maximum capac-ities of selenium on the nano-sized TiO 2colloid are comparable with those obtained by CTAB-modified alkyl silica [Se (VI),5.0mg/g][19],Diaion HP-2MG [Se (IV),5.20mg/g][21]and nano-sized TiO 2powder [Se (IV),14.6mg/g][24].The results gained above showed that the interaction between TiO 2and Se (IV)is mainly a physical interaction.3.5.Effect of coexistent ionsThe effect of some ordinary ions in real water was studied.Var-ious amounts of different ions were added into 100mL solution containing 0.05g Se (IV),and resulting solution contained Na +(92mg),K +(3.9mg),Mg 2+(4.8mg),Ca 2+(4mg),Cl −(149.1mg),NO 3−(6.2mg),SO 42−(19.2mg)and F −(4.5g).The enrichment procedure was then followed.The recovery of Se (IV)analysis was 107.3±4.9%(n =3),which showed that the coexistent ions had little effect on the proposed method.3.6.Detection limit and relative standard deviation6parallel 100ng/L Se (IV)solution (100mL)and 6parallel 200ng/L Se (VI)(50mL)were analyzed according to the proceduresJ.Fu et al./Talanta94 (2012) 167–171171 Table2Speciation of Se(IV)and Se(VI)in environmental water samples(sample volume:l00mL;final volume:5mL;n=3).Samples Se added Se found Recovery(%)Se(IV)Se(VI)Se(IV)Se(VI)Se(IV)Se(VI) Donghu water(g/L)––0.13±0.010.24±0.02––0.100.200.23±0.010.44±0.01100.0±2.0100.0±1.3 Yangtze River water(g/L)––0.10±0.010.20±0.01––0.100.200.19±0.000.39±0.0290.0±1.095.0±1.3of analyzing Se(IV)and Se(VI)in water samples.The detection limit (3 )and the relative standard deviation(R.S.D)of this method for Se(IV)were24ng/L and7.8%,respectively.The detection limit(3 ) and the relative standard deviation(R.S.D)of this method for Se(VI) were42ng/L and7.0%,respectively.The detection limit(3 )of this method was much lower than some other methods for selenium speciation[4,10,25,34–36].3.7.Analysis of environmental reference material and real water samplesAn environmental reference material(GSBZ50031-94)with a Se (IV)concentration of26.2±2.4g/L was analyzed.2mL environ-mental reference material was added into about90mL pure water. The resulting solution was treated and determined according to the preconcentration and determination of Se(IV)in environmen-tal water samples.The sample was concentrated to5mL and its theoretical Se(IV)concentration was0.4times as much as that of environmental reference material.Therefore,the obtained concen-tration was multiplied by2.5times in order to make a comparison with the certified value.The result was26.2±2.7g/L(n=4),which was in good agreement with the certified value.The above-mentioned method was used for the analysis of Se (IV)and Se(VI)in water samples from Donghu Lake and Yangtze River.The results were listed in Table2.In order to compare and convince these results with the proposed method,the speciation analysis of those two water samples was also carried out by using conventional method(State Standard of the People’s Republic of China,No.GB/T8538-2008)after preconcentration.The concentra-tion of total inorganic selenium for Donghu Lake and Yangtze River were respectively found to be0.34±0.02g/L and0.30±0.01g/L, which were coincidence with the results obtained by using the proposed method(0.37±0.03g/L and0.30±0.02g/L).All the results showed that it was a satisfactory method for speciation of ultra-trace Se(IV)and Se(VI)in environmental water samples.4.ConclusionThe innovation of this method lies in the application of nano-sized TiO2colloid as sorbent for speciation of ultra-trace Se(IV) and Se(VI).Se(IV)and Se(VI)have different adsorption properties by using nano-sized TiO2colloid as adsorbent under certain pH values,which guarantees their separation.Coupled with HG-AFS, the colloid with adsorbed selenium can be determined directly.By introducing adsorbent,the detection limit is lowered significantly with preconcentration pared with the traditional methods which require desorption process,the method introduced in this paper appears to be more advantaged with short-time sep-aration and preconcentration,simple operation and fast analysis. Consequently,this method can be applied to determining ultra-trace Se(IV)and Se(VI)in environmental water samples with great success.AcknowledgementThis research wasfinancially supported by the National Natural Science Foundation of China(Grant No.20877059).References[1]WHO,Selenium in Drinking-water.Background Document for Development ofWHO Guidelines for Drinking-water Quality,WHO,Geneva,1996.[2]L.Friberg,G.F.Nordberg,V.B.Vouk,Handbook on the Toxicology of Metals,Elsevier/North-Holland Biomedical Press,Amsterdam,The Netherlands,1979.[3]S.Rao,J.Arunachalam,At.Spectrosc.27(2006)165.[4]N.M.Najafi,S.Seidi,R.Alizadeh,H.Tavakoli,Spectrochim.Acta B65(2010)334–339.[5]M.A.Elrashidi,D.C.Adriano,S.M.Workman,W.L.Lindsay,Soil Sci.144(1987)141–152.[6]R.L Mikkelsen,A.L.Page,F.T.Bingham,in:L.W.Jacobs(Ed.),Selenium in Agricul-ture and the Environment,American Society of Agronomy,Madison,WI,1989, pp.65–94.[7]P.E.Painter,Chem.Rev.28(1941)179–213.[8]D.G.Barceloux,D.Barceloux,Clin.Toxicol.37(1999)145–172.[9]P.C.Hernandez,J.F.Tyson,P.C.Uden,D.Yates,J.Anal.At.Spectrom.22(2007)298.[10]M.Gallignani,M.Valero,M.R.Brunetto,J.L.Burguera,M.Burguera,Y.Petit dePe˜na,Talanta52(2000)1015–1024.[11]P.M.de Moraes,antônio,G.S.Cagnani,F.A.dos Santos,C.do CarmoFederici Padilha,P.M.de Lima,P.de Magalhães Padilha,Eur.Food Res.Technol.229(2009)409–414.[12]P.Schramel,L.Q.Xu,Fresenius J.Anal.Chem.340(1991)41–47.[13]Y.Cai,Trends Anal.Chem.19(2000)62–66.[14]R.M.Olivas,O.F.X.Donard,C.Cámara,P.Quevauviller,Anal.Chim.Acta286(1994)357–370.[15]J.Conde,M.S.Alaejos,Chem.Rev.97(1997)1979–2004.[16]F.A.Bertolino,A.A.J.Torriero,E.Salinas,R.Olsina,L.D.Martinez,J.Raba,Anal.Chim.Acta572(2006)32–38.[17]A.Afkhami,T.Madrakian,Talanta58(2002)311–317.[18]Y.-K.Tsoi,K.S.-Y.J.Leung,Chromatogr.A1218(2011)2160–2164.[19]C.Xiong,M.He,B.Hu,Talanta76(2008)772–779.[20]N.Gezer,M.Gülfen,A.O.Aydın,J.Appl.Polym.Sci.122(2011)1134–1141.[21]K.O.Saygi,E.Melek,M.Tuzen,M.Soylak,Talanta71(2007)1375–1381.[22]J.Dai,F.L.Ren,C.Y.Tao,Y.Bai,Int.J.Mol.Sci.12(2011)4009–4020.[23]J.S.Jiang,G.Q.Huang,S.H.Qian,Y.T.Wang,M.L.Wang,Spectrosc.Spectral Anal.19(1999)75–77.[24]S.X.Li,N.S.Deng,Anal.Bioanal.Chem.374(2002)1341–1345.[25]L.Zhang,Y.Morita, A.Sakuragawa, A.Isozaki,Talanta72(2007)723–729.[26]S.H.Qian,Z.Huang,J.Q.Fu,J.Kuang, C.Z.Hu,Anal.Methods2(2010)1140–1143.[27]S.H.Qian,S.J.Zhang,Z.Huang,M.Xiao,F.Huang,Microchim.Acta166(2009)251–254.[28]D.S.Júnior,F.B.Júnior,S.S.de Souza,F.J.Krug,J.Anal.At.Spectrom.18(2003)939–945.[29]L.Wang,B.Hu,S.Q.Li,Z.C.Jiang,J.Anal.At.Spectrom.16(2001)847–851.[30]S.Kataoka,M.C.Gurau,F.Albertorio,M.A.Holden,S.M.Lim,R.D.Yang,P.S.Cremer,Langmuir20(2004)1662–1666.[31]I.Bodek,Environmental Inorganic Chemistry Properties,Processes and Estima-tion Methods,Pergamon Press,New York,1988.[32]D.S.Han, B.Batchelor, A.Abdel-Wahab,J.Hazard.Mater.186(2011)451–457.[33]N.Jordan,H.Foerstendorf,S.Weiß,K.Heim,D.Schild,V.Brendler,Geochim.Cosmochim.Acta75(2011)1519–1530.[34]L.Hu,Z.Q.Dong,X.H.Huang,Y.F.Li,B.Li,L.Y.Qu,G.P.Wang,Y.X.Gao,C.Y.Chen,Chin.J.Anal.Chem.39(2011)466–470.[35]E.Vassileva,A.Becker,J.A.C.Broekaert,Anal.Chim.Acta441(2001)135–146.[36]N.Maleki,A.Safavi,M.Doroodmand,Talanta66(2005)858–862.。
- 1、下载文档前请自行甄别文档内容的完整性,平台不提供额外的编辑、内容补充、找答案等附加服务。
- 2、"仅部分预览"的文档,不可在线预览部分如存在完整性等问题,可反馈申请退款(可完整预览的文档不适用该条件!)。
- 3、如文档侵犯您的权益,请联系客服反馈,我们会尽快为您处理(人工客服工作时间:9:00-18:30)。
Determination of Ultra Trace Level of Uranium in Ground Water of Different Geo-Chemical Environmentby Adsorptive Stripping VoltammetryR.K.Singhal&V.M.Joshi&J.Preetha&Rupali Karpe&Ajay Kumar&A.G.HegdeReceived:7December2006/Accepted:20March2007/Published online:21April2007#Springer Science+Business Media B.V.2007Abstract The mineral mobilisation in ground water due to rock water interaction largely depends on the localized subsurface geo-chemical environment.Dur-ing this work,traces of uranium were measured by adsorptive stripping voltametry(AdSV)in groundwa-ter having various level of dissolved minerals. Experimental solutions were prepared in the laboratory by spiking natural groundwater with standard solutions of major cations(Ca2+,Mg2+,K+),anions(Cl−1,F−1, and PO3À4),trace metal ions(Cu and Pb)and DOC (Dissolved Organic Carbon).The concentrations of these anions,cations and DOC in subsurface water changes due to changes in the geo-chemical environ-ment at different locations.Experimental results show that major anions do not have any pronounced impact on the analysis of uranium.In the case of cations, only Cu2+shows strong interferences.However addition of2%Ethylene Diammine Tetra-acetic Acid (EDTA)solution in the ratio of1:25removes interfer-ence due to copper upto a concentration of<0.2ppm. Interference with copper was also studied by varying the accumulation potential,pH and concentration of chloroanilic acid.Though no interferences were observed in ground water having dissolved organic carbon(DOC)in the range of0.01–15ppm,between 15–16ppm of DOC,the ability to detect uranium by AdSV decreases sharply.Further,if DOC exceeded 16ppm it was not possible to do the analysis of uranium by AdSV without destruction of DOC,as DOC is a surface active organic compound and accumulates on Hg electrode preferentially over uranium-chloroanilic complex.Keywords Ground water.Minerals.Adsorptive Stripping V oltametry(AdSV).Chloroanlic acid1IntroductionAs per the United States,Environmental Protection Agency(USEPA),the chemical toxicity of uranium is more important than the radiological toxicity and the limit of uranium in various sources of drinking water system was reduced from100ppb to30ppb(USEPAWater Air Soil Pollut(2007)184:17–27DOI10.1007/s11270-007-9395-zR.K.Singhal(*):V.M.Joshi:J.Preetha:R.Karpe: A.Kumar:A.G.HegdeEnvironmental Studies Section/Health Physics Division, Bhabha Atomic Research Center,Trombay,Mumbai400085,Indiae-mail:rsinghal@.inV.M.Joshie-mail:vmj@.inJ.Preethae-mail:pjay@.inR.Karpee-mail:chakorkarpe@yahoo.co.inA.Kumare-mail:ajaykls@.inA.G.Hegdee-mail:aghegde@.in2001).Hence efforts are being made to accurately determine uranium concentrations in drinking water. There are several sources of uranium in groundwater such as rainwater,dissolution of soluble minerals and rock-water interactions.The water entering the ground through precipitation has essentially the same chemical composition as in the precipitation.As the water moves through the vadose zone its chemical composition changes due to addition of organic material and soluble salts.In the saturated zone,the water is isolated from the atmosphere and as the water moves in the ground water,oxygen is consumed by the oxidation of DOC.This changes the oxidation–reduction potential of the system and leads to a variety of rock-water interactions.The origin of major aqueous species in ground water is given in Table1 (Berner and Berner1996).Uranium occurs in rocks and sediments as(1) individual primary and secondary minerals(90%are secondary minerals),(2)isomorphous mixtures in the crystal lattices of other minerals,(3)in the dispersedstate in the form of the uranyl group(UOþ22)and(4)as dissolved compounds in ground water and soil moisture(Banks et al.1995;Copenhaver et al.1992; Porcelli and Swarzenski2003;Zouridakis et al. 2002).The levels of naturally occurring radionuclides in ground water is very low and in general are of no concern from the point of view of radiological impact on human health(Singhal et al.2004).In some of the ground water samples,direct determination of uranium in water sample is not possible by adsorptive striping voltametry due to interferences from other dissolved elements.The present work was performed with a view to identify the interfering elements in the direct analysis of uranium as UO2þ2in ground water.2Materials and Methods2.1Sample CollectionThe ground water samples were collected from three different locations spread over a distance of1.6km at Trombay,Mumbai having latitude19°00′498(N)and longitude72°55′136.Seawater samples were collect-ed at1km off-shore in Mumbai Harbour Bay situated between19°N,72.5°E and19.5°N and73°E.The samples were collected in1l polypropylene bottles.Various physicochemical characteristics including the concentration of uranium was measured in these samples.2.2Sample PreparationThe experimental solutions were prepared,by spiking samples collected from the ambient subsurface envi-ronment and sea water.The samples were collected in pre-washed polypropylene bottles.Various cations, anions and DOC was measured in the collected sample after filtering through0.45μm filter using suction filtration.Total Organic Carbon(TOC)analyzer (Shimadzu,TOC-V CSH)was used and the system was calibrated for the determination of TOC with standard solutions of sucrose.Thereafter samples were spiked with varying concentrations of cation,anions and DOC.To see the impact of variation in the concentration of uranium on the analysis,collected solution from the ambient environment was spiked with varying concentration of uranium.The samples were stored in acid washed200ml polypropylene bottles.The cation and anion in the samples were analysed by using Ion Chromatography(Dionex500). Table1Origin of major aqueous species in groundwater (Berner and Berner1996)Aqueous species OriginNa+NaCl dissolution(some pollution)Plagioclase weatheringRainwater additionK+Biotite weatheringK-feldspar weatheringMg+2Amphibole and pyroxene weatheringBiotite(and chlorite)weathering)Dolomite weatheringOlivine weatheringRainwater additionCa+2Calcite weatheringPlagioclase weatheringDolomite weatheringHCOÀ3Calcite and dolomite weatheringSilicate weatheringSO2À4Pyrite weathering(some pollution)CaSO4dissolutionRainwater additionCl-NaCl dissolution(some pollution)Rainwater additionH4SiO4(aq)Silicate weatheringThe calibration was carried out by using Dionex mixed standard solution for cations and anions Table2.2.3Determination of UraniumTraces of uranium in aquatic medium was very efficiently determined by electrochemical methods by Djogic et al.(1986,2001);Sander et al.(1995); Van den Berg and Huang(1984)and Wang and Setiadji(1992).During this work,ultra trace concen-trations of uranium(VI)has been determined using adsorptive stripping voltammetry of the uranium-chloroanilic acid complex(2,5-dichloro-3,6-dihydroxy-1,4-benzoquinone).The detection limit was calculated as<100ng/l(<0.1ppb).V oltammetric measurements were performed using a Metrohm Autolab30in conjunction with the663V A stand.A multi-mode electrode,also from Metrohm,was used for the reproducible production of hanging mercury drop electrode(HMDE)as the working electrode.The three-electrode system was completed by Ag/AgC1 (3mol/l KCl)reference electrode and a platinum auxiliary electrode.All the AdSV measurements were carried out in the differential pulse(DP)mode using a pulse amplitude of−50mV,a pulse time of30ms and a potential step of4mV(Table3).All chemicals used were analytical reagent grade(Merck and Fluka).A stock solution with1g/l uranium was prepared by dissolv-ing1.78g(CH,COO)2UO22H2O in1l of water containing1ml HNO3(65%).Further dilutions were made as and when required.The concentration of the chloroanilic acid solution was1×10−4mol/l. The pH of the sample in the reaction vessel was adjusted as2using supra-pure7.5M HNO3.3Results and DiscussionAdSV is known to be a very sensitive method for the determination of metals ions which form a strong complex with organic molecules.These organic molecules are surface active and are adsorbed on to the mercury drop which acts as a working electrode in AdSV(Thomas and Henze2001).These adsorptions are preferred rather than charge transfer at the electrode.Uranium forms a1:1complex with chlor-oanilic acid and gets adsorbed on the working electrode.A wide range of metal ions present in the water bodies also form metal chelate complexes.These complexes also get adsorbed on mercury electrode and may interfere in the analysis of uranium.When the adsorbed compounds can be oxidised or reduced,they may be estimated by stripping them from the electrode surface using differential pulse voltametry.Other metals which form complexes with chloroanilic acid do not inter-fere with the uranium determination either because their chloroanilic acid complexes have different accumulation potential or they have different strip-ping peak potential.The formation of the complexes, their stability,and the reduction potentials are strongly dependent upon the pH of the solution.In general,in ground water having pH between4.6and 6.5,uranium is present as carbonate complexes (UO2(CO3)3)−2along with Na+,Ca+2and Mg+2and at pH between7and8it occurs as(UO2(OH))+ (Singhal et al.2005b).In solutions having pH<4it occurs as sulfate compounds UO2(SO4)m.Sander Sylvia(1999)observed that the amount of current generated during the process of reduction of UO2þ2on the working electrode is highly pH dependent.Optimization of current due to reduction potential of uranium-Chloroanalic acid complex was done by studying the current vs pH variation.The variation in the peak height at different pH is shown in Fig.1.This figure shows that the maximum peak height is observed at pH2.It is known that uranium forms1:1complex with chloroanilic acid at pH2. This fact is in good agreement with the observations that chloranilic acid peak at0mV almost disappears when uranium is present in approximately equimolar concentrations.This would mean that a1:1uranium-chloranilic acid complex is formed.Table2gives the initial concentration of anions(Cl−1, F−1,and PO3À4),cations(Pb2+,Cu2+,Ca2+,Mg2+,Na+), DOC and uranium present in the water samples used in the present work.The variations in concentration of cations and anions in the groundwater is due to rock(or sediment)–water interactions which in turn is controlled by the minerals present in the rocks(or sediment).3.1Influence of Anions(F−1,Cl−1PO3À4)and Cations(Ca2+,Mg2+,K+)on the Uranium Determination Water samples,having different concentrations of F−1, Cl−1,PO3À4,Ca2+,Mg2+K+,Cu2+and Pb2+were spiked with varying concentration of uranium in therange of 10–100ppb.The uranium in these samples were measured after 15days and the results are shown in Fig.2.From this figure,it is clear that there is no influence of these anion and cations on the determination of uranium and the minor variations are statistically insignificant.To see the impact of increase in concentration of F −1,Cl −1,PO 3À4,Ca 2+,Mg2+K +,Cu 2+and Pb 2+the experimental solution were spiked by the addition of standards of these anions and cations.The concentra-tion of these anion and cations was increased by 30%from the original concentration in their respective water samples.The samples were spiked with uranium so that the total uranium in all the samples were 10ppb after taking into account the naturally dissolved uranium.The increase in ionic strength doesnot have any impact on the reduction of UO 2þ2i.e.U(VI)during the process of stripping.Reduction of U (IV)at various ionic strengths were also studied in details by Djogic and Branica (1993).Figures 3and 4shows that there is no impact on the uranium peak at various concentrations of anions(F −1,Cl −1,PO 3À4)and cations (Ca 2+,Mg2+K +).Small variations found are within statistical fluctuations.Therefore the maximum accumulation potential for uranium-chloroanilic acid is independent of the concentration of these anion and cations,although there is a possibility of forming Hg 2Cl 2layer at the Hg electrode at higher concentration of Cl −1(Thomas and Henze 2001).This accumulation,in turn affects the adsorption of uranium-chloroanilic complex on the electrode surface but this was not observed in the Cl −1concentration range of 20–24,000ppm.Direct determination of uranium in sea water where average Cl −1concentration in the range of 17,000–19,000ppm were made by Singhal et al.(2005a );Table 2Mean value of various physicochemical characteristics of the well water and sea water used for the experiment Sample (ID)Ground water-1Ground water-2Ground water-3Sea Water F −1(mg/l)0.19±0.050.15±0.040.67±0.030.11±0.01Cl −1(mg/l)20±1.621.3±1.268.0±1.818,000±450PO 3À4(mg/l)0.64±0.03NDNDNDNa +(mg/l)26.0±2.129.7±2.240.2±2.311,200±300K +(mg/l)0.82±0.01 1.74±0.05 2.41±0.14325±25Mg 2+(mg/l)16.2±1.223.2±2.124.5±1.81,150±53Ca 2+(mg/l)42.6±3.249.3±3.464.9±2.1300±20Cu 2+(μg/l) 6.1±0.8 5.1±0.95±0.85±0.8Pb 2+(μg/l) 3.2±0.65±0.94±0.74±0.7DOC (mg/l)10±0.8912±0.1914±1.027.3±0.9U (ppb)1.8±0.042.6±0.123.3±0.814.2±0.09567891011P e a k h e i g h t [-n A ]p HFig.1Dependance of peak height on pH {conditions uranium:2ppb,chloroanilic acid:1×10⁻⁴M with initial potential 50mV ,end poten-tial −100mV and step po-tential 0.6mV}Djogic and Branica (1991,1995);Kim and Zeitlin(1971).Similarly in the case of F −1and PO 3À4there is strong tendency for the uranium either to form its fluoride complex or uranyl phosphates (UO 2)3(PO 4)2.The experimental results however show that upto100ppb of uranium as UO 2þ2and F −and PO 3À4in the concentration range of 0.01–2.5ppm and 0.15–1.3ppm do not effect its determination and all theUO 2þ2are available for complexation with chloro-anilic acid.The major cations Ca 2+,Mg 2+,K +in the concen-tration range of 55–450,21–1,500and 1.2–425ppm do not affect the accumulation of uranium-chloroa-nilic acid complex (Fig.4).In the presence of these cations there is a possibility of accumulation of these ions on the surface of the mercury electrode by charge transfer rather than adsorption.3.2Influence of PbLead (Pb)To study the impact of Pb as Pb 2+on uranium determination by AdSV,experiments were conducted by spiking the solution about 65times more than the average concentrations of lead in drinking water i.e.3ppb.Figure 5shows that there is no major impact of lead on uranium determination by AdSV using chloroanilic acid.Only small varia-tion in peak height is observed i.e.peak height is about 10%less in presence of 192ppb lead with EDTA (2.73×10⁻⁴M)peak height is increase by 10%compare to solution having no lead.There is no peakTable 3Various optimum conditioned used for the analyis of uranium by adsorptive striping voltametry Sr.No.Pre-treatment1.Purge time (s)1202.Conditioning potential (V)03.Duration (s)04.Stirrer off during conditioning –5.Deposition potential (mV)1006.Duration (s)1807.Stirrer off during deposition –8.Equilibration time (s)5Measurement 9Cell off after measurements –10.Modulation time 0.0511.Interval time 0.15Potentials 12.Initial potential (mV)5013.End potential (mV)−10014.Step potential (mV)615.Modulation amplitude (V)−0.0499Chemical composition of the solution16.pH 1.817.Chloroanilic acid (CAA)concentration9.2×10−7102030405060708090100* Initial concentration of uranium taken into accountC o n c e n t r a t i o n o f u r a n i u m (p p b )Type of water samplesFig.2Impact of physico-chemical characteristics of water on the analysis of uraniumformation for lead alone with chloroanilic acid in the potential range set for the experiment.Similarly,no effects were observed by masking Pb by complexing with EDTA To verify the interferences due to these metal ions,experiments were performed in the presence of Ethylene Diamine Tetraacetic Acid (EDTA).EDTA has been used to mask the interfer-ence of Pb and Cu as EDTA is a strong complexing agent having a stability constant (Log β1)of 16.2and 18.5respectively for Pb and Cu.3.3Influence of CuCopper (Cu)In many places like Olympic dam at Australia and Jadugada at India where uranium is mined,the concentration of copper is very high,hence the interference of copper was studied in detail.The experiments were also conducted to see the effect of chloroanilic acid (CAA),pH and accumulation potential variation on the determination uranium in the presence of copper and EDTA.The experimental observation are as follows.3.3.1Impact of Variation in Concentration of Copper In the case of copper,strong interference was observed in the analysis of uranium if the concentra-tion of copper is more than 200ppb.From Fig.6,it is clear that Cu alone does not give any peak with chloroanilic acid.From the experimental observation,it is clear that no uranium reduction peak were observed in the potential range of −250–0mV .T y pe -1T y pe -2T y pe -3T y pe -4T y pe -5T y pe -6T y pe -7100100010000C l-1S a m p l e s T y p ep p m-1.0-0.50.00.51.01.52.02.53.0F-1p p m0.00.20.40.60.81.01.21.4p p m9.09.39.69.910.210.510.8p p bFig.3Impact of C −1,F −1,and PO 3À4on uranium de-termination by AdSVHowever complexing Cu by the addition of 1ml of2%EDTA solution in reaction mixture of 25ml i.e.final concentration of EDTA in the reaction mixture is 2.73×10⁻³M,uranium reduction peak reappear.But by further increasing the concentration from 0.2–77ppm,EDTA also was also not able to mask the Cu and a broad peak appeared and made it impossible to measure the concentration of uranium in the presence of copper.Van Den Berg and Huang (1984)had observed a similar interference of Cu in case of uranium determination by complexing with Catechol.They were also able to remove the interference by using EDTA.3.3.2Influence of Variation in Concentrationof Chloroanilic Acid (CAA)Variation in concentration of chloroanilic acid was carried in the range of 9.5×10⁻⁸M to 2.6×10⁻⁶M,keeping the concentration of uranium as 3.8ppb,EDTA as 2.73×10⁻⁴M,pH 1.8and accumulation potential as 100mV .Observed variation in concen-tration of uranium/current was shown in the Fig.7.From this figure its clear that solution having CAA concentration upto 4.7×10⁻⁷M have peak position at −20mV and peak height is little low but measurement of U having CAA in the range of 9.2×10⁻⁷M to 2.6×10⁻⁶M have almost negligible impact on uranium measurement giving constant current and peak posi-tion at −40mV .Therefore in all experiment optimum CAA concentration of 9.2×10⁻⁷M was used.3.3.3Influence of Variation in Accumulation Potential Variation in accumulation potential was carried out in the range of 10mV to 400mV ,keeping the concen-tration of uranium as 3.8ppb,EDTA as 2.73×10⁻⁴M CAA as 9.2×10⁻⁷M and pH as 1.8.Figure 8showsT y pe -1Ty p e -2T y p e -3T y p e -4T y p e -5T y p e -6T y p e -711010S a m p le T y p ep p m10100100p p m100200300400500p p m7.07.58.08.59.09.510.010.5p p bFig.4Impact of K +1,Mg +2,and Ca 2+on uranium determination by AdSVthe variation in current/uranium concentration at dif-ferent accumulation potential.From this figure it is clear that optimum potential is 100/150mV as on other potential either no peak was observed otherwise the peak height is quite low.Therefore in all experiments optimum accumulation potential of 100mV was used.3.3.4Influence of variation in pHVariation in pH was carried out in the range of 0.5to 2.5,keeping the concentration of uranium as 3.8ppb,EDTA as 2.73×10⁻⁴M,CAA as 9.2×10⁻⁷M and deposition potential as 100mV .Figure 9shows the0.00E+0005.00E-0091.00E-0081.50E-0082.00E-0082.50E-0083.00E-0083.50E-0084.00E-008I /AE/VFig.5Variation in the cur-rent with applied voltage at different concentration of uranium and lead-0.25-0.20-0.15-0.10-0.050.00-2.00E-0080.00E+0002.00E-0084.00E-0086.00E-0088.00E-0081.00E-0071.20E-0071.40E-0071.60E-0071.80E-0072.00E-007I /AE/VFig.6Variation in the cur-rent with applied voltage at different concentration of uranium and coppervariation in peak current position at different pH.From this figure it is clear that optimum pH of the solution should be 1.8.Although pH 1.5also give a similar peak current but the position of the peak was shifted to −20mV.In view of this,observation,optimum pH of the solution was maintained at 1.8in all the experiments.3.4Influence of Dissolved Organic Compound(DOC)on the Uranium Determination DOC is ubiquitous in the aquatic subsurface and surface environment.Variation in the DOC content depends on many localized geo-chemical parameters like oxic and anoxic conditions,pH etc.Determina-tion of uranium in water by AdSV is based on adsorption of surface active compound on a hanging mercury electrode.In natural water samples,surface active substances such as surfactants,humic and fulvic acids are known as organic contaminants (DOC).By maintaining a constant potential on the working electrode,not only the metal complex is adsorbed but also organic surface active compounds could also be accumulated at the electrode surface.Depending on the strength of the adsorption,a competition of both analyte and organic surfactant takes place (Sander et al.1995).The influence of organic surfactants on the uranium determination was tested by Sander and Henze (1996)using alternating current investigations to explain the competitive1E-91E-81E-7I /AE/VFig.8Evaluation of 3.6ppb of U at accumulation poten-tial in therange of 10–400mV and in the presence of 5ppm of copper and 2.7×10⁻³M EDTA and 9.2×10⁻⁷M CAAI /AE/VFig.7Evaluation of 3.8ppb of uranium in the presence of 5ppm of copper and 2.7×10⁻³M of EDTAadsorption process on the electrode surface.The initial content of DOC was destroyed by refluxing the solution with H 2O 2in acidic medium and initial content of DOC in the experimental was 0.01ppm.By adding different concentrations of humic acid solution in the range of 0.02–16ppm,for a solution having 10ppb of uranium,it can be seen in Fig.10,that the peak height remains almost constant up to a humic acid concentration of 15ppm and thereafter the peak height decreases with the increase in concentrationof humic acid.There was no uranium peak at humic acid concentration of 16ppm.Therefore,destruction of DOC is essential for the analysis of uranium if sample have concentration of DOC more than 15ppm.4ConclusionsThe AdSV determination of uranium with chloro-anilic acid as complexing reagent is a very sensitive0.010.11100102030405060Concentration of DOC (ppm)P e a k h e i g h t (n A )246810Uranium concentration (ppb)Fig.10Influence of dis-solve organic compound on uranium analysis by AdSV-0.10-0.08-0.06-0.04-0.020.000.020.040.060.081E-91E-81E-7I /AE/VFig.9Evaluation of 3.6ppb of U at different pH in the range of 0.5–2.5and in the presence of 5ppm of copper and 2.7×10⁻³M EDTA and 9.2×10⁻⁷M CAAand a very selective method.Almost no interferences are caused either by major cations nor by anions in ground water(Singhal et al.2004).Observed inter-ference caused by deposition of surface active dissolved substances like DOC on Hg electrode is taken care of by the destruction of organic compound by wet digestion.This interference is observed only in the case of organic rich water samples.Sample pretreatment is not necessary in most of the cases as water having more than15ppm DOC is very rare except in samples collected from organically rich areas.The interference due to copper is mainly due to deposition of Cu-chloroanilic acid complex other than UO2þ2chloroanilic acid complex and to a limited extent,can be masked by the addition of EDTA which complexes Cu2+with EDTA.Acknowledgement The authors sincerely acknowledge the guidance and help provided by Shri M.L.Joshi,Head,Health Physics Division.Thanks are also due to Shri H.S.Kushwaha, Director,H,S and E Group,for constant encouragement. ReferencesBanks,D.,Røyset,O.,Strand,T.,&Skarphagen,H.(1995).Radioelement(U,Th,Rn)concentrations in Norwegian bedrock groundwaters.Environmental Geology,25,165–180.Berner,E.K.,&Berner,R.A.(1996).Global environment: Water,air,and geo-chemical cycles(p.376).Upper Saddle River,NJ:Prentical Hall.Copenhaver,S. A.,Krishnaswami,S.,Turekian,K.K.,& Shaw,H.(1992).238U and232Th series nuclides in groundwater from the J-13well at the Nevada Test Site: Implication for ion retardation.Geophysical Research Letters,19(13),1383–1386.Djogic,R.,&Branica,M.(1991).Dissolved uranyl complexed species in artificial seawater.Marine Chemistry,36,121–135. Djogic,R.,&Branica,M.(1993).Study of uranyl(VI)ion reduction at various ionic strengths of sodium perchlorate.Analytica Chimica Acta,281,291–297.Djogic,R.,&Branica,M.(1995).Direct determination of dissolved uranyl(VI)in sea-water by cathodic stripping voltammetry.The Analyst(London),120,1989–1993. Djogic,R.,Pizeta,I.,&Branica,M.(2001).Electrochemical determination of dissolved uranium in Krka River estuary.Water Research,35(8),1915–1920.Djogic,R.,Sipos,L.,&Branica,M.(1986).Characterization of uranium(VI)in seawater.Limnology and Oceanography, 31(5),1122–1131.Kim,Y.S.,&Zeitlin,H.(1971).Separation of uranium from seawater by adsorbing colloid flotation.Analytical Chem-istry,43(11),1390–1393.Porcelli,D.,&Swarzenski,P.W.(2003).The behavior of U-and Th-series nuclides in groundwater.Reviews in Miner-alogy and Geochemistry,52,317–361.Sander Sylvia(1999).Simultaneous adsorptive stripping voltammetric determination of molybdenum(VI),uranium (VI),vanadium(V),and antimony(III).Analytica Chimica Acta,394,81–89.Sander,S.,&Henze,G.(1996).Alternating current inves-tigations at the mercury drop electrode on the adsorption potential of metal complexes.Electroanalysis,8,253–263. Sander,S.,Wagner,W.,&Henze,G.(1995).Direct determi-nation of uranium traces by adsorptive stripping voltam-metry.Analytica Chimica Acta,305,154–158. Singhal,R.K.,Joshi,S.N.,&Hegde,A.G.(2004).Association of uranium with colloidal and suspended particulate material in Arabian sea near the West Coast of Maharashtara (India).Journal of Radioanalytical and Nuclear Chemistry, 261(2),263–267.Singhal,R.K.,Kumar,A.,Preetha,J.,Karpe,R.,Dutta,M.,& Hegde,A.G.(2005a).Evaluation of chemical and radio-logical risk due to natural uranium in various drinking water sources at Mumbai.Pollution in urban and industrial environment(pp.264–267).New Delhi:Allied. Singhal,R.K.,Kumar,A.,Preetha,J.,Karpe,R.,Datta,M.,& Hegde, A.G.(2005b).Association of uranium with colloids of natural organic matter in subsurface aquatic environment.Journal of Radioanalytical and Nuclear Chemistry,263(3).Thomas,F.G.,&Henze,G.(2001).Introduction to voltam-metric analysis–Theory and practice.Collingwood: CSIRO.USEPA(2001).National primary drinking water regulations;radionuclides;40CFR Parts9,141and142[FRL–6909–3] RIN2040–AC98National Primary Drinking Water Regu-lations;Radionuclides;Final Rule Dec.7,2000.Van Den Berg,C.M.G.,&Huang,Z.Q.(1984).Determina-tion of uranium(VI)in sea water by cathodic stripping voltammetry of complexes with catechol.Analytica Chimica Acta,164,209–222.Wang,J.,&Setiadji,R.(1992).Selective determination of trace uranium by stripping voltammetry following adsorptive accumulation of the uranium-cupferron complex.Analy-tica Chimica Acta,264,205–211.Zouridakis,N.,Ochsenkühn,K.M.,&Savidou,A.(2002).Determination of uranium and radon in potable water samples.Journal of Environmental Radioactivity,61(2), 225–232.Water Air Soil Pollut(2007)184:17–2727。