风险管理软件CrystalBall操作指南(英文版)(doc 16页)
风险管理工具——Crystal Ball在企业经营风险管理中的应用
风险管理工具——Crystal Ball在企业经营风险管理中的应用发表时间:2009-12-07T16:14:50.500Z 来源:《中小企业管理与科技》2009年11月上旬刊供稿作者:胡静波[导读] 但在中国,有完善的风险管理系统的企业却凤毛麟角,因此风险管理更是中国企业需要加强的一环。
胡静波(浙江长征职业技术学院)摘要:本文详细介绍了风险管理工具——Crystal Ball软件的功能,用一个制造企业的例子,构建了企业生产经营的风险分析模型,并用Crystal Ball对企业生产经营风险进行了分析。
论文说明,用Crystal Ball构建企业生产经营风险分析模型是可行的,分析结果对企业经营决策有重要的参考价值,是提高企业风险管理的有效工具。
关键词:Crystal Ball 企业经营风险管理0 引言自改革开放以来,中国的企业蓬勃发展,但大多数的企业由于没有经历大萧条的洗礼,风险管理意识比较薄弱,不少企业在经营过程中盲目扩张,一旦遇到外部环境逆向变化,常常在一夜之间轰然倒塌。
席卷全球的金融危机,正是源于对风险的失控,而在金融危机导致经济环境恶化的情形下,更使得成千上万的企业关门倒闭。
只有风险管理完善的企业不仅在此巨大的危机面前幸存,而且化危为机,又一次借千载难逢的机会壮大、发展了自己。
一个企业要基业长青,完善的风险管理是必要的一环。
据报道,在世界500强中有85%的公司,以及在美国50个顶尖MBA院校中有40个都使用Crystal Ball来进行风险管理分析或风险管理教学。
但在中国,有完善的风险管理系统的企业却凤毛麟角,因此风险管理更是中国企业需要加强的一环。
1 风险概述风险是对当事人不利的事件发生的可能性,风险的大小与三方面的因素有关:①不利事件发生的概率;②不利事件发生以后,所产生后果的严重性;③当事人对不利事件及其后果的态度。
风险的种类很多,如财务风险、时间风险、人身伤害风险、名誉风险等。
有的风险可以度量,有些则难以度量。
ORACLE CRYSTAL BALL Release 11.1.2.2.000 说明书
Release 11.1.2.2.000C ONTENTS I N B RIEFPurpose (2)New Features (2)Installation Information (2)Supported Platforms (2)Supported Languages (2)Defects Fixed in this Release (3)Known Issues (3)Tips and Troubleshooting (5)Documentation Updates (5)Accessibility Considerations (6)PurposeThis document includes important, late-breaking information about this release of Oracle Crystal Ball and related products. Review this Readme thoroughly before installing Crystal Ball.New FeaturesSee the Oracle Crystal Ball New Features.For new features relating to installation, architecture, and deployment changes in this release, see the Oracle Crystal Ball Installation and Licensing Guide.Installation InformationLate-breaking information about installation of Crystal Ball products is provided in this readme and the Oracle Crystal Ball Installation and Licensing Guide. Also see License Key Request Process.html for information about obtaining and applying a Crystal Ball license code. Review this information thoroughly before installing Crystal Ball.Supported PlatformsInformation about system requirements and supported platforms for Crystal Ball and related products is available in the Oracle Crystal Ball Installation and Licensing Guide. Also see the Oracle Enterprise Performance Management System Certification Matrix. This matrix is posted on the Oracle Fusion Middleware Supported System Configurations page on the Oracle Technology Network (OTN):/technetwork/middleware/ias/downloads/fusion-certification-100350.htmlIf you have Oracle Crystal Ball Enterprise Performance Management or Oracle Crystal Ball Enterprise Performance Management for Oracle Hyperion Enterprise Planning Suite, see the Oracle Crystal Ball Enterprise Performance Management Integration Guide for additional compatibility information.Supported LanguagesInformation about supported languages for Crystal Ball is available in the Oracle Crystal Ball Installation and Licensing Guide. The user interface of this version of Crystal Ball is translated into French, German, Japanese, Portguese, and Spanish. Documentation is not currently translated.2ReadmeDefects Fixed in this ReleaseThe following customer-reported defects and enhancement requests were addressed in thisrelease of Crystal Ball and related products:l7396611—Users requested the ability to group assumptions for sensitivity analysis.l7396789—Users requested the ability to filter outliers when fitting data to distributions.l7402919—Crystal Ball was not displaying strings in the Crystal Ball dialogs in Spanish when the Spanish language ID was set to Spanish (international sort).l7407051—There was no way to control whether Crystal Ball wrote to a log file.l11061695—Incorrect correlation coefficients were sometimes displayed in scatter charts when charts were resized.l11069890—64-bit Crystal Ball: An unexpected error could occur when extracting data with Crystal Ball running in 64-bit Microsoft Excel 2010 when the computer is low on resources.l12432539—OptQuest could return inaccurate results when running in Extreme Speed with an interative model.l12724564—The CB.Normal spreadsheet function could return inaccurate results in very rare cases where the order of Microsoft Excel function evaluation is indeterminate.l12913923—Users requested the ability to display the comparison chart in the Batch Fit tool to view and possibly override the distribution type after each fit.l12918734—Users requested the ability to use higher parameter limits for binomial and Poisson distributions.l12938238—In OptQuest, the final value statistic could be inaccurate for an objective whose forecast statistic is a final value computation of several capability metrics.l13093364—Unexpected results could occur when Crystal Ball was unloaded usingDeveloper Kit calls while Microsoft Excel was still open.l13346887—Unexpected results could occur during assumption operations when Crystal Ball was used in a 64-bit environment.l13372753—The OptQuest results window could be blank when OptQuest was run with charts suppressed.l13481610—Users requested the ability to include Microsoft Excel cell comments for assumption and decision variable cells in Crystal Ball reports.If you are coming from Release 11.1.2.0 or 11.1.2.1, use the Defects Fixed Finder tool to reviewthe list of defects fixed between those releases and Release 11.1.2.2. This tool is available here:https:///oip/faces/secure/km/DocumentDisplay.jspx?id=1292603.1Known IssuesThe following are the noteworthy known issues of this release:Readme3l7403337—CB Tools: The Correlation Matrix tool cannot run on more than 255 assumptions (256 if formatting is not requested).l7407256—Crystal Ball Developer Kit: Always use the English list separator character (,) and the English decimal separator (.).l7475110—Integration with other Oracle EPM products: If the Strategic Finance Setup wizard is used to create a Strategic Finance Worksheet, and then a Crystal Ball simulation is run with charts minimized and worksheets suppressed, it is not possible to stop the simulation manually.Workaround: The Crystal Ball Control Panel, Crystal Ball toolbar buttons, and Run menu can be used to control the simulation when the charts and worksheets are maximized and visible.l7482940—Integration with other Oracle EPM products: If the Strategic Finance Setup wizard is used to create a Strategic Finance Worksheet using a server-based entity, the actual URL for the server is not listed.Only the user-specified name for the server appears on the Setup wizard's Entity Selection panel.l8604284—Integration with other Oracle EPM products: In Crystal Ball EPM, the Enterprise Performance Management connector is inactive by default and must be explicitly activated through the appropriate Crystal Ball More Tools command.l8676929—Integration with other Oracle Enterprise Performance Management (EPM) products: For best results, do not use the Crystal Ball Define, Cell Preferences command on Smart View worksheets.l9074866—Range names: In rare cases, range names disappeared when a Crystal Ball workbook was reopened in Microsoft Office Excel 2007.Fix: Install one of the following Microsoft updates, available at : Microsoft Security Update for Microsoft Office Excel 2007 (KB969682), Release Date: 6/8/2009 or Microsoft Security Update for Microsoft Office Excel 2007 (KB973593), Release Date: 11/9/2009.l9550147—Extreme Speed: Unexpected errors can occur when running Crystal Ball models containing formulas longer than 1024 characters in Extreme Speed mode in Microsoft Excel 2002 (XP) and Microsoft Excel 2003.Workaround: Use formulas that are shorter than 1024 characters or use a later version of Microsoft Excel.l10046029—64-bit OptQuest: For a specified seed value, OptQuest simulation calculations can be slightly different in 32-bit and 64-bit versions of Crystal Ball Decision Optimizer, which can affect the optimization path.If a model is very sensitive to small changes in decision variables, the best solution could differ between versions.l10051948—64-bit Crystal Ball: Although the same calculation algorithms are used in 32-bit and 64-bit versions of Crystal Ball, if a model has extremely large or small parameters, or other edge conditions, results can differ between versions.4Readmel10284043—Control Panel: In specific machine system timer environments, the Crystal Ball Control Panel and reports may show a simulation or optimization run time of 0.l10303159—Performance: Crystal Ball Normal speed simulations run significantly slower in Microsoft Excel when the Microsoft Euro Currency Tools add-in is loaded.l11065176—OptQuest: If two unrelated workbooks with OptQuest settings are open -- one of interest and the other secondary -- and an assumption has been defined in the secondaryworksheet, optimizations will not run correctly in the other.Workaround: Close the secondary worksheet or freeze all assumptions in it.l13802839—Localization: When running Crystal Ball with Windows, the system locale, and Microsoft Office in a supported language, the Crystal Ball user interface reverts to Englishafter the Crystal Ball Welcome Screen is displayed.Workaround: In the Welcome Screen, clear the “Show at startup” checkbox and restartCrystal Ball.l13811562—When attempting to run Crystal Ball with only Microsoft .NET Framework 4.0 installed, a startup error occurs.Workaround: Use only supported versions of Microsoft .NET Framework, currently version3.5.Tips and TroubleshootingSee the "Troubleshooting" section of the Oracle Crystal Ball Installation and Licensing Guide forinstallation and startup issues not described previously in this document. Documentation UpdatesAccessing EPM System Product DocumentationThe most recent version of each Oracle Enterprise Performance Management System productguide is available for downloading or viewing from the EPM System Documentation area of theOTN Web site (/technology/documentation/epm.html). You can alsouse the EPM System Documentation Portal (/us/solutions/ent-performance-bi/technical-information-147174.html), which also links to EPM SupportedPlatform Matrices, My Oracle Support, and other information resources.Deployment-related documentation is also available from the Oracle Software Delivery CloudWeb site (/EPD/WelcomePage/get_form).Individual product guides are available for download on the Oracle Technology Network Website only.Readme5Copying and Pasting Code Snippets from PDFsWhen you cut and paste code snippets from a PDF file, some characters can be lost during the paste operation, making the code snippet invalid. Workaround: Cut and paste from the HTML version of the document.Accessibility ConsiderationsIt is our goal to make Oracle products, services, and supporting documentation accessible to the disabled community. Oracle Crystal Ball products support accessibility features, which are described in the product's Accessibility Guide. The most up-to-date version of this guide can be found in the Oracle Enterprise Performance Management System Documentation Library on the Oracle Technology Network (/technology/documentation/ epm.html).In addition, this Readme file is accessible in HTML format.6ReadmeReadme7COPYRIGHT NOTICECrystal Ball Readme, 11.1.2.2.000Copyright © 2012, Oracle and/or its affiliates. All rights reserved.Authors: EPM Information Development TeamOracle and Java are registered trademarks of Oracle and/or its affiliates. Other names may be trademarks of their respective owners.This software and related documentation are provided under a license agreement containing restrictions on use and disclosure and are protected by intellectual property laws. Except as expressly permitted in your license agreement or allowed by law, you may not use, copy, reproduce, translate, broadcast, modify, license, transmit, distribute, exhibit, perform, publish, or display any part, in any form, or by any means. Reverse engineering, disassembly, or decompilation of this software, unless required by law for interoperability, is prohibited.The information contained herein is subject to change without notice and is not warranted to be error-free. If you find any errors, please report them to us in writing.If this is software or related documentation that is delivered to the U.S. Government or anyone licensing it on behalf of the U.S. Government, the following notice is applicable:U.S. GOVERNMENT RIGHTS:Programs, software, databases, and related documentation and technical data delivered to U.S. Government customers are "commercial computer software" or "commercial technical data" pursuant to the applicable Federal Acquisition Regulation and agency-specific supplemental regulations. As such, the use, duplication, disclosure, modification, and adaptation shall be subject to the restrictions and license terms set forth in the applicable Government contract, and, to the extent applicable by the terms of the Government contract, the additional rights set forth in FAR 52.227-19, Commercial Computer Software License (December 2007). Oracle America, Inc., 500 Oracle Parkway, Redwood City, CA 94065.This software or hardware is developed for general use in a variety of information management applications. It is not developed or intended for use in any inherently dangerous applications, including applications that may create a risk of personal injury. If you use this software or hardware in dangerous applications, then you shall be responsible to take all appropriate fail-safe, backup, redundancy, and other measures to ensure its safe use. Oracle Corporation and its affiliates disclaim any liability for any damages caused by use of this software or hardware in dangerous applications.This software or hardware and documentation may provide access to or information on content, products, and services from third parties. Oracle Corporation and its affiliates are not responsible for and expressly disclaim all warranties of any kind with respect to third-party content, products, and services. Oracle Corporation and its affiliates will not be responsible for any loss, costs, or damages incurred due to your access to or use of third-party content, products, or services.。
风险管理工具_CrystalBall在企业经营风险管理中的应用
3.7 决策表(Decis ion Table) 决策表是用来表示当决策变量取
定义第 2 年 ~ 第 5 年的累积税后利润为预测变量是类似的。
不同的值时,选定的目标预测变量均值的变化。
271
例如,模型中有 2 个决策变量:“前两年生产线数量”和“后三年 新增生产线数量”。在运用决策表之前,需要先定义这两个决策变量。
图 12 生成决策表的第 2 步:选择决策变量
图 10 定义决策变量“后三年生产线数量”对话窗口
在图 10 中,输入变量名,选择变量上下界(Variable Bounds), 下界 (Low er) 为 1,上界 (Upper) 为 3。选择变量类型(Variable Type)为“离散(Diccrite)”,输入步长(Step)为 1。
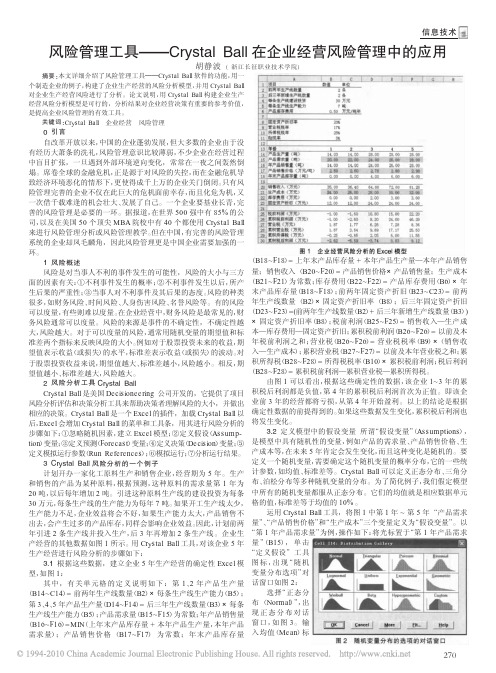
很多,如财务风险、时间风险、人身伤害风险、名誉风险等。有的风险 年生产线数量 (B2)×固定资产折旧率 (B8);后三年固定资产折旧
可以度量,有些则难以度量。在企业经营中,财务风险是最常见的,财 (D23~ F23)=(前两年生产线数量(B2)+ 后三年新增生产线数量(B3))
务风险通常可以度量。风险的来源是事件的不确定性,不确定性越 ×固定资产折旧率(B8);税前利润(B25~ F25)= 销售收入—生产成
和销售的产品为某种原料,根据预测,这种原料的需求量第 1 年为 布、泊松分布等多种随机变量的分布。为了简化例子,我们假定模型
20 吨,以后每年增加 2 吨。引进这种原料生产线的建设投资为每条 中所有的随机变量都服从正态分布。它们的均值就是相应数据单元
30 万元,每条生产线的生产能力为每年 7 吨。如果开工生产线太少, 格的值,标准差等于均值的 10% 。
Crys tal Ball 是美国 Decis ioneering 公司开发的,它提供了项目 积税后利润都是负值,第 4 年的累积税后利润首次为正值。即该企
风险管理软件Crystal-Ball使用指导(中英文)
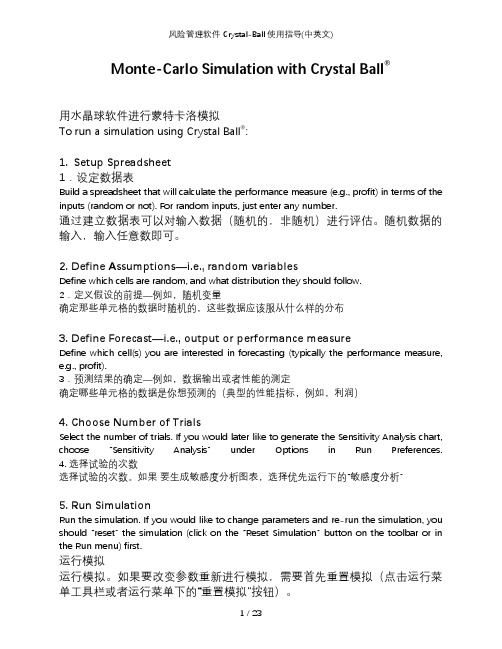
Monte-Carlo Simulation with Crystal Ball®用水晶球软件进行蒙特卡洛模拟To run a simulation using Crystal Ball®:1.Setup Spreadsheet1.设定数据表Build a spreadsheet that will calculate the performance measure (e.g., profit) in terms of the inputs (random or not). For random inputs, just enter any number.通过建立数据表可以对输入数据(随机的,非随机)进行评估。
随机数据的输入,输入任意数即可。
2. Define Assumptions—i.e., random variablesDefine which cells are random, and what distribution they should follow.2.定义假设的前提—例如,随机变量确定那些单元格的数据时随机的,这些数据应该服从什么样的分布3. Define Forecast—i.e., output or performance measureDefine which cell(s) you are interested in forecasting (typically the performance measure, e.g., profit).3.预测结果的确定—例如,数据输出或者性能的测定确定哪些单元格的数据是你想预测的(典型的性能指标,例如,利润)4. Choose Number of TrialsSelect the number of trials. If you would later like to generate the Sensitivity Analysis chart, choose “Sensitivity Analysis” under Options in Run Preferences.4. 选择试验的次数选择试验的次数。
Crystall_Ball模拟软件
实验次数 均值 中数 众数 标准差 方差 偏度(描述变量取值分布对称性的统计量) 峰度(描述变量取值分布形态陡缓程度的统计量) 变异系数 平均标准误差
4 示例-费瑞迪报童问题
通过前面的模拟,设定了弗瑞迪每天《金融日 报》的定购数量为60份,因为这个定购量是一 个能够满足需求又不会剩余大量未出售报纸的 一个合理折中值
然而通过目前的模拟,还不能说明60是否是最 大化其日均利润的最优定购量。利用Crystal Ball软件中的OptQuest最优化模型可以搜索 最佳定购量。
4 示例-费瑞迪报童问题
用决策表制定决策
在40到70之间的哪个订购量能够最大化每天的平均利润呢? 比较合理的做法是试验订购量的可能值的各个样本,如 40,45,…,70。
4 示例-费瑞迪报童问题
定义预测单元格:计算机模拟的电子表格模型并没有包括目
标单元格,但是预测单元格可以实现这一作用。定义预测单元格 的步骤:
(1)选中一个单元格; (2)单击Crystal Ball工具条中的Define Forecast按钮,从而弹出
定义预测对话框(如图8-14所示) (3)这个对话框可以用来输入一个名字标签,并且定义预测单元格的
3 Crystal Ball工具条
Define Define
Run Start
Reset
Forecast Trend
Assumptions Forecast Preferences Simulation Simulation Windows Chart
4 示例-费瑞迪报童问题
问题描述
成本数据
每份报纸成本费用1.50美元 售价2.50美元 未出售的报纸退款0.50美元
第三步对话框用来制定决策表的选项。第一个输入方框记录了对 于每一个决策变量的值所要运行模拟的次数。Crystal Ball会在 定义决策变量对话框所制定的范围内平均分布数值。对于弗瑞迪 报童问题,数值的范围是40到70,在第三步对话框中输入数字7 就会选择40、45、50、55、60、65、70这七个订单量的数值 进行模拟。 最后一步就是单击Start按钮。
Crystal Ball 模拟基础教程

Crystal Ball 模拟基础教程利用Crystal Ball 进行计算机仿真学习目标13.2个案研究:佛莱迪报童问题(13.1节) 13.3–13.19竞标建设计划(13.2节) 13.20–13.24项目管理:信用建设公司(13.3节)13.25–13.32现金流量管理:沼泽地黄金岁月公司(13.4节) 13.33–13.37财务风险分析:久大发展公司(13.5节)13.38–13.42运输业收入管理(13.6节)13.43–13.48选择合适的分配(13.7节)13.49–13.68利用决策表做决策(13.8节) 13.69–13.84学习目标在读完本章后,你应该能够:1. 描述Crystal Ball在计算机仿真中的角色。
2. 利用Crystal Ball来解决Excel软件包所无法执行的各类基本计算机仿真。
3. 解释利用Crystal Ball于计算机仿真中的结果。
4. 在获得预期的准确度水平后,利用Crystal Ball的特色来停止计算机仿真。
5. 描述当使用Crystal Ball时可以搭配计算机仿真的机率分配之特色。
6. 利用Crystal Ball程序辨识出符合历史数据的连续分配。
7. 利用Crystal Ball的特色来产生一些帮助决策的决策表和趋势图。
报童佛莱迪佛莱迪在某大城市里主要市区经营一家报摊。
佛莱迪贩卖各类的报纸和杂志,其中最贵的报纸为财经日报。
财经日报相关的成本资料:–每份报纸的成本为1.50美元–每份报纸的售价为2.50美元–没售出的报纸,每份报纸可以获得0.50美元的偿还金财经日报的销售资料:–佛莱迪每天的销售量介于40到70份之间。
–销售数量介于40到70份之间任何数值的频率相同。
运用仿真之电子表格模式Crystal Ball的应用利用Crystal Ball来进行计算机仿真有四个步骤:–定义随机输入栏。
–定义输出栏来预测。
–设定执行偏好。
–执行模拟。
Crystal Ball软件
B 增加风险运算的可能性
什么是达到一个特殊目标的可能性?什么是影响风险要素的可能性?所有这些问题以及其它一 些假设问题的答案都是有未知情况发生的可能性决定的。Crystal Ball 通过运用蒙特卡罗模拟系 统对某个特定状况预测所有可能的结果,从而自动完成各种假设过程。该程序在定义许可的范围 内生成随机值,然后经过成百上千次的严格运算,再将每种结果分别赋给每种可能性,这个过程 减少了必须由人工输入各种不同可能性的工作量,从而节约了时间。
C 操作高级功能
对于高级用户来说,Crystal Ball 可以提供关联假设,敏感度分析,数据分布相称性分析以及预 测控制等功能。这些特点可以提供更精确的分析。由于拥有如此之多的功能,使得 Crystal Ball 可 以引导用户经过少许努力就可以获得更有用的信息。
专业版
A 强大的功能特点——更为准确的结果
D 浅显易懂的图表和报告
能够快速方便地生成浅显易懂的图表和报告。这些详细的资料可以使用户依靠所列举的各种假设 和预测结果迅速做出正确和漂亮的决定。
高级版
除了专业版的所有功能之外,高级版还将高级决策分析领域经常使用的理论期权分析和软件结合 在一起,使您的决策更加合理,使风险和收益控制在比较合理的范围之内。同时,高级版带有 Decisioneering 公司编写的教材和培训 CD,为您更好的学习高级版本。
软件安装要求
Microsoft Office 2000或以上 Microsoft Windows 2000,2002 (XP),NT或以上
优秀的售后支持 科理 公司-Crystal Ball 软件中国区独立代表
免费技术支持- 购买任何 Decisioneering 公司产品的用户在其购买后的 30 天内, Decisioneering Help Desk 均为其提供免费技术支持。另外,相关论文,模型样本,FAQ, 产品技术性能规格书以及资源中心的情况您都可以在我们的网站上进行了解。同时,我 们的技术人员都通过专业的培训,能够为您通过电话、传真、电子邮件提供服务 。
crystal ball使用指导
crystal ball使用指导Crystal Ball使用指导Crystal Ball是一种常用的预测和决策支持工具,它基于蒙特卡洛仿真技术,可以对不确定性进行建模和分析。
下面将介绍一些使用Crystal Ball的指导,帮助您更好地利用这一工具进行预测和决策。
一、数据准备在使用Crystal Ball之前,首先要准备好相应的数据。
这些数据可以是历史数据、统计数据或者是专家意见。
确保数据的准确性和完整性非常重要,因为这些数据将直接影响到Crystal Ball的分析结果。
二、建立模型在Crystal Ball中,模型是指对问题进行描述和建模的过程。
模型的建立需要根据具体问题的特点来确定。
首先需要确定决策变量和随机变量,然后建立它们之间的关系。
在建立模型时,要保证模型的可靠性和合理性。
三、运行仿真在完成模型建立后,就可以进行仿真运行了。
Crystal Ball使用蒙特卡洛仿真技术,通过随机抽样来模拟不同可能的情况。
这样可以得到一系列可能的结果,并对其进行统计分析。
四、分析结果Crystal Ball提供了多种统计分析方法,可以帮助用户对仿真结果进行分析和解释。
常用的分析方法包括概率分布分析、敏感性分析和决策树分析等。
通过这些分析,可以得到关键决策变量的概率分布、敏感性程度以及最优决策方案等信息。
五、结果解释和应用在分析结果之后,需要对结果进行解释和应用。
Crystal Ball提供了可视化工具,可以将分析结果以图表的形式展示出来,帮助用户更好地理解和应用结果。
同时,还可以通过对结果的解释和讨论,对决策方案进行优化和调整。
六、风险管理Crystal Ball除了用于预测和决策支持,还可以用于风险管理。
通过对不确定性的建模和分析,可以帮助用户识别和评估潜在的风险,并采取相应的措施进行风险管理和控制。
七、案例分析以下是一个使用Crystal Ball进行预测和决策的案例分析。
假设某公司要决定是否投资于某个新项目。
布控球英文说明书
布控球英文说明书Ball Surveillance System User ManualIntroduction:The Ball Surveillance System is a state-of-the-artdevice that allows for remote monitoring and surveillance. This user manual is designed to provide you with detailed instructions on how to set up and use the systemeffectively.1. System Components:The Ball Surveillance System consists of the following components:- Surveillance Ball: This is the main device that captures video and audio footage.- Control Panel: Used to control and configure the surveillance ball remotely.- Mobile Application: Allows users to access livefootage and control the system using a smartphone or tablet.2. System Setup:To set up the Ball Surveillance System, follow these steps:Step 1: Unbox the surveillance ball and control panel.Step 2: Connect the surveillance ball to a power source using the provided power adapter.Step 3: Connect the control panel to the surveillance ball using the provided cable.Step 4: Install the mobile application on your smartphone or tablet.Step 5: Connect the mobile application to the surveillance ball using the provided instructions.Step 6: Configure the system settings, such as Wi-Fi network connection and motion detection sensitivity.3. System Operation:To operate the Ball Surveillance System, follow these steps:Step 1: Launch the mobile application and log in using your credentials.Step 2: From the application's main screen, you can view live footage from the surveillance ball.Step 3: Use the control panel or mobile application to pan, tilt, or zoom the surveillance ball, providing a wider view of the area.Step 4: Enable motion detection to receive alerts whenever motion is detected within the camera's field of view.Step 5: Record and save video footage directly to your smartphone or tablet for later review.Step 6: Customize additional settings, such as audio recording and night vision mode, to enhance surveillance capabilities.4. Troubleshooting:If you encounter any issues or difficulties while using the Ball Surveillance System, refer to the following troubleshooting steps:- Ensure the surveillance ball and control panel are properly connected and powered on.- Check the Wi-Fi or network connection to ensure a stable and reliable connection.- Restart the surveillance ball, control panel, or mobile application if necessary.- Update the firmware of the surveillance ball and control panel to the latest version.- Contact customer support for further assistance if the issue persists.Ball Surveillance System 用户手册简介:Ball Surveillance System 是一款先进的远程监控系统设备。
Crystal.Ball.v7.3.1水晶球_风险分析工具Crystal
Crystal.Ball.v7.3.1⽔晶球_风险分析⼯具Crystal Ball Ansoft.Maxwell.V12.1 电磁场分析软件Micromine v11.0.0.7-ISO 1CDVMGThermo 4.3MPCCI v3.0.6,abaqus6.7,flunt6.3.26Oracle Assistant 2.0 for ProIntralink 8.0 & 3.4-ISO\ILOG_CPLEX_V9.0\FLOW2000 V6.2LIGHTTOOL 6.0Synopsys Hsimplus vA 2008.03 SP1 WinALL 1CD(⾼性能的晶体管级仿真器MSC.Patran.v2006.R2Bentley.HAMMER.08.11.00.30(V8i) ⽔锤和瞬态分析Gedco Omni 3D Design V8 0COADE.CAESAR.II.V5.1CADKEY 21.5Aquaveo.WMS.v8.2.1;ArcView.GIS.v3.3TomoVision SliceOmatic v4.2 R9C(扫描数据医学痕量分析的软件)AVS Express 6.3 (三维可视化系统)IMAGiS v2.3 (适普三维GIS软件):Simufact forming v8.1 SP1Reflexw v5.0.rarBentley AutoPLANT 2004 Edition 中⽂版 1CD(三维⼯⼚设计软件)optiFDTD, optiBPM, optifiber, optigrating共四个软件LAB 8.5(英⽂版),LabVIEW Professional DevSystem, Windows, Includes 1Aspen Hysys v7.1 1CDMVTec HALCON v9.0.1 1CDthermoflow 13.0COPRA教程Silvaco AMS 2008.09 1CD1、Landmark.OpenWorks.V2003.12⼀套;2、Petrel.v2009.12⼀套PSASP7.0Apollo Photonic Solutions Suite 2.2ESI Sysweld 2007 User's Guides 1DVDBitplane.Imaris.v6.3.1 1CDGEMCOM.Surpac.V6.1.2ILOG CPLEX 9.0StairDesigner.v6.04.Multilangual 1CD(楼梯设计系统)〓〓〓〓〓〓〓〓〓〓〓〓〓〓〓〓〓〓〓〓〓〓〓〓〓〓〓〓〓〓〓〓〓〓〓〓〓〓〓〓◎◎◎◎◎◎◎◎◎◎◎◎◎◎◎◎◎◎◎◎◎◎◎◎◎◎◎◎◎◎◎◎◎◎◎◎◎◎◎◎ 北极星软件有限公司是⼀家软件、软件等产品的经销批发的私营独资企业。
- 1、下载文档前请自行甄别文档内容的完整性,平台不提供额外的编辑、内容补充、找答案等附加服务。
- 2、"仅部分预览"的文档,不可在线预览部分如存在完整性等问题,可反馈申请退款(可完整预览的文档不适用该条件!)。
- 3、如文档侵犯您的权益,请联系客服反馈,我们会尽快为您处理(人工客服工作时间:9:00-18:30)。
风险管理软件CrystalBall操作指南(英文版)(doc 16页)Monte-Carlo Simulation with Crystal Ball®To run a simulation using Crystal Ball®:1. Setup SpreadsheetBuild a spreadsheet that will calculate the performance measure (e.g., profit) in terms of the inputs (random or not). For random inputs, just enter any number.2. Define Assumptions—i.e., random variablesDefine which cells are random, and what distribution they should follow.3. Define Forecast—i.e., output or performance measureDefine which cell(s) you are interested in forecasting (typically the performance measure, e.g., profit).4. Choose Number of TrialsSelect the number of trials. If you would later like to generate the Sensitivity Analysis chart, choose “Sensitivity Analysis” under Options in Run Preferences.5. Run SimulationRun the simulation. If you would like to change parameters and re-run the simulation, you should “reset” the simulation (click on the “Reset Simulation” button on the toolbar or in the Run menu) first.6. View ResultsThe forecast window showing the results of the simulation appears automatically after (or during) the simulation. Many different results are available (frequency chart, cumulative chart, statistics, percentiles, sensitivity analysis, and trend chart). The results can be copied into the worksheet.Crystal Ball Toolbar:Define Define Run Start Reset Forecast Trend Assumptions Forecast Preferences Simulation Simulation Window ChartWalton Bookstore Simulation with Crystal Ball®Recall the Walton Bookstore example: It is August, and they must decide how many of next year’s nature calendars to order. Each calendar costs the bookstore $7.50 and is sold for $10. After February, all unsold calendars are returned to the publisher for a refund of $2.50 per calendar. Suppose Walton predicts demand will be somewhere between 100 and 300 (discrete uniform).Demand = d ~ Uniform[100, 300]Order Quantity = Q (decision variable)Revenue = $10 * Min(Q, d)Cost = $7.50 * QRefund = $2.50 * Max(Q–d, 0)Profit = Revenue – Cost + RefundStep #1 (Setup Spreadsheet)1 2 3 4 5 6 7 8 9 10 11 12 13 14 15 16 17A B C D E F Simulation of Walton's BookstoreD ataU ni t C ost =$7.50U ni t P rice =$10.00U ni t R ef und =$2.50D emand D is tribution (Uniform)M inim um =100M axi mum =300D ecis ion VariableOrder Quantity =200SimulationD em and R evenue C ost R efund P rof i t200$2,000.00$1,500.00$0.00$500.0015 16 17B C D E F SimulationD em and R evenue C ost R efund P rofi t 200=C5*M IN(C13,B17)=C4*C13=C6*M A X(C13-B17,0)=C17-D17+E17Walton Bookstore Simulation with Crystal Ball ®Step #2 (Define Assumptions —i.e., random variables)—color code (blue):1617B D emand 200and click on the “Define Assumptions” button in toolbar (or in the Cell menu):Select type of distribution:Provide parameters of distributions:8910B CD emand Distribution (U niform)M inim um =100M axi mum =300Walton Bookstore Simulation with Crystal Ball ®Step #3 (Define Forecast —i.e., output)1617F P rof i t$500.00click on the “Define Forecast” button in toolbar (or in the Cell menu),and fill in the Define Forecast dialogue box.Step #4 (Choose Number of Trials)Click on the “Run Preferences” button in toolbar (or in the Run menu):and select the number of trials to run.Walton Bookstore Simulation with Crystal Ball ®Step #5 (Run Simulation)Click on the “Start Simulation” button in toolbar (or Run in the Run menu):Step #6 (View Results)The results of the simulation can be viewed in a variety of different ways (frequency chart, cumulative chart, statistics, and percentiles). Choose different options under the View menu in the forecast window.The results can be copied into a worksheet or Word document (choose Copy under the Edit menu in the simulation output window.Using Trend Charts to Find the Impact of Order Quantityon Potential ProfitDefine several forecast cells (G14:G18) for several possible order quantities (Q=100, 150, 200, 250, 300). Use the same random order quantity for each to compare them more equally (i.e., one assumption cell for demand—C14—with the rest set equal to C14).1 2 3 4 5 6 7 8 9 10 11 12 13 14 15 16 17 18A B C D E F G Simulation of Walton's BookstoreD ataU ni t C ost =$7.50U ni t P rice =$10.00U ni t R ef und =$2.50D emand D is tribution (Uniform)M inim um =100M axim um =300SimulationOrder Quantity D em and R evenue C ost R efund P rof it 100200$1,000.00$750.00$0.00$250.00150200$1,500.00$1,125.00$0.00$375.00200200$2,000.00$1,500.00$0.00$500.00250200$2,000.00$1,875.00$125.00$250.00300200$2,000.00$2,250.00$250.00$0.0012 13 14 15 16 17 18B C D E F G SimulationOrder Quantity D em and R evenue C ost R efund P rofi t 100200=$C$5*M IN(B14,C14)=$C$4*B14=$C$6*M AX(B14-C14,0)=D14-E14+F14 150=$C$14=$C$5*M IN(B15,C15)=$C$4*B15=$C$6*M AX(B15-C15,0)=D15-E15+F15 200=$C$14=$C$5*M IN(B16,C16)=$C$4*B16=$C$6*M AX(B16-C16,0)=D16-E16+F16 250=$C$14=$C$5*M IN(B17,C17)=$C$4*B17=$C$6*M AX(B17-C17,0)=D17-E17+F17 300=$C$14=$C$5*M IN(B18,C18)=$C$4*B18=$C$6*M AX(B18-C18,0)=D18-E18+F18After running the simulation, choose “Open Trend Chart” in the Run menu. This chart gives “certainty bands” for the forecast cells. 10% of the time, the project duration will fall within the inner band (light blue), 25% of the time within the 2nd band (red), 50% of the time within the third band (green), and 90% of the time within the outside band (dark blue).Project Management—Global OilGlobal Oil is planning to move their credit card operation to Des Moines, Iowa from their home office in Dallas. The move involves many different divisions within the company. Real estate must select one of three available office sites. Personnel has to determine which employees from Dallas will move, how many new employees to hire, and who will train them. The systems group and treasurer’s office must organize the new operating procedure and make financial arrangements. The architects will have to design the interior space, and oversee needed structural improvements. Each site is an existing building with sufficient open space, but office partitions, computer facilities, furnishings, and so on, must all be provided.A complicating factor is that there is an interdependence of activities. In other words, some parts of the project cannot be started until other parts are completed. For example, Global cannot construct the interior of an office before it has been designed. Neither can it hire new employees until it has determined its personnel requirements.The necessary activities and their necessary predecessors (due to interdependence) are listed below. Three estimates are made for the completion time of each activity—the minimum time, most likely time, and maximum time.Immediate Time Estimates (days)Minimum Most Likely Maximum Activity Description PredecessorA Select Office Site —21 21 21B Create Org. & Fin. Plan —20 25 30C Determine Personnel Req. B 15 20 30D Design Facility A, C 20 28 42E Construct Facility D 40 48 66F Select Personnel to Move C 12 12 12G Hire New Employees F 20 25 32H Move Key Employees F 28 28 28 I Train New PersonnelE, G, H1015 24ABCDFGHIEStartEndGlobal Oil Simulation with Crystal Ball®Step #1 (Setup Spreadsheet)1 2 3 4 5 6 7 8 9 10 11 12 13 14 15A B C D E F G H I J Global Oil Relocation ProjectActivity Tim e (Triangular)Im m edi ate M ost Start Activity Finish Activity D escri ption P redecessors M inim um Likely M axi mum Tim e Tim e Tim eA Sel ect Site-21212102121B C reate Org. & Fin. P lan-20253002525C D eterm ine P ersonnel Req.B152030252045D D esign Facil ity A, C202842452873E C onstruct Facility D4048667348121F Sel ect Personnel to M ove C121212451257G H ire New Em ployees F202532572582H M ove Key E mployees F282828572885I Train N ew P ersonnel E, G, H10152412115136P roject C om pleti on Tim e =136.003456789101112131415H I JStart Activity FinishTim e Tim e Tim e021=H5+I5025=H6+I6=J620=H7+I7=M A X(J5,J7)28=H8+I8=J848=H9+I9=J712=H10+I10=J1025=H11+I11=J1028=H12+I12=M A X(J9,J11,J12)15=H13+I13P roject C ompleti on Tim e ==J13Step #2 (Define Assumptions—i.e., random variables)Each of the random activity times (B, C, D, E, G, and I) is assumed to follow the triangular distribution.Global Oil Simulation with Crystal Ball®Step #3 (Define Forecast—i.e., output)Cell J15 is the forecast cell:15G H I J Project Completion Time =136.00Step #4 (Choose Number of Trials)500 trials were run. In addition, Sensitivity Analysis was enabled in the Options of the Run Preferences dialogue box. This allows for the generation of sensitivity analysis results later.Step #5 (Run Simulation)Step #6 (View Results)Additional Results Available with Crystal Ball®Slide the triangles below the histograms to determine the probability that the output (project duration) is less than a certain value (e.g., a deadline), greater than a certain value, or between any two values (by sliding both triangles).Alternatively, you can type in values for the lower bound or upper bound to determine the probability. You can also type in a probability (in “Certainty”), and it will determine the range that has that probability.There is a 79% chance the project will be completed within 150 days.There is a 2.4% chance that the project will take more than 160 days.Sensitivity ChartChoose “Open Sensitivity Chart” in the Run menu. Note that this chart is only availableif you selected the “Sensitivity Analysis” option under Run Preferences. This chartgives an indication as to which random variables (activity times) have the greatest impact on the output cell (project completion time).Variability in activity E has the greatest impact on overall project duration, followed by activity D, C, I, and B. Variability in activity G has almost no impact.Fitting a DistributionCrystal Ball can be used to “fit” a distribution to data.The following data has been collected for the previous 100 phone calls to a mail-order house:1 2 3 4 5 6 7 8 9 10 11 12 13 14 15 16 17 18 19 99 100 101 102 103 104A B C D E F G H I Phone DataArrival Interarrival Length of Call Interarrival Length of Call Cus tomer #(minutes)Time(minutes)Time(minutes)18.228.22 3.77Averages 2.004 4.51212.25 4.03 4.53312.270.02 4.04416.26 3.98 3.70Simulation24518.06 1.81 5.38618.870.81 4.36723.46 4.58 4.41823.530.08 5.14928.73 5.20 4.761030.56 1.83 4.681132.36 1.80 5.061236.90 4.54 5.751343.30 6.40 4.061443.880.57 3.251545.17 1.29 3.5795194.020.28 4.2696195.48 1.46 3.3797195.870.38 4.4598196.840.98 5.0699197.810.97 5.20100200.43 2.61 4.25345G H IInterarrival Length of CallTime(minutes)Averages=AVERAGE(D5:D104)=AVERAGE(E5:E104)(80 rows have been hidden)Fitting Data to a DistributionUsing Crystal Ball® to fit data to a distribution1. Select a spreadsheet cell.2. Choose Define Assumption.3. Click the Fit button, then select the source of the fitted data.4. Click the Next button, then select the distributions to try to fit.5. Click OK.Interarrival TimeService Time。