福建厦门市社会经济发展统计年鉴指标数据:2018年城镇非私营单位从业人员工资统计
福建统计年鉴2020:3-19 按登记注册类型分城镇非私营单位在岗职工含劳务派遣人员平均工资(1978-2019)

28802 35550 41231
合计
Total
107.6 115.2 101.7 107.0
108.1 111.4
115 117.4 106.1
124.6 115.3 114.1
111.9 114.9 125.2 140.5 119.8 114.1 113.1 112.9 111.2 111.5 113.5 110.8 107.5
124.3 115.3 113.9
109.4 113.7 123.2 142.6 115.8 114.1 115.3 113.9 113.6 113.2 119.2 112.9 109.5 112.6 112.8 114.5 117.1 118.2 112.8
111.6 116.5 115.2
101.9 115.7 103.9 108.5
3217 3649 4420 5763 7305 8076 8636 8999 9587 10422 11028 11987 12719 13745 14947 16880 19443 22205 24556
32647 38989 44979
41689 48587 55957
27234 34527 39774
1742
2009
2288
730 813 912 1027 1097
1342
1499
1704
1742 1855 1498 1571
2100
2532
2674
2420 2780 3480 4890 5857 6683 7559 8531 9490 10584 12013 13306 14310 15603 17146 19318 22283 25702 28666
福建统计年鉴2020:3-16 按产业分城镇非私营单位女性从业人员数(年底数)(2003-2019)
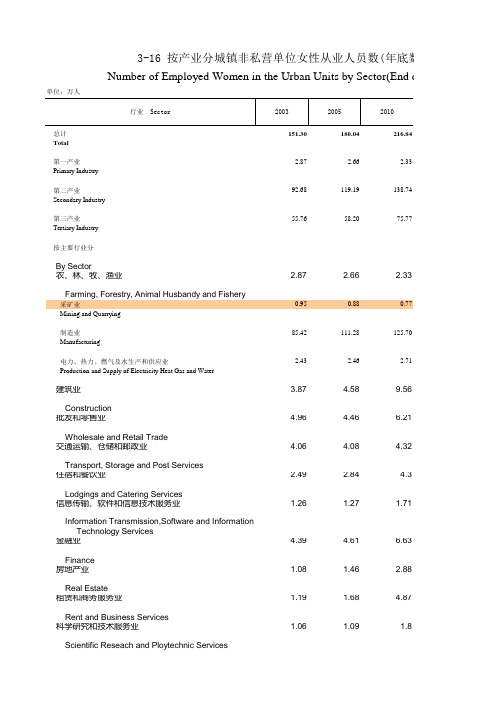
By Sector农、林、牧、渔业 2.87 2.66 2.33 Farming, Forestry, Animal Husbandy and Fishery采矿业0.950.880.77 Mining and Quarrying制造业85.42111.28125.70 Manufacturing电力、热力、燃气及水生产和供应业 2.43 2.46 2.71 Production and Supply of Electricity Heat Gas and Water建筑业 3.87 4.589.56 Construction批发和零售业 4.96 4.46 6.21 Wholesale and Retail Trade交通运输、仓储和邮政业 4.06 4.08 4.32 Transport, Storage and Post Services住宿和餐饮业 2.49 2.84 4.3 Lodgings and Catering Services信息传输、软件和信息技术服务业 1.26 1.27 1.71 Information Transmission,Software and InformationTechnology Services金融业 4.39 4.61 6.63 Finance房地产业 1.08 1.46 2.88 Real Estate租赁和商务服务业 1.19 1.68 4.87 Rent and Business Services科学研究和技术服务业 1.06 1.09 1.8 Scientific Reseach and Ploytechnic Services水利、环境和公共设施管理业 1.3 1.44 1.7 Water Conservancy, Environment and PublicFacilitiesManagement居民服务、修理和其他服务业0.570.460.44Resident Services, Repair and Others教育19.3419.7522.42Education卫生和社会工作 6.457.079.6Health Care and Social Work文化、体育和娱乐业 1.24 1.28 1.5Culture, Sports and Entertainment公共管理、社会保障和社会组织 6.38 6.727.4 Public Management, Social Ensure and SocialOrganizations1.10.430.290.24 101.3679.033.08 2.99 28.5324.76 14.9712.785.89 5.766.15 5.24 4.67 3.97 11.4614.54 6.54 6.62 6.05 6.63 2.18 2.292.31 2.93 2.07 2.26 32.2738.72 15.9817.82 1.99 15.2916.76。
连云港市统计年鉴社会经济发展指标数据:2018年城镇非私营单位在岗职工平均工资统计
灌云县
65630
53359 81388 80914
127104 50578 44576 65444 46566 35773 52694 21222 73282 113441 43400 33810 84330 49114 96377 92023 69077 79781 76219
灌南县
57594
51389 75171 82308
95000
47245 53312 47997 46794 57890 45739 39333 93884 66662 42247 50888 29597 76448 86289 74807 79833 81134
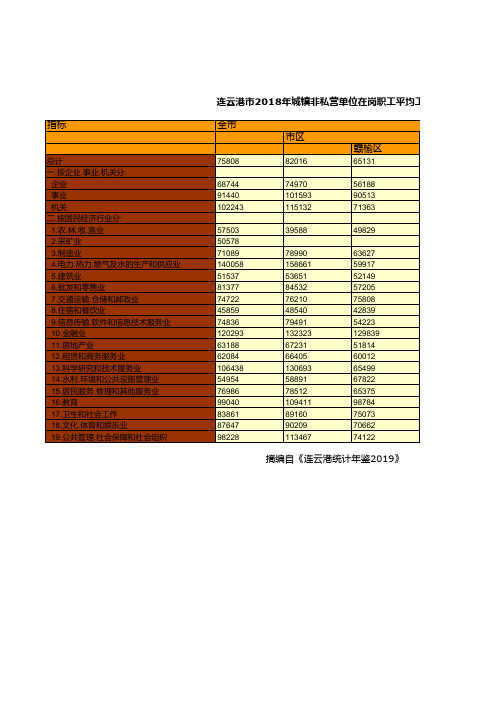
连云港市2018年城镇非私营单位在岗职工平均工资统计
全市
75808
市区
82016
赣榆区
65131
68744 91440 102243
74970 101593 115132
56188பைடு நூலகம்90513 71363
57503 50578 71089 140058 51537 81377 74722 45859 74836 120293 63188 62084 106438 54954 76986 99040 83861 87647 98228
39588
49829
78990 158661 53651 84532 76210 48540 79491 132323 67231 66405 130693 58891 78512 109411 89160 90209 113467
63627 59917 52149 57205 75808 42839 54223 129839 51814 60012 65499 67822 65375 98784 75073 70662 74122
2014年城镇非私营单位就业人员年平均工资56339元

2014年城镇非私营单位就业人员年平均工资56339元2014年城镇非私营单位就业人员年平均工资56339元来源:国家统计局发布时间:2015-05-27 15:00 2014年全国城镇非私营单位就业人员年平均工资为56339元,与2013年的51483元相比,增加了4856元,同比名义增长9.4%,增幅回落0.7个百分点。
其中,在岗职工年平均工资57346元,同比名义增长9.5%,增幅回落0.6个百分点。
扣除物价因素,2014年全国城镇非私营单位就业人员年平均工资实际增长7.1%。
分四大区域看,2014年城镇非私营单位就业人员年平均工资由高到低排列是东部、西部、中部和东北,分别为64239元、51204元、46828元和46512元;同比名义增长率从高到低依次为东部9.7%、中部9.4%、西部9.0%和东北7.1%。
表1:2014年城镇非私营单位分地区就业人员年平均工资分行业门类看,年平均工资最高的三个行业分别是金融业108273元,是全国平均水平的1.92倍;信息传输、软件和信息技术服务业100797元,是全国平均水平的1.79倍;科学研究和技术服务业82220元,是全国平均水平的1.46倍。
年平均工资最低的三个行业分别是农、林、牧、渔业28356元,是全国平均水平的50%;住宿和餐饮业37264元,是全国平均水平的66%;水利、环境和公共设施管理业39198元,是全国平均水平的70%。
最高与最低行业平均工资之比是3.82,与2013年的3.86相比,差距有所缩小。
表2:2014年城镇非私营单位就业人员分行业年平均工资1.20倍;第三位是国有单位,为57296元,是全国平均水平的1.02倍。
年平均工资最低的为其他内资单位,为42224元,是全国平均水平的75%。
表3:2014年城镇非私营单位分登记注册类型就业人员年平均工资附注:1.指标解释(1)单位就业人员:指在各类法人单位工作,并由单位支付劳动报酬的人员,包括在岗职工和其他就业人员。
厦门市统计年鉴2020:2019年城镇非私营单位从业人员统计
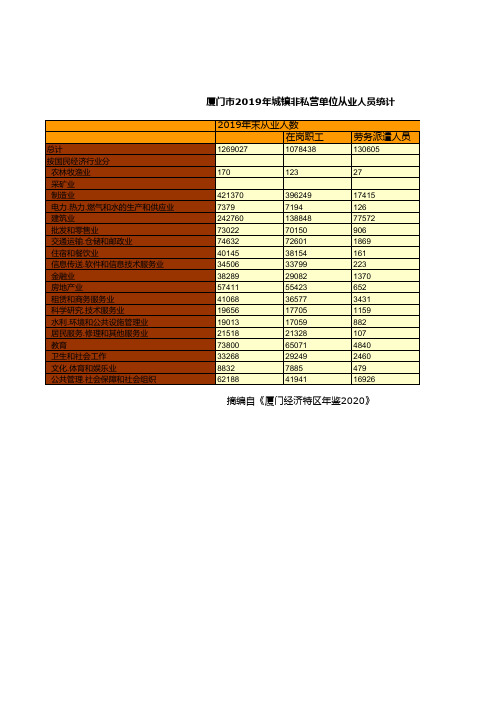
单位:人
总计 按国民经济行业分
农林牧渔业 采矿业 制造业 电力.热力.燃气和水的生产和供应业 建筑业 批发和零售业 交通运输.仓储和邮政业 住宿和餐饮业 信息传送.软件和信息技术服务业 金融业 房地产业 租赁和商务服务业 科学研究.技术服务业 水利.环境和公共设施管理业 居民服务.修理和其他服务业 教育 卫生和社会工作 文化.体育和娱乐业 公共管理.社会保障和社会组织
摘编自《厦门经济特区年鉴2020》
员统计 》
女性
其他从业人员
59984
20
7706 59 26340 1966 162 1830 484 7837 1336 1060 792 1072 83 3889 1559 468 3321
498262
57
180945 2335 32959 40610 19359 21772 12612 20600 22907 14759 5398 8051 15784 50355 23284 4113 22362
396249 7194 138848 70150 72601 38154 33799 29082 55423 36577 17705 17059 21328 65071 29249 7885 41941
17415 126 77572 906 1869 161 223 1370 652 3431 1159 882 107 4840 2460 479 16926
厦门市2019年城镇27
1078438
劳务派遣人员
130605
170
123
27
421370 7379 242760 73022 74632 40145 34506 38289 57411 41068 19656 19013 21518 73800 33268 8832 62188
R语言课程设计--BP神经网络预测财政收入
摘要随着社会的不断发展,经济制度在不断建立与完善,财政工作不仅面临着机遇,而且也面临着重大的挑战。
这主要体现在:一方面国家宏观经济调控需要财政职能的履行,另一方面,当下经济发展迅速,目前的一些财政工作已经难以再满足其发展需求。
因此,政府更加期望通过财政工作的预见性来辅助相关财政政策的制定实施,因此,财政收入预测是当前社会一个迫切需要的研究课题。
本文选取了1999年到2013年的财政数据,包括财政收入表和四种税收表,数据主要来源于广州市统计局的统计年鉴与泰迪智能科技有限公司。
本文旨在分析财政收入的影响因素及预测情况。
在研究财政收入影响因素之前,首先分析了四种税收的主要影响因素,因为税收在财政收入中所占比重很大,并且税收与地方财政收入政策的制定息息相关,因此本文细化了税收因素的分析,主要运用SAS软件,通过典型相关分析模型分别找到了影响四种税收的主要因素,另外也分别找出了影响全市税收的主要区域。
税收的细分研究,看似与文章脱节,实际上为广州市制定相应税收的政策都提供了一定的理论依据。
接着进行了本文的研究重点,即关于财政收入的预测,首先运用SAS软件通过主成分分析,成功将财政收入的17个指标降维,筛选出10个主要影响财政收入的指标。
最后,运用MATLAB 软件,通过BP神经网络[5]进行了预测,得到了2014与2015年的财政收入的预测值,并且与真实值对比,发现预测结果与真实值并不是相差很大。
本文成功的建立了财政收入的预测模型,为广州市制定相应的财政政策都提供了一定的理论依据。
关键词:财政预测典型相关主成分分析 BP神经网络AbstractWith the continuous development of the society, the economic system is constantly established and perfected, and financial work is not only faced with opportunities, but also faces major challenges. This is mainly reflected in: on the one hand, the national macroeconomic control needs the financial function of the implementation, on the other hand, the current rapid economic development, some of the current financial work has been difficult to meet their development needs. Therefore, the government is more hope that through the financial work of the foresight to assist the formulation and implementation of the relevant fiscal policy, therefore, the fiscal revenue forecast is an urgent need for the current research topic.This paper chooses the fiscal data from 1999 to 2013, including the fiscal revenue statement and four tax forms. The data mainly come from the Statistical Yearbook of Guangzhou Municipal Bureau of Statistics and Teddy Intelligent Technology Co., Ltd. This paper aims to analyze the influencing factors and forecasting of fiscal revenue. Before studying the influencing factors of fiscal revenue, the paper first analyzes the main influencing factors of the four kinds of taxes, because the tax revenue is very large in the fiscal revenue, and the tax is closely related to the formulation of the local fiscal revenue policy. Therefore, this paper elaborates the tax factor Analysis, the main use of SAS software, through the typical correlation analysis model were found to affect the four main factors of taxation, respectively, also found the main areas of the city's tax revenue. Tax segmentation research, seemingly out of line with the article, in fact, for the development of the corresponding tax policy in Guangzhou City have provided a certain theoretical basis. Then we focus on the research of this paper, that is, the forecast of fiscal revenue, the first use of SAS software through the principal component analysis, the success of the 17 indicators of fiscal revenue dimensionality, screening out 10 major factors affecting the main revenue. Finally, using MATLAB software, BP neural network is used to predict, and the forecast value of fiscal revenue in 2014 and 2015 is obtained. Compared with the real value, it is found that the predicted result is not very different from the real value. This paper has successfully established the forecasting model of fiscal revenue, which provides a theoretical basis for the formulation of the corresponding fiscal policy in Guangzhou.Key words: financial forecasting typical correlation principal component analysis BP neural network目录摘要 (I)Abstract (II)目录 (1)§1绪论 (2)1.1研究背景及意义 (2)1.2研究问题概述 (3)1.3研究思路和行文框架 (3)§2税收的相关分析 (5)2.1数据的准备 (5)2.2数据预处理 (5)2.4税收相关关系的求解与结果分析 (10)2.5本章总结 (17)§3财政收入的主要因素分析 (18)3.1数据准备 (18)3.2主成分分析模型的建立 (18)3.3财政收入主要因素的求解与结果分析 (19)3.3本章总结 (22)§4 BP神经网络预测财政收入 (23)4.1数据准备 (23)4.2 BP神经网络模型建立 (23)4.3财政收入预测的求解与结果分析 (26)4.4本章总结 (29)§5研究结论 (30)参考文献 (31)致谢 (32)§1绪论1.1研究背景及意义财政收入体现了一个国家财力及经济发展状况。
福建厦门市社会经济发展统计年鉴指标数据:2018年土地面积统计

2017年末
1700.61 84.00 73.98 274.3 186.82 669.36 412.15 1700.61 188.76 174.16 492.35 11.47 436.71 133.00 222.78 41.38 364.08 440 381.97 102.98 31.42 24.65 89.04 9.65 56.60 9.35 40.39 17.89
单位:平方公里
厦门市2018年土地面积统计
全市土地面积 思明区 湖里区 集美区 海沧区 同安区 翔安区
土地利用现状 耕地 园地 林地 草地 城镇村及工矿用地 交通运输用地 水域及水利设施用地 其他土地
城市建成区面积 城市规划建设用地面积 城市现状建设用地面积
居住用地 公共管理与公共服务设施用地 商业服务业设施用地 工业用地 物流仓储用地 道路与交通设施用地 公用设施用地 绿地与广场用地 已供未建用地
摘编自《厦门经济特区年鉴2019》
2018年末
1700.61 84.00 73.98 274.3 186.82 669.36 412.15 1700.பைடு நூலகம்1 187.65 173.61 492.18 11.35 437.93 134.68 221.94 41.27 389.48 440.00 389.47 103.67 33.02 24.67 89.44 9.65 57.66 9.40 40.39 21.59
中国统计年鉴2019全国各省市区社会经济发展指标:就业基本情况
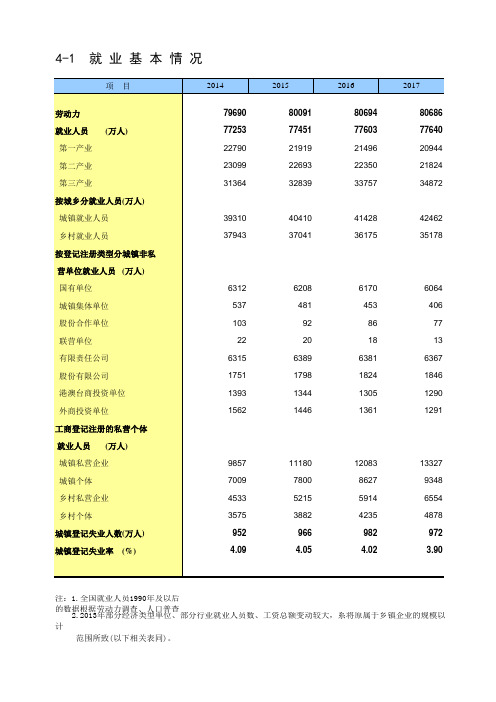
2018
80567 77586 20258 21390 35938
43419 34167
5740 347 66 12
6555 1875 1153 1212
13952 10440
7424 5597
974 3.80
返回 目录
工资总额变动较大,系将原属于乡镇企业的规模以上法人单位纳入劳动工资统
4-1 就 业 基 就业人员 (万人)
第一产业 第二产业 第三产业 按城乡分就业人员(万人) 城镇就业人员 乡村就业人员 按登记注册类型分城镇非私 营单位就业人员 (万人) 国有单位 城镇集体单位 股份合作单位 联营单位 有限责任公司 股份有限公司 港澳台商投资单位 外商投资单位 工商登记注册的私营个体 就业人员 (万人) 城镇私营企业 城镇个体 乡村私营企业 乡村个体 城镇登记失业人数(万人) 城镇登记失业率 (%)
6389 1798 1344 1446
11180 7800 5215 3882 966 4.05
2016
80694 77603 21496 22350 33757
41428 36175
6170 453 86 18
6381 1824 1305 1361
12083 8627 5914 4235 982 4.02
79690 77253 22790 23099 31364
39310 37943
6312 537 103 22
6315 1751 1393 1562
9857 7009 4533 3575
952 4.09
2015
80091 77451 21919 22693 32839
40410 37041
- 1、下载文档前请自行甄别文档内容的完整性,平台不提供额外的编辑、内容补充、找答案等附加服务。
- 2、"仅部分预览"的文档,不可在线预览部分如存在完整性等问题,可反馈申请退款(可完整预览的文档不适用该条件!)。
- 3、如文档侵犯您的权益,请联系客服反馈,我们会尽快为您处理(人工客服工作时间:9:00-18:30)。
总计 按国民经济行业分
农林牧渔业 采矿业 制造业 电力.热力.燃气和水的生产和供应业 建筑业 批发和零售业 交通运输.仓储和邮政业 住宿和餐饮业 信息传送.软件和信息技术服务业 金融业 房地产业 租赁和商务服务业 科学研究.技术服务业 水利.环境和公共设施管理业 居民服务.修理和其他服务业 教育 卫生和社会工作 文化.体育和娱乐业 公共管理.社会保障和社会组织
摘编自
80861 98059 77268 119787 55504 91619 101696 50626 129725 176054 83291 73596 109206 72279 63892 139837 181178 107826 175338
8职51工66(含劳务)
82975 109429 76269 120519 54898 93235 101923 52800 130572 212369 83551 78078 110726 73293 64000 143190 182177 112162 178897