History, Institutions and Economic Performance The Legacy of Colonial Land Tenure Systems in India
介绍瑞士人文历史经济政治的书,英文版

介绍瑞士人文历史经济政治的书,英文版以下是一些关于瑞士人文历史、经济和政治的英文书籍的推荐:1.“Swiss Watching: Inside the Land of Milk and Money“ byDiccon Beweso This book provides an insightful and entertaining look into the unique aspects of Swiss culture, history, politics, andeconomics.2.“The Swiss: A Cultural Guide“ by Philip Manselo This book explores the history, traditions, and cultural peculiarities of Switzerland, offering a comprehensiveoverview of Swiss society.3.“The Swiss Confederation: A History“ by Clive H. Churchand Randolph C. Heado This book delves into the historical development ofSwitzerland, including its formation as a confederation,political structure, and significant events throughout itshistory.4.“The Swiss Economy: A Case Study of WesternSwitzerland“ by Andrea Bonoldi and Giovanni Ferro-Luzzio This book examines the Swiss economy, with a particular focus on the economic characteristics and development ofthe western region of Switzerland. It covers topics such asindustry, finance, and international trade.5.“Swiss Politics for Complete Beginners“ by Sean Muellero This book provides a beginner’s guide to understanding Swiss politics, explaining the political system, keyinstitutions, and the functioning of democracy inSwitzerland.Please note that availability may vary depending on your location and the specific edition of the books. You can search for these titles on online bookstores or check with your local libraries or bookshops for more information.。
国际经贸高级英语精读1--3课课文翻译
Starting as low-income economies in the 1960s, a few economies in East Asia managed,in a few decades, to bridge all or nearly all of the income gap that separated them from the high-income economies of the Organisation for Economic Co-operation and Development (OECD).Meanwhile many other developing economies stagnated .What made the difference?One way to grow is by developing hitherto unexploited land.Another is to accumulate physical capital:roads, factories, telephone networks.A third is to expand the labor force and increase its education and training.But Hong Kong (China) and Singapore had almost no land.They did invest heavily in physical capital and in educating their populations,but so did many other economies.During the 1960s through the 1980s the Soviet Union accumulated more capital as a share of its gross domestic product (GDP) than did Hong Kong (China), the Republic of Korea, Singapore, or Taiwan (China).And it increased the education of its population in no trivial measure. Yet the Soviets generated far smaller increases in living standards during that period than did these four East Asian economies.Perhaps the difference was that the East Asian economies did not build, work, and grow harder so much as they built, worked, and gr ew smarter.Could knowledge, then, have been behind East Asia’s surge ?If so, the implications are enormous,for that would mean that knowledge is the key to development—that knowledge is development.How important was knowledge for East Asia’s growt h spurt ?This turned out not to be an easy question to answer.The many varieties of knowledge combine with its limited marketability to present a formidable challenge to anyone seeking to evaluate the effect of knowledge on economic growth.How, after all, does one put a price tag on and add up the various types of knowledge?What common denominator lets us sum the knowledge that firms use in their production processes; the knowledge that policymaking institutions use to formulate, monitor, and evaluate policies; the knowledge that people use in their economic transactions and social interactions?What is the contribution of books and journals, of R&D spending, of the stock of information and communications equipment, of the learning and know-how of scientists, engineers, and students? Compound ing the difficulty is the fact that many types of knowledge are accumulated and exchanged almost exclusively within networks, traditional groups, and professional associations.That makes it virtually impossible to put a value on such knowledge.Reflecting these difficulties in quantify ing knowledge,efforts to evaluate the aggregate impact of knowledge on growth have often proceeded indirectly, by postulat ing that knowledge explains the part of growth that cannot be explained by the accumulation of tangible and identifiable factors, such as labor or capital.The growth not accounted for by these factors of production—the residual in the calculation—is attributed to growth in their productivity, that is, using the other factors smarter, through knowledge.This residual is sometimes called the Solow residual, after the economist Robert M. Solow,who spearheaded the approach in the 1950s,and what it purports to measure is conventionally called total factor productivity (TFP) growth.Some also call the Solow residual a measure of our ignorance ,because it represents what we cannot account for. Indeed, we must be careful not to attribute all of TFP growth to knowledge,or there may be other factors lurking in the Solow residual.Many other things do contribute to growth—institutions are an example—but are not reflected in the contributions of the more measurable factors.Their effect is (so far) inextricably woven into TFP growth.In early TFP analyses,physical capital was modeled as the only country-specific factor that could be accumulated to better people’s lives.Technical progress and other intangible factors were said to be universal, equally available to all people in all countries,and thus could not explain growth differencesbetween countries.Their contributions to growth were lumped with the TFP growth numbers.Although this assumption was convenient, it quickly became obvious that physical capital was not the only factor whose accumulation drove economic growth. A study that analyzed variations in growth rates across a large number of countries showed that the accumulation of physical capital explained less than 30 percent of those variations.The rest—70 percent or more—was attributed directly or indirectly to the intangible factors that make up TFP growth (Table 1.1).Later attempts introduced human capital to better explain the causes of economic growth.A higher level of education in the population means that more people can learn to use better technology. Education was surely a key ingredient in the success of four of the fastest-growing East Asian economies: Hong Kong (China), the Republic of Korea, Singapore, and Taiwan (China). Before their transformation from developing into industrializing economies, their school enrollment rates had been much higher than those of other developing countries (Table 1.2).They had also emphasized advanced scientific and technical studies—as measured by their higher ratios of students in technical fields than in even some industrial countries—thus enhancing their capacity to import sophisticated technologies.Moreover, the importance of education for economic growth had long been recognized and established empirically .One study had found that growth in years of schooling explained about 25 percent of the increase in GDP per capita in the United States between 1929 and 1982.Adding education reduced the part of growth that could not be explained,thus shrinking the haystack in which TFP growth (and knowledge) remained hidden.Some analysts even concluded, perhaps too quickly,that physical and human capital, properly accounted for, explained all or virtually all of the East Asian economies’ rapid growth,leaving knowledge as a separate factor out of the picture.One re ason these analysts came up with low values for TFP growth is that they incorporated improvements in labor and equipment into their measurement of factor accumulation.So even their evidence of low TFP growth in East Asia does not refute the importance of closing knowledge gaps.Indeed, it shows that the fast-growing East Asian economies had a successful strategy to close knowledge gaps:by investing in the knowledge embodi ed in physical capital, and by investing in people and institutions to enhance the capability to absorb and use knowledge.Looking beyond East Asia,other growth accounting studies have examined larger samples of countries.Even when human capital is accounted for,the unexplained part of growth remains high.One such study, of 98 countries with an unweighted average growth rate of output per worker of 2.24 percent,found that 34 percent (0.76 percentage point) of that growth came from physical capital accumulation,20 percent (0.45 percentage point) from human capital accumulation,and as much as 46 percent (just over 1 percentage point) from TFP growth.Even more remains to be explained in variations in growth rates across countries. The same study found the combined role of human and physical capital to be as low as 9 percent, leaving the TFP residual at a staggering 91 percent.To take another example:Korea and Ghana had similarly low incomes per capita in the 1950s,but by 1991 Korea’s income per capita was more than seven times Ghana’s.Much of that gap remains unexplained even when human capital is taken into account .All these results are subject to measurement problems.For example, the measured stock of human capital may overstate the actual quantity used in producing goods and services.High rates of school enrollment or attainment (years completed) may not translate into higher rates of economic growthif the quality of education is poor, or if educated people are not employed at their potential because of distortion s in the labor market.Moreover, it is now evident that education without openness to innovation and knowledge will notlead to economic development.The people of the former Soviet Union, like the people of the OECD countries and East Asia, were highly educated, with nearly 100 percent literacy .And for an educated population it is possible,through foreign direct investment and other means,to acquire and use information about the latest production and management innovations in other countries.But the Soviet Union placed severe restrictions on foreign investment, foreign collaboration, and innovation.Its work force did not adapt and change as new information became available elsewhere in the world, and consequently its economy suffered a decline.(excerpted from World Development Report 1998/1999)一些东亚国家在20世纪60年代还是低收入国家,但是在短短的几十年之间,他们成功地弥补了其与经济合作与发展组织(OECD)中高收入国家之间的差距;与此同时,也有许多发展中国家的经济停滞不前。
《全球产业转移》英文版

Global Shifts1Barry EichengreenUniversity of California, BerkeleyApril 2011Shifts happen. We are currently witnessing a major shift in the balance of economic, financial and political power from the advanced countries to emerging markets – from West to East, or from the West to the Rest. This is, of course, not the first time that we have observed this kind of global shift. The rise of the West from the 15th century and its concomitant, the decline of China, was itself an earlier instance, if mirror image, of this kind of shift. (See Figure 1.) The industrial revolution, which gave rise to what is sometimes called “The Great Divergence” (the growing divergence in manufacturing capability and in capacity to project power between the first countries to industrialize, principally in Europe, and other regions) marked another global shift. It is no coincidence that the first industrial nation, Great Britain, came to control fully a quarter of the world’s population and land mass by the end of the 19th century.2 There was the shift in economic power from the pioneer industrializer, Britain, to followers like Germany that contributed to the economic and geopolitical tensions helping to set the stage for World War I. There is Charles Kindleberger’s thesis that that Great Depression of the 1930s was a consequence of the global shift in power from Britain to the United States, one that left an exhausted Britain incapable of managing the world economy and an inexperienced United States unwilling to do so.3 There is the shift after World War II toward the two great superpowers, the United States and the Soviet Union, and the dominance of the U.S. over the Western world (Figure 2). There is then the relative decline of the United States owing to catch-up growth, first in Europe, next in Japan, and finally in East Asia and elsewhere, which gradually closed the per-capita-income gap. The current shift toward emerging markets like China and India (Figures 3 and 4) is usefully seen in this light.This paper examines these earlier shifts in economic and political power and asks what light they shed on the implications of today’s global shift. I inquire into the sources of the shift, describe the tensions to which it gave rise, and ask how those tensions were managed. The answer to this last question, in two words, is “not well.” Global shifts have almost always fanned economic conflict, created problems for economic management, and heightened diplomatic tensions. Sometimes they have erupted into military conflict. While the same need not be true this time, there is reason to worry that the current global shift is a source of economic and political risks. It is past due time to start thinking about both the nature of those risks and mechanisms for managing them.The causes and consequences of changes in economic fortune, both relative and absolute, probably constitute the central question of all of economic history, if not all of economics. One paper can do justice to neither the topic nor the literature. Rather than attempting to be comprehensive, I focus on a number of specific cases, those mentioned in the opening paragraph. While this requires me to touch on aspects of nearly a millennium of human history, my focus is mainly on the last two centuries, the period since the establishment of the Bank of Finland, the1 Prepared for the Bank of Finland’s 200th anniversary symposium, Helsinki, May 5-6, 2011.2 And to “rule the waves.”3 As originally advanced in Kindleberger (1973).event providing the occasion for this symposium. Coverage of these episodes is also necessarily selective and designed to highlight the themes sounded above.1.The Rise of the WestEconomic historians are unanimously of the view that Ming China was the leading economic power in 1400. No other country constructed the equivalent of the Great Wall or the Grand Canal. No other state or empire had a standing army with a million troops. China was known for its technological prowess and precocity – for its mastery of gunpower, printing, paper-making, and compasses. It was known for the long-distance commercial voyages of the great admiral Zheng He whicht served commercial purposes (many of his ships had private cabins for merchants) and also sought to extract tribute from other lands bordering the Indian Ocean.Two factors then combined to set on foot a global shift. First, the Ming Dynasty turned inward. Zheng He’s fleet was dismantled. Limits were placed on the size of newly-constructed ships. By the end of the 15th century, subjects of the Chinese empire were forbidden to construct ocean-going ships or to leave the country. The overland route west, the Silk Road, was all but closed to traffic. The Chinese met early European incursions by limiting contact to a handful of treaty ports.Why the Mings turned inward is disputed. One view is that curtailing contact with the outside world was a low-cost way of dealing with piracy and the Uighurs. Another is that from the middle of the 15th century the Mings had bigger problems close at hand, like their border dispute with what is modern-day Vietnam. Still another is that this was the ill-advised decision of a clutch of conservative officials concerned about the impact on China of foreign influence.But there is little disputing the consequences. China’s inward turn created space for other powers. Lack of contact with foreign ideas, the absence of foreign competition, and the smothering effects of tradition set China up for a long period of economic stagnation.The coincident factor was improved Western sailing, navigation and military technology. The key innovation was the caravel, a sailing ship developed by the Portuguese and then the Spanish that combined lateen (triangular) rigging, making it very maneuverable and able to sail up rivers, with square sails that made it very fast and able to cross oceans. Lateen sails came from the Arab lands, square ones from Northern Europe; the Iberians were strategically placed between the two influences. New navigational techniques developed by Arab, Indian and Jewish astronomers but systematized by the Portuguese allowed European ships to go anywhere. Finally, the Portuguese were quicker than others to adapt the use of canon to ocean-going vessels.Why Portugal, one might ask? As with the Internet, public-sector R&D played a role. Prince Henry the Navigator of Portugal founded a maritime academy that fostered many of these innovations. He established an observatory at Sagres to construct accurate tables on the sun’s declination.4The early voyages down the west coast of Africa were sponsored by the4From 1500 or so there was a growing accumulation of navigational data in a variety of countries (Spain, France, England), all of which saw the publication of practical pamphlets and guides on the subject.Portuguese crown (just as Columbus’ pioneering trans-Atlantic voyage was underwritten by Ferdinand and Isabella of Spain). The result was the Age of Exploration (sometimes referred, in less politically-correct terms, as the Age of Discovery), in which the Portuguese and Spanish found their way around Cape Horn to Asia and then across the Atlantic to the Americas.5While the Portuguese had a head start, the Spanish had a larger economy. The two quickly came into conflict over trading posts, trade rights, and other commercial prerogatives. There was an effort to divide the spoils – to create separate spheres of influence not unlike the Western and Soviet blocs during the Cold War or the possibility, sometimes mooted today, of Chinese and U.S. spheres of influence in Asia and the West. The first such effort, the Treaty of Tordesillas signed by Spain and Portugal in 1494, divided the newly discovered territories of Africa and the Western Hemisphere. The dividing line ran north-south along a meridian roughly down the middle of the Atlantic before bisecting what became modern-day Brazil. This was followed in 1524 by the Treaty of Zaragoza, which similarly divided Asia and the Pacific along a north-south meridian running roughly through the middles of Japan and Australia.6An unintended consequence of this spheres-of-influence strategy may be to permit the regional hegemon to grow fat and lazy. So it is said of Spain and Portugal following the conclusion of the two treaties.7This made room for hungry upstarts: England and theNetherlands. The Iberians were followed into the Indian Ocean by first the Dutch and then the English: the Dutch ended up controlling trading rights with much of modern-day Indonesia, the English with India. In the Western Hemisphere the Iberians were flanked to the north by the Dutch and, more importantly, English and French, who built their commercial empires on the basis of shipping and finance but in addition had manufactures (woolens) to export.The upstarts also relied on strong institutions – national champions that enjoyed public-sector support. In 1602 the Dutch States General established the world’s first joint-stockcompany, the Dutch East India Company, granting it not just a monopoly of trade with Asia but also the power to establish fortified trading posts, negotiate treaties, and wage defensive wars.8 The company established a centralized hub in Batavia (now Jakarta), organized nearly 5,000 voyages, and paid its shareholders an annual dividend approaching 20 per cent for twocenturies.9 5 Why Europe, more generally, one might ask? Was the Renaissance conducive to the systematization ofknowledge? Did the Black Death, by raising land-labor ratios, create surplus agricultural production that could be traded and higher living standards? These questions presumably deserve more than a footnote. At virtually the same time Queen Elizabeth granted a royal charter to the (English) East Asia Company, which like its Dutch competitor acquired monopoly rights and, eventually, a 6 The prod for this treaty was the conflict between the two countries over Malacca and the surrounding “spice islands” (the source of the region’s valuable spices). Portugal arrived first, establishing a fort at Malacca in 1511. Spain then arrived in the Moluccas from the east in 1521 as part of Magellan’s famous attempt to circumnavigate the globe, and Charles V sent another expedition to colonize the islands. There followed a year of fighting between the two countries. In 1524 the two kingdoms agreed to resolve the issue by drawing another meridian that would divide the world into two equal-sized hemispheres. To get it right, each crown appointed three astronomers, three pilots, and three mathematicians. 7 See Kindleberger (1994) and Landes (1998). 8 This, recall, was the age of mercantilism, when states sought to monopolize the trade of a region so as to generate monopoly profits which could then be used to strengthen the state’s finances and its ability to wage war. 9 Now there’s a risk premium for you.modern board of directors.10 Using Surat in India as a transit point between the Spice Islands and Europe, the East Asia Company was responsible for Britain establishing its foothold in India. These two trading concerns, as joint-stock companies and public-private partnerships, were important institutional innovations. They were the agents of the power shift from Southern to Northern Europe and of Europe’s growing influence and control over much of Southern Asia.This situation – two aspirants infringing on the turf of two established powers, and the Europeans all seeking to establish exclusive access to the minerals, precious metals, and high-value crop-lands of other regions (spice- and sugar-growing land in particular) – was a recipe for conflict among the imperialists and between the Europeans and the indigenous peoples with whom they made contact.11 In addition to nimble sailing ships and canon, the Europeans had on their side metallurgy (which furnished them with efficient swords and daggers) and infectious disease (which desimated previously isolated indigenous populations). In turn the imperialists were weakened by almost continuous internecine conflict. The rising Northern European powers fought for space and influence with both their Iberian predecessors and one another. When the English arrived in the Bandas and Moluccas, islands where cloves and nutmeg were grown, the Dutch drove them out by force.12 The Dutch fought with Sultan Agung, who headed a powerful state in central Java, over the establishment of Batang. They took Ceylon from Portugal along with most of that country’s Indian forts and trading stations. Similar stories could be told about the Western Hemisphere. Cooperation would have meant more surplus for the Europeans and indigenous peoples alike. But it was not to be.The Dutch and English, having come into conflict over foreign policy and commercial interests (it is not clear that there was a clear separation between the two matters in this period), skirmished in Europe as well. The Dutch also attracted the enmity of France, which sided with England in its mid-17th century conflict with the United Provinces and then used import tariffs to protect its infant sugar and cloth industries from Dutch competition.13 In the 18th century the French and English clashed over control of North America in the French and Indian Wars.14 Military means were used repeatedly to bolster trade and create mercantilist preserves free of foreign competition. One worries that it could happen again.2.The Great DivergenceThe industrial revolution transformed the world economy by launching per capita incomes on a sustained upward path unlike anything seen previously. It also constituted a global shift par excellence. It widened the gap in economic and military capabilities between European countries whose ambitions had been restrained by a fragile balance of power. It also transformed the conduct of warfare. Within Europe, Germany’s comparative advantage in the production of steel and, by implication, the construction of railways gave it a decisive advantage over France in the Franco-Prussian War of 1870-71. In the colonies, the invention of the Gatling gun, another10 A Royal African Company was later formed to take charge of trade in slaves, ivory and gold in Africa.11 The scramble for scarce resources and associated possibility for conflict will resonate, presumably, with Chinese officials concerned about their country’s dependence on imported raw materials.12 Helped importantly by their native allies.13 This, from the mid-17th century, being the age of high mercantilism.14 Leading to the Seven Years’ War in Europe and indirectly, it is often said, to the French Revolutionary Wars.byproduct of the industrial revolution, gave the Europeans a powerful advantage in their effort to secure colonial control of additional portions of Africa and Asia.15Thus, it is no coincidence that the industrial revolution was followed by the new imperialism of the second half of the 19th century: by the partition of Africa by the European powers and their further colonial expansion into Asia. Crude Marxian accounts sometimes explain this new wave of colonialism and imperialism as a function of the voracious appetite of 19th century industrial economies for raw materials and the desire of governments to secure exclusive access to the same.16 But modern economic histories cast doubt on the notion that empire paid: any benefits to the imperialists, including those associated with favored access to raw materials, were swamped by military and other costs.17What industrialization did was greatly enhance the ability of industrial nations to project power and control other lands.18 With the railway and the steamship (practical for ocean-going voyages in the second half of the 19th century, not incidentally coincident with the new imperialism), it became possible to deploy military force more quickly. Machined canonry (now breech rather than muzzle loaded) and rifles (notably the caplock rifled musket) were for the 19th century what steel swords and daggers had been for the 16th and 17th. These innovations were decisive, for example, in the First Opium War of 1839-42.19 With the Great Divergence in per capita incomes, it became possible for the industrial powers to raise larger and better equipped standing armies. European control of the interior of Africa or India might have been paper thin, but it would have been unimaginable in the absence of industrialization. Like 21st century Europeans who prefer to take part of their higher living standards in the form of increased leisure time, their 19th century predecessors sought to take a part in the form of colonial conquest.This desire was a source of frustration to countries late to the great global game, Germany in particular. With the growth of its industry, and its comparative advantage in military-relevant heavy industry in particular, Germany became as capable as any European power at mobilizing and projecting force. But the process of industrialization reached critical mass later than in Britain or France.20 German unification had to wait for Bismarck to incorporate the southern states. Thus, by the time Germany emerged as an industrial and military power of the first rank, the process of colonial partition was largely complete.Germany therefore had to content itself with a few remaining scraps in West Africa, East Africa and the Pacific. It pushed against French and Spanish control in North Africa, precipitating the First Moroccan Crisis in 1905 by insisting that France adopt an open door policy for its protectorate, to little avail. It was left to advance its expansionist aims in and around Europe, notably attempting to expand its influence over the declining Ottoman Empire by completing the Berlin-Baghdad Railway, something that in turn became a geopolitical15 The descendant of the hand-cranked Gatling gun was the automatic Maxim gun, invented in 1884.16 An interpretation that has obvious implications for China’s actions in Africa and elsewhere in the developing world. There is also the more sophisticated variant of the hypothesis due to Eric Williams (Williams (1966).17 For the balance sheet see Davis and Huttenback (1986).18 David Landes in his 1998 book and earlier writings makes this argument most forcefully.19 See for example Hacker (1977).20 The classic account being Clapham (1936).flashpoint.21 Some accounts describe Germany’s ambitions in terms of the need of an industrial economy to secure a reliable supply of energy and raw materials (oil in the case of the Ottoman Empire), something that will resonate with observers of China today. Most, however, understand it more in terms of naked imperial ambition.22 Be this as it may, the result was the tensions and tangled alliances that set the stage for World War I.Finance was enlisted not just in the construction of the Berlin-Baghdad Railway but more widely in the effort to advance geopolitical goals. Then like now, that influence might be more subtle than overt. Modern observers alarmed by the rise of sovereign wealth funds wonder whether those funds’ governmental masters are encouraging them to invest in ways that are geopolitically expedient as well as economically remunerative. Before World War I, they saw governments, like those of France and Germany, encouraging private lending to Czarist Russia or the Ottoman Sultan with the goal of alliance building. Hints were dropped that the government would take it as a favor if an investment bank underwrote bond issues on behalf of such borrowers on favorable terms.23 Sometimes governments might intervene directly to encourage or halt issuance on behalf of foreign governments. Between 1897 and 1901, for example, the French government intervened with the Crédit Lyonnais, discouraging it from issuing bonds on behalf of the Russian government until the Russian and French general staffs had agreed on the particular strategic railways to whose construction the proceeds would be put.Employing finance for military and strategic purposes meant that it was not always allocated in ways that maximized returns. The fact that the French and German governments regularly intervened in the operations of the Paris and Berlin markets, whereas the British government employed a more hands-off attitude, helps to explain why the rate of return on French and German lending was generally lower than comparable returns on British overseas investment.24 While financial might creates strategic opportunities for governments, in other words, exploiting those opportunities also has costs.25With governments intervening in private financial affairs before the fact, they also felt some compulsion to come to the aid of the bondholders if and when things went wrong. Gunboats might then be dispatched to collect payments from defaulting debtors. Just how But while Mitchener and Weidenmier (2005) argue for the importance of these “supersanctions,” they identify just 6 episodes of direct military intervention out of 43 default episodes spanning the 19th century. Other authors argue that when governments intervened militarily in response to default, they were in fact using financial events as a pretext for intervention desired on other grounds. They suggest that other mechanisms – ex ante monitoring by investment banks with reputations to protect and ex post exclusion from the bond market by a cohesive cartel of issuers – were more important for enforcing contracts.2621 See Jastrow (1917).22 Something to which today’s China, which prefers to keep a relatively low-key profile internationally, has not obviously fallen prey.23 For accounts of the practice see Feis (1930).24 This point is argued and documented in Fishlow (1986).25 Something for the managers of sovereign wealth funds to bear in mind.26 See inter alia Mauro, Sussman and Yafeh (2006) and Flandreau and Flores (2007).3. The Rise of the United StatesThe other global shift at this time was the rise of the United States. From an economic speck at the outset of the 19th century, the U.S. by 1914 had grown into the world’s largest economy and leading exporter. But while economic change was rapid, political adjustments lagged behind. The North American colonies had been settled by Europeans who had sought to distance themselves from the Old World. George Washington in his farewell address had emphasized the desirability of “as little political connection as possible” with foreign nations (while at the same time acknowledging the value of “extending” commercial relations).Isolationist instincts, in other words, ran deep. Even the Monroe Doctrine, which warned the European powers against attempting to advance their colonial ambitions in the country’s Latin American backyard, can be interpreted in isolationist terms: it promised as a quid pro quo that the U.S. would not participate in wars among the European powers. The notable exception was U.S. occupation of the Philippines resulting from the Spanish-American War. That the precipitating event that led the U.S. to disregard its long-standing tradition of non-interventionism was an incident on an island, Cuba, a scant 90 miles from the rising power’s shores is perhaps worth recalling (Taiwan being only 81 miles from the Chinese mainland).27 In defeating the Spanish, the U.S. in fact took control not just of the Philippines but also Guam and Puerto Rico. Whether this was a momentary fall from grace or an emerging economic power for the first time displaying geopolitical ambitions is disputed.28But there is no question that the U.S. was, by this time, seeking to more actively assert its economic interests. Before long it was seeking to alter the structure of international markets so that they worked to its advantage (or at least didn’t disadvantage it to the same extent). A long-standing bone of contention was that the trade credit required by U.S. exporters and importers was almost entirely denominated in sterling and sourced in London. This put U.S. producers and merchants at a competitive disadvantage; not only did they have to pay two commissions, one to their local bank and the other to its London correspondent, but they also bore the exchange risk. One of several rationales that combined in 1913 to cause the establishment of the FederalReserve System (overcoming another deep-seated American aversion, this one to concentrated financial power) was the desire to create a market in securitized trade credits (“tradeacceptances”) denominated in dollars and sourced domestically.29Almost immediately the Fed took steps to develop this market, passing the necessaryregulations while discounting acceptances and purchasing them outright. As a result of this initiative (and as a byproduct of disruptions to the London market caused by World War I), in a scant ten years the acceptance market in New York matched its rival in London in both size and liquidity.30 27 Cuba not having achieved independence in the second decade of the 19th century, it was effectively exempted from the Monroe Doctrine. The dollar became as a true international currency; by the mid-1920s central banks 28 On the first view, see Bemis (1962); proponents of the second include Kennedy (1987), Mead (1987) and Nye (1990). 29 As emphasized by Broz (1997). 30 The relevant document is provided by Eichengreen and Flandreau (2010).around the world held as large a fraction of the foreign exchange reserves in dollars as in sterling.31The U.S. competed with Britain throughout the 1920s in seeking to bring more countries into its financial orbit. As governments prepared to return to the gold standard, the Fed, in the person of Benjamin Strong, influential governor of the Federal Reserve Bank of New York, encouraged them to contract stabilization loans in New York rather than London.32 Receiving a stabilization loan was the first step in establishing ongoing relations with a financial center. But while he governor himself may have been strongly internationalist in orientation, the U.S. otherwise reverted to its previous stance of quasi-isolationism following the war. The Congress famously refused to approve President Wilson’s request to join the League of Nations. Not wishing to become entangled in the reparations dispute, the U.S. did not join the Bank for International Settlements in 1930 (although it did provide finance for its early operation). The country’s diplomats did little to slow the progress of German rearmament or otherwise to do anything to prevent the war clouds from gathering over Europe.U.S. tariff policy was inappropriate for what was now the world’s leading trading nation, a country with an interest in the maintenance of an open trading system that should have led by example. Here the greater villain was probably the Fordney-McCumber Tariff of 1922 rather than the Smoot-Hawley Tariff of 1930, but neither helped.33 The mistake was to allow trade policy to be politicized. Herbert Hoover ran for the presidency in 1928 on a platform that promised to raise tariffs on imports of farm products, agricultural prices having been depressed for much of the decade. Once the tariff bill got to the Congress, there was nothing to prevent members from adding all manner of protection for manufactures so as to build as wide a coalition as possible.34Yet to say that the United States disregarded the case for international economic cooperation would not be accurate. The Fed famously kept interest rates low in order to encourage capital to flow toward Britain and aid that country’s efforts to return to gold in 1924-5. It made a credit line available to the Bank of England.35 It hosted a meeting of central bankers on Long Island in 1927, where other countries holding sterling as reserves committed not to taking gold from the British. In the summer of 1931, with the spread of the financial crisis, President Hoover offered a moratorium on inter-allied war debt payments in order to facilitate a moratorium on German reparations.31 This from a starting point in 1914 where the dollar accounted for a negligible proportion of global reserves (Eichengreen and Flandreau 2009). Elsewhere I have suggested what the U.S. accomplished in ten years – moving from a point where its currency played no international role to one where it was the leading invoicing, investment and reserve currency – may also be possible for China (Eichengreen 2011).32 Chandler (1958) and Clarke (1967) document his efforts.33 With the U.S. not a member of the League of Nations, the League’s efforts to negotiate a tariff truce in the 1920s were to little avail.34 See Schattschneider (1935). The Fordney-McCumber Tariff had similarly been intended to raised depressed farm-gate prices but had also been expanded to provide protection for manufactures by the time it was passed by the Congress. When efforts turned to rolling back tariffs in the 1930s, a change in institutions, in the form of the Reciprocal Trade Agreements Act, made a substantial difference.35 One that, in the event, was not drawn.。
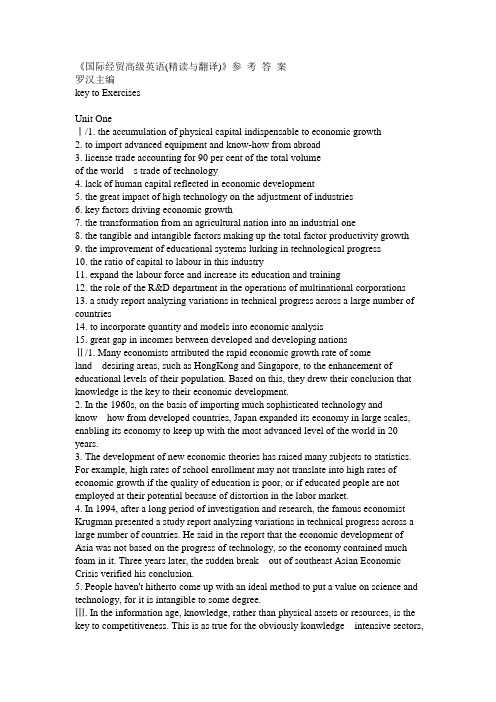
美国各行业平均经济利润率

100 90 80 70
Number 60 of 50
Industries 行业数量 40
30 20 10
0
Average Return on Equity in US Industries, 1982-1993 1982-1993年,美国各行业的平均资本回报率
16.5%
13.8% 11.7%
Eating places 餐饮行业 Drug stores 药店 Petroleum / natural gas 石油/天然气行业
Race track
operation 跑Tru马cking except local 长途货运业 Computer system design 电脑系统设计
Engineering services 工程服务
30%
20% Worthington Inds
Nucor
10%
Steel Technologies Oregon Mills
Commercial Metals
0% Carpenter Birmingham
(10%)
British Steel PLC Cleveland-Cliffs Quanex Lukens
2024/3/31
侃价能力来源
供应商
转移成本 供应商的集中度 供应商的数量 前向一体化/后向一体化的威胁 购买成本占总购买量的比例
要素的差异性 要素替代品的出现 要素成本或差异化的影响 该成本相对于总成本比例
影响竞争的因素: 行业成长性 固定成本/附加价值 产能的非持续性 品牌认同度 信息复杂度
企业利益
Cable TV service 有线电视服务
Motor vehicles 机动车辆运输
制度经济学的参考文献
J.of Econ .History 30.1979
30、Coase,R.,“The Nature of the Firm,”Economic, Nov. 1937,4.
CambridgeUniversityPress,1990
24、Alchian, Armen A.,“Uncertainly, Evolution and Economic Theory ,”Journal of
political Economy,58(June 1950):211-222.
25、Alchian,Armen A., and Harold Demsetz ,“Production, Information Costs, and Economic Organizationg ,”American Economic Review, 62(December 1972);777-95
财经大学出版社1998
5、[美]约色夫.G.斯蒂格利茨《社会主义向何处去—经济体制转型的理论与
证据》吉林人民出版社1998
6、[美]W.E.哈拉尔《新资本主义》社会科学文献出版社1999
7、[美]萨奇、沃尔顿:《新经济史探讨》,1982年版
8、[美]凡勃伦:《有闲阶级论》,商务印书馆,1964年版
9、[美]阿里斯:《奔向合理社会:工业文明的价值》,得克萨斯大学出版社,
1961年
10、[美]格鲁奇:《当代经济思想—新制度经济学派的贡献》,1936
11、张旭昆:《论制度的均衡与演化》,《经济研究》,1993年第9期
英国名校专业简介之——伦敦政治经济学院
英国名校专业简介之——伦敦政治经济学院伦敦政治经济学院(英语:The London School of Economics and Political Science,多简称LSE),位于英国伦敦,成立于1895年,是一所专注于社会科学的大学,为伦敦大学的成员学院之一。
它将自己定位为:“世界领先的社会科学教育及研究机构”。
它对社会学科的专注在伦敦大学和全英国都是独一无二的。
伦敦政治经济学院一直以来与牛津大学、剑桥大学、伦敦帝国学院和伦敦大学学院一起并称为“英国G5大学集团”,它也是英国金三角名校和罗素集团的成员。
《卫报》曾评价伦敦政经学院,称其与伦敦大学学院、帝国理工学院和国王学院“在英国的的名声只有牛剑才能超越。
”伦敦政经学院的校园位于伦敦市的法律中心Holborn,毗邻皇室法庭、英国广播公司和伦敦四大法律学院,其中最著名的林肯法律学院就近在咫尺。
伦敦政经学院教学与研究以社会科学为主,教学质素与研究成就在全球享负盛名。
《星期日泰晤士报》和《卫报》的2006年全英大学排行榜中,伦敦政经学院排名第三,而在2005年11月发表的《泰晤士专上教育增刊》世界大学排行榜中,伦敦政经学院排行第11;2004年12月更获同一机构列为全球排行第二的社会科学类大学。
伦敦政经学院是法律、经济学、国际关系、政治学、哲学、人类学、社会学、社会政策等方面研究的全球先驱。
校友及教员之中包括15名诺贝尔奖得奖者、42名政府或国家元首、29名英国下议院议员及29名上议院议员。
学生国际化是学院的特色之一。
全日制学生约有7500名,其中英国本地生占34%,另外18%来自欧盟成员国,44%来自世界其他120多个国家及地区。
本科生占48%,研究生占52%。
伦敦政治经济学院(英语:The London School of Economics and Political Science,多简称LSE),位于英国伦敦,成立于1895年,是一所专注于社会科学的大学,为伦敦大学的成员学院之一。
国际经贸高级英语
《国际经贸高级英语(精读与翻译)》参考答案罗汉主编key to ExercisesUnit OneⅠ/1. the accumulation of physical capital indispensable to economic growth2. to import advanced equipment and know-how from abroad3. license trade accounting for 90 per cent of the total volumeof the world s trade of technology4. lack of human capital reflected in economic development5. the great impact of high technology on the adjustment of industries6. key factors driving economic growth7. the transformation from an agricultural nation into an industrial one8. the tangible and intangible factors making up the total factor productivity growth9. the improvement of educational systems lurking in technological progress10. the ratio of capital to labour in this industry11. expand the labour force and increase its education and training12. the role of the R&D department in the operations of multinational corporations13. a study report analyzing variations in technical progress across a large number of countries14. to incorporate quantity and models into economic analysis15. great gap in incomes between developed and developing nationsⅡ/1. Many economists attributed the rapid economic growth rate of someland desiring areas, such as HongKong and Singapore, to the enhancement of educational levels of their population. Based on this, they drew their conclusion that knowledge is the key to their economic development.2. In the 1960s, on the basis of importing much sophisticated technology andknow how from developed countries, Japan expanded its e conomy in large scales, enabling its economy to keep up with the most advanced level of the world in 20 years.3. The development of new economic theories has raised many subjects to statistics. For example, high rates of school enrollment may not translate into high rates of economic growth if the quality of education is poor, or if educated people are not employed at their potential because of distortion in the labor market.4. In 1994, after a long period of investigation and research, the famous economist Krugman presented a study report analyzing variations in technical progress across a large number of countries. He said in the report that the economic development of Asia was not based on the progress of technology, so the economy contained much foam in it. Three years later, the sudden break out of southeast Asian Economic Crisis verified his conclusion.5. People haven't hitherto come up with an ideal method to put a value on science and technology, for it is intangible to some degree.Ⅲ. In the information age, knowledge, rather than physical assets or resources, is the key to competitiveness. This is as true for the obviously konwledge intensive sectors,such as software or biotechnology, as it is for industrial age manufacturing companies or utilities.For the knowledge intensive sectors,knowledge which feeds through from research and development to innovative products and processes is the critical element. Butwith industrial age manufacturing companies or utilities, using knowledge aboutcustomers to improve service is what counts.What is new about attitudes to knowledge today is the recognition of the need to harness, manage and use it like any other asset. This raises issues not only of appropriate processes and systems, but also of how to account for knowledge in the balance sheet.In future, the value of intellectual capital will be more widely measured and reported. The measurement and reporting of key performance indicators related to intellectual capital will become a more widespread practice among major organizations, completing the financial accounts.Unit TwoⅠ/1. to crack the FORTUNE Global 5002. a collective enterprise supervised by workers3. be pessimistic about the factory s ability to absorb technology4. the incorporation (mix)of foreign management practices and Chinese nationalism5. a leading guru of Japanese quality control6. to transfer the management concepts to new acquisitions7. the dominant position in China s refrigerator market8. a case study of the management art9. to let shoddy products released to the market in large quantities10. to set the stage for the renovation of the enterprise11. the wholly-owned companies and holding companies under the control of the parent company12. to soak up the laid-offs released from state owned companies13. to sell modern refrigerator making technolog y to the factory14. the state-owned enterprises accounting for the majority of industrial enterprises15. the development of domestic pillar industriesⅡ/1. Although this joint venture has been growing very fast, it still has a long way to go to realize its goal of cracking the Fortune Global 500.2. Haier once tried to place the sample products in sight of the assembly line workers to improve the quality of the products, but now it has outgrown thispractice.3. In the early 1980s, out of every 1000 urban Chinese households, there were only two or three that owned refrigerators. With the enhancement of people's livingstandard, refrigerators have become the first big item in the households buy of many families.4. The company has 70 subsidiaries around the world, one third of which arewholly-owned, with their products sold to 108 countries and areas. In recent years, it has averaged an increase of 50% a year in revenues.5. The rapid development of collective and private enterprises will help to soak up the labour force released from poorly operated state-owned enterprises and to relieve the nation's employment burden.Ⅲ. Many managers feel uncomfortable if not actively involved in accomplishing a given job. This is said to result from a“low tolerance for ambiguity”. The manager desires to know what is happening on a moment by moment basis. A wise manager should know clearly what work must be delegated, and train employees to do it. If after training, an employee is truly unable to perform the work, then replacement should be considered. A manager should avoid reverse delegation.This happens when an employee brings a decision to the manager that the employee should make. An acceptance of reverse delegation can increase the manager'swork load and the employee is encouraged to become more dependent on the boss. Unit ThreeⅠ/1. to issue a vast amount of short term government bonds2. plenty of capital inflow to the security market in the recent period3. the preference of investors to the inflation protected treasury bonds4. to decrease the risk by hedging5. diversified portfolio6. to reach more than 50% of the initial public offering7. dilution of securities caused by the distribution of shares8. the trigger event that causes the imploding on market index9. short maturity U.S. government and corporate fixed income secu r ities10. real assets like commodities and real estate11. to avoid insider-trading charges through legal windows12. some trigger events that will charge the interest rate in the capital market13. reflect investors' wary view of the market14. shepherd the funds every step of the way15. the agriculture bonds that come back in the stock marketⅡ/1. During the past several months, the interest rate and the exchange rate have fluctuated greatly, which has brought enormous loss to many investors. But this institution overrode the adverse factors in the market and still obtained a big profit by wise hedging investments.2. The diversification of portfolio can decrease the non-systematic riskof individual securities in the portfolio efficiently, but it is unable to remove the systematic risk of the market.3. During the period of high inflation in capitalist countries between the late 1960s and late 1970s, many people tended to convert their money incomes into goods or real estate.4. One of the Bundesbank council members said that the central bank is under no immediate pressure to cut interest rates and that it needs more time to study the economic data before making a decision.5. Many experts consider that the interest rates would trend higher, because, although it is true that there is not much inflation now, wage inflation is evidentand the entire economy is in such high gear right now.Ⅲ. For all the similarities between the 1929 and 1987 stock market crashes, there are one or two vital differences. The most important of these was the reaction of the financial authorities. In 1929, the US Federal Reserve reacted to the crash by raising interest rates, effectively clamping down on credit. This caused manyotherwise healthy companies to fail simply due to cash flow problems. If onecompany failed leaving debts, many others down the line would meet the same fate. In 1987, the authorities were quick to lower interest rates and to ensure that ample credit was made available to help institutions overcome their difficulties. There were no widespread business failures and, more importantly, the economy did not enter another depression. There was a period of recession(milder than a 1930s-style depression), but this was largely due to a resurgence of inflation. The sharp interest rate cuts, and excessively hasty financial deregulation, pushed inflation higher, which in turn forced governments to reverse earlier interest rate cuts, prompting an economic slow-down.Unit FourⅠ/1. to rely heavily on monetary flexibility to reign in inflation2. to execute tight monetary policy3. to implement fiscal policy in the form of social insurance and national taxes4. to pour into economically expanding regions5. to replace their individual currencies with a single currency6. to bode well for the future of the EMU7. to control government deficits to meet Maastricht conditions8. the overvalued currency as a main barrier to export9. to refrain from dumping surplus goods abroad10. the influence of integrated economy on capital flow11. the balance-of-payments deficit warranting the devaluation policy adopted by the monetary authority12. to eliminate the economic costs associated with holding multiple currencies13. costs that must be taken into account when estimating profits14. to take advantage of the small difference between the central bank's pegged rates and market rates15. to hedge against risks coming from volatile exchange ratesⅡ/1. Ironically, Europe will see an increase in economic specialization along with the European unification process.2. The European Central Bank will face a dilemma when two member countries both badly need certain monetary policies to regulate their economies but the policies they need are of opposite directions.3. A person will be called an“arbitrageur"if, to gain profits, he takes advantage of the different exchange rates on different markets, or at different times on a same market.4. The national economies of many European countries have recently been forced to fit Maastricht conditions and arbitrary deadlines, and such actions have created unnecessary economic turmoils.5. As a central bank, the Federal Reserve System currently uses its control over the money supply to keep the national inflation rates low and to expand national economies in recession.Ⅲ. Even before construction of the euro is complete, governments can point to one notable success. The past year has seen extraordinary turmoil in global financial markets. Rich country stock markets and currencies have not been spared. Yet Europe has been, comparatively speaking, a safe haven, Intra-European movements in exchange rates have been tiny. This is something that the euro-11 governments had committed themselves to, but their success could not have been taken for granted a year ago. The fact is, at a time of unprecedented financial turbulence, theforeign exchange markets regarded the promise to stabilize intra-European exchange rates as credible. Currencies have held steady and interest rates have converged: it augurs well for the transition to the new system.Unit FiveⅠ/1. a major engine of growth in Asian economy2. the structural weakness in South Korea's financial system3. to execute economic policies which adhere to IMF-aid programs4. a sharp decline in the price competitiveness of that country's exports5. the slump in the Japanese stock market6. a more advantageous position than its rivals in terms of price competitiveness7. trade disputes sparked by price distortion8. the financial panic triggered by the devaluation of Japanese yen9. to stabilize the recently turbulent capital flows10. the advantageous position of industrial countries in the world trade system11. the serious welfare losses for all nations resulted from a full scale trade war12. a USD 58 billion bailout which South Korea was forced to seek from the IMF13. the great expenditure caused by huge government institutions14. technology intensive and knowledge intensive products with high competitiveness15. the country's economy which remains mired in recessionⅡ/1. While the Asian economy regained stability, the possibility of devaluation of the HongKong dollar will be an important variable affecting the recurrence of similar economic crises in Asia.2. In order to connect the improvement of price competitiveness brought about bythe currency depreciation to a better balance of payment, internationalcooperation is as essential as are internal reforms.3. The Asian financial crisis owing to the heavily indebted banking systems,excessive government spending and over reliance on foreign loans has damaged the world economy seriously.4. Some Japanese companies began to fall out of their over reliance on loansfrom the banking system, focusing on profits and cutting out wasteful spending.5. Erupted in July 1997, the Asian financial crisis reflected the defectsin the fragile financial systems of Asian countries.Ⅲ. Like death and taxes, international economic crises cannot be avoided. Theywill continue to occur as they have for centuries past. But the alarmingly rapid spread of the 1997 Asian crisis showed these economies' vulnerability to investor skittishness. Unfortunately, there is no international“911" that emerging markets can dial when facing economic collapse. Neither the IMF nor a new global financial architecture will make the world less dangerous. Instead, countries that want toavoid a rerun of the devastating 1997—98 crisis must learn to protect themselves. And liquidity is the key to financial self help. A country that has substantial international liquidity—large foreign currency reserves and a ready source offoreign currency loans—is less likely to be the object of a currency attack. Substantial liquidity also enables a country already under a speculative siege to defend itself better and make more orderly financial adjustments. The challenge is to find ways to increase liquidity at reasonable cost.Unit SixⅠ/1. capital flight depleting a country s foreign exchange reserves2. domestic hyperinflation caused by devaluation3. to adopt expansionary fiscal policy to increase national income4. be faced with the danger of increasingly shrinking aggregate demand5. capital market harassed by liquidity trap6. to rule out the possibility of massive speculative activities7. to drive down domestic prices at the expense of economic stagnation8. the international gold standard system characterized by fixed exchange rates9. the pressure of hot money flow on currencies10. the neoclassical theory centering on the spontaneous adjustments of market11. intelligent policy makers who will use variable means to achieve economic goals12. flexible fiscal and financial policies that can help the economy out of depression13. the different dilemmas that the developing countries and the mature economies are faced with14. to sacrifice full employment to achieve high output rate15. the increased demand for this currency that will lead to the devaluation of another currencyⅡ/1. The economic turmoil in that country made the central bank and the treasury department take each other to task, which reflected the importance of the collaboration of a country s monetary and fiscal policies.2. The government has now slipped into such a dilemma that if it wants toimprove its balance of payment, it will need to lower the exchange rate, but to lower the exchange rate will lead to inflation.3. Although devaluation will magnify exports, it can also lead to the increasing foreign curren cy denominated debt;it can even cause the collapse of people's confidence in the government. Therefore, the government did not dare to adopt the devaluation policy without careful consideration.4. The increase of foreign currency denominated debt is not necessarilythe indispensable cost of economic development. Because, although it may promote economic growth in the short run, it will increase the burden of domestic enterprises and lead to imbalanced balance of payment in the long run.5. Major capitalist countries had been seeing gold standard as a symbol of strong economic power, but they were forced to give it up for good during the Great Depression.Ⅲ. Troubled Asian Economies have turned out to have many policy and institutional weaknesses. But if America or Europe should get into trouble next year or the year after, we can be sure that in retrospect analysts will find equally damning things to say about Western values and institutions. And it is very hard to make the case that Asian policies were any worse in the 1990s than they had been in previous decades, so why did so much go so wrong so recently?The answer is that the world became vulnerable to its current travails not because economic policies had not been reformed, but because they had. Around the worldcountries responded to the very real flaws in post Depression policy regimes bymoving back toward a regime with many of the virtues of pre-Depressionfree-market capitalism. However, in bringing back the virtues of old fashioned capitalism, we also brought back some of its vices, most notably a vulnerability both toinstability and sustained economic slumps.Unit SevenⅠ/1. government reforms compatible with a country's development program2. lay emphasis on the resolution of government involvement3. the state induced transfer of wealth from the rich to the less fortunate4. to finance the development of public sectors5. a sharp decrease in the subsidy expenditure of a welfare state6. to minimize the public expenditure of this country7. the growth rate of gross fixed asset formation8. heavy interest obligations resulting from huge interest payments9. a certain share of shadow economy in the government performance10. to avoid increasing government spending and lowering the economic growth rates11. the benchmark to assess the scope for reducing the size of government12. be of growing importance in government reforms13. to facilitate adjustment to the new economic environment14. the detrimental short-run effects of reforms on some groups15. the protectionist and competitive devaluation policies administered by some industrial countriesⅡ/1. Over the years, opinions about the role of state have been changing, andpolitical institutions have been changing as well, to accommodate the demand for more state involvement in the economy.2. It's generally believed that even if welfare states cut down the hugewelfare expenditures, they can't necessarily solve their serious economic problems such as large budget deficits and hyperinflation.3. The government carried out the expansionary fiscal policy, which resulted inthe increase of budget deficits. To compensate the deficits, it should take certain measures, such as issuing bonds or increasing the money supply.4. Many industrial countries face the dilemma during their reforms between high inflation rates and low unemployment rates, so they must consider all around to minimize the losses.5. Radical reforms must aim at maintaining public sector objectives while reducing spending. In this process, the role of the government will change from the provider to the overseer or the regulator of activities.Ⅲ. Modern societies have accepted the view that governments must play a larger role in the economy and must pursue objectives such as income redistribution andincome maintenance. The clock cannot be set back and, in fact, it should not be. For the majority of citizens, the world is certainly a more welcoming place now than it was a century ago. However, we argue that most of the important social and economic gains can be achieved with a drastically lower level of public spendingthan that which prevails today. Perhaps the level of public spending does not needto be much higher than, say, 30 percent of GDP to achieve most of the importantsocial and economic objectives that justify government intervention. Achievingthis expenditure level would require radical reforms, a well-functioning private market, and an efficient regulatory role for the government.Unit EightⅠ/1. winds of reform in Japan s banking sector2. the amended Bank of Japan Law in line with the global standards for autonomy and transparency3. touch on the paramount goal in the sphere of monetary policies4. charge the central bank with maintaining price stability and nurturing a secure credit system5. generate unnecessary panics in the financial markets6. the execution of monetary policies independent of the bureaucracy7. the institutions in charge of formulating the interest rate policies8. a discount rate at a historical low of 0.5%9. to keep maintaining and nurturing the credit system in accordance with the state policy10. in the spheres of fiscal and monetary policies11. the new economic law entering force this year12. in the context of propelling economic reforms13. to strengthen the government s functions through fiscal policies14. key measures which have won confidence from the market15. the implementation of a merit based promotion systemⅡ/1. It is no overstatement to say that the bad accounts in Japan's banks have accumulated to a very high level.2. The central bank's quasi-bureaucratic status has stymied its normal operations, so many economists call for the enhancement of its autonomy in accordance with the global standards.3. It has been normal for bank shares to march in line with movements in net interest margins, which means bank shares tend to rise as net margins widen and fall as the latter narrow.4. Japan's bank shares are in a different position from their American counterparts: America s bank shares have already risen sharply thanks to the country's full-fledged economic recovery, while Japan's bank shares are still weak as the banks struggle to get to grips with their bad debts.5. Runs on the banks proliferated and a sharp fall in bank loans followed, before the non-performing loans, amounting to 30% of bank assets, were taken over by the state in 1997.Ⅲ. How fast Japan's financial system seems to be reforming. Barely a week goes by without news of another merger between Japan s huge but troubled financial firms. Deregulation is the spur. Three years ago the government announced a “Big Bang"for the country's financial-services industry. This would tear down firewallsthat had largely stopped insurance companies, banks and stockbrokers from competing in each other's patches. It was also meant to put an end to arbitrary, stiflingand often corrupt supervision.The biggest reason for deregulation in this way was that Japan's incestuous,Soviet'style financial system was hopelessly bad at allocating credit around the economy. The massive bad-loan problems that have plagued the country's banks for most of the 1990s are merely one symptom of an even bigger ill. Even so, there was wide spread scepticism that the government would go through with the cure. It deserves some credit, therefore, for largely sticking to its plans.Unit NineⅠ/1. the most commonly used measures of income distribution2. the shift from labour to capital markets3. specialization in production and the dispersion of specialized production processes4. the widening gap between the wages of skilled workers and those of unskilled workers5. new production techniques biased toward skilled labor6. economic inefficiency and distortions retarding growth7. sustainable growth and a viable balance of payments policy8. a broadly based, efficient and easily administered tax system9. reduce disparities in human capital across income groups10. targeted programs consistent with the macroeconomic framework11. constitutional rules on revenue sharing12. to promote equality of opportunities through deregulating economy13. cash compensation in lieu of subsidies14. stimulate the use of public resources and the overall economic growth15. take effective measures to promote employment and equityⅡ/1. Much of the debate about income distribution has centered on wage earnings, which have been identified as an important factor in the overall distribution of incomes. But in Africa and Latin America, unequal ownership of land is a factor that cannot be ignored.2. Globalization has linked the labor, product and capital markets of theeconomies around the world and has indirectly led to specialization in production and the dispersion of specialized production processes to geographically distant locations.3. Although fiscal policies are usually viewed as the principal vehicle for assisting low-income groups and those affected by reform programs, quite a number of countries have adopted specific labor market policies in an effort to influence income distribution.4. Measures governments can take to promote equality of opportunities include deregulating the economy;setting up strong and responsible institutions, including a well functioning judicial system;reducing opportunities for corrupt practices;and providing adequate access to health and education services.5. Another important issue is whether governments should focus on outcomes—such as decreasing the number of people living in poverty, or ensuring that all members of society have equal opportunities.Ⅲ. One theory on wealth distribution indicates that irrational distribution andcorruption are the major reasons for the uneven income level. According to this theory, wealth goes through four stages of distribution—the market, the government, non governmental organizations and unlawful activities, mainly corruption. Usually the first stage of distribution—the market—will result in an uneven spread of resources, which should be redressed by the second distribution stage, the government. In the third stage, the distribution of wealth is realized through contributions and donations made by non governmental organizations. The contributions are given to the poor in the form of charity activities. Thenfollows illegal grabbing of wealth, such as robbery, embezzlement, tax evasion andbribery. Their harm to social equality and stability is enormous and cannot really be measured.Unit TenⅠ/1. to facilitate the establishment of a new form of leadership in today's corporations2. to link a corporation's developing prospective to its present business performance3. companies which forge ahead in the rather changeable world economy4. to encourage domestic enterprises to seek out opportunities to enter foreign markets5. to instill development strategies of new products into employees at all levels6. to consider the promotion in the company the criteria to judge whether one is successful or not。
上海银监办发(2004)118号
中国银监会上海监管局办公室文件上海银监办发〔2004〕118号关于转发银监会办公厅《关于转发外交部(关于执行安理会1532号决议对利比里亚前总统泰勒等实施金融制裁名单的通知)的通知》的通知上海银行,上海市农村信用联社,各信托投资公司、财务公司、租赁公司,上海市各外资银行、外资财务公司:现将中国银行业监督管理委员会办公厅《关于转发外交部(关于执行安理会1532号决议对利比里亚前总统泰勒等实施金融制裁名单的通知)的通知》(银监办通[2004]164号)转发给你们,请结合各自情况采取具体措施,切实执行安理会决议。
附件:关于转发外交部《关于执行安理会1532号决议对利比里亚前总统泰勒等实施金融制裁名单的通知》的通知二OO四年八月三日主题词:金融监督制裁通知内部发送:政策法规处,各监管处,统计信息处。
联系人:田伟联系电话:58881000-5985打字:陈思洁校对:田伟韩文晶(共印83份)中国银监会上海监管局办公室2004年8月4日印发中国银行业监督管理委员会文件银监办通(2004)164号中国银行业监督管理委员会办公厅关于转发外交部《关于执行安理会第1532号决议对利比里亚前总统泰勒等实施金融制裁的通知》的通知各银监局,各政策性银行、国有商业银行、股份制商业银行、国家邮政局邮政储汇局,银监会直接监管的信托投资公司、财务公司、金融租赁公司:现将外交部《关于执行安理会第1532号决议对利比里亚前总统泰勒等实施金融制裁的通知》转发给你们,请根据文件要求,结合本单位情况采取具体措施,切实执行安理会决议。
请各银监局立即将本通知转发到辖区内各城市商业银行、农村商业银行、农村合作银行、外资银行、城乡信用社及信托投资公司、财务公司、金融租赁公司。
请各政策性银行、国有独资商业银行、股份制商业银行、国家邮政储汇局立即将本通知转发至各分支机构。
特此通知。
二OO四年七月二十一日主题词:金融制裁通知抄送:外交部、人民银行办公厅、国家外汇管理局综合司内部发送:国际部、法规部、银行一部、银行二部、银行三部、非银部、合作部联系人:曾智萍联系电话:66194791中国银行业监督管理委员会办公厅二OO四年七二月二十三日印发(共印100份)外交部文件外发(2004)24号关于执行安理会第1532号决议对利比里亚前总统泰勒等实施金融制裁的通知国务院各部委、各直属机构,各省、自治区、直辖市人民政府外事办公室:2004年3月12日,联合国安理会通过第1532号决议,要求联合国所有会员国冻结利比里亚前总统查尔斯▪泰勒及其直系亲属、利前政权其他高级官员、经安理会制裁利比里亚委员会认定的其他有关实体及个人拥有或控制的资金、其他金融资产或经济资源,并确保本国国民或本国境内任何人不向上述实体和个人提供资金、金融资产和经济来源。
- 1、下载文档前请自行甄别文档内容的完整性,平台不提供额外的编辑、内容补充、找答案等附加服务。
- 2、"仅部分预览"的文档,不可在线预览部分如存在完整性等问题,可反馈申请退款(可完整预览的文档不适用该条件!)。
- 3、如文档侵犯您的权益,请联系客服反馈,我们会尽快为您处理(人工客服工作时间:9:00-18:30)。
TABLE 1 : STATE-WISE DISTRIBUTION OF LANDLORD AND NON-LANDLORD DISTRICTS Mean non-Total districts State landlord Landlord Individual proportion basedbased Landlord Non-landlord Andhra Pradesh 0.66280010Bihar 0.001200012Gujarat 1.0007007Haryana 0.8500055Karnataka 1.000150015Madhya Pradesh 0.101410015Maharashtra 0.784140018Orissa 0.3262008Punjab 0.8700066Rajasthan 0.0010001Tamil Nadu 0.75290011Uttar Pradesh 0.4200123547West Bengal 0.001100011Total0.5152561246166Notes: This table lists only districts which used to be part of British India. Areas where the British did not set up the land revenue system are excluded.Districts of British India which are currently in Pakistan, Bangladesh or Burma are excluded.The table also excludes the states of Assam and Kerala, for which agricultural data is not available in the World Bank dataset.The table lists 1960 districts, some of which were split into two or more districts over time. We use un-split districts in all our analysis.Classification of revenue systems Village bodiesTABLE 2 : DIFFERENCES IN GEOGRAPHY AND DEMOGRAPHICSMean Standard Difference a Standard errordeviation of difference GeographyLatitude22.19 5.60-4.35***(0.961) Altitude366.41148.1493.64***(25.98) Mean annual rainfall (mm)1263.09471.64-373.99***(80.83) Coastal dummy0.14970.35790.084(0.065) Top 2 soil types:Black soil0.20960.40820.244***(0.072)Alluvial soil0.16770.3747-0.135**(0.067)Red soil0.56890.49670.075(0.090) Top-soil depth<25 cm0.01810.13360.016(0.024)25-50cm0.11450.3193-0.076(0.058)50-100 cm0.22890.42140.193(0.075)100-300 cm0.09040.28760.135***(0.051)>300 cm0.54820.4991-0.268***(0.088) Area share of various crops:1956-1987area share of rice0.3660.298-0.194***(0.054) area share of wheat0.1490.157-0.058**(0.026) area share of other cereals0.2050.1720.128***(0.031) area share of oilseeds0.0670.0880.065***(0.013) area share of cotton 0.0410.0960.066***(0.018) area share of tobacco0.0030.0150.005**(0.002) area share of sugarcane0.0310.0530.005(0.008) Cash crops to cereals ratio0.1490.2570.152***(0.048) Demographics: 1961, 1971, 1981, 1991log(Population)14.260.634-0.088(0.109) Population density36.4485.92-11.22**(4.02) Proportion of scheduled castes0.15980.0733-0.034**(0.014) Proportion of scheduled tribes0.09800.1630-0.010(0.031) Proportion rural0.81020.1237-0.066***(0.023) Proportion of working population in farming0.71190.1352-0.050*(0.027) Standard errors in parentheses, corrected for district-level clustering.* significant at 10%; ** significant at 5%; *** significant at 1%a Difference represents the average difference between non-landlord and landlord districts,computed as the regression coefficient on the non-landlord proportion.For the area under different crops and demographics, the difference is calculated after controllingfor year fixed effects.T A B L E 3 : D I F F E R E N C E S I N A G R I C U L T U R A L I N V E S T M E N T S A N D Y I E L D SM e a n n o n -l a n d l o r d p r o p o r t i o n = 0.5051 (s .d .=0.4274)D e p e n d e n t v a r i a b l eM e a n o f d e p e n d e n t v a r i a b l eO L S O L S O L S O L S F u l l s a m p l e E x c l u d i n g B e n g a l F u l l s a m p l e E x c l u d i n g v i l l a g e -a n d B i h a r b a s e d d i s t r i c t s(1)(2)(3)(4)A G R I C U L T U R A L I N V E S T M E N T SP r o p o r t i o n o f g r o s s c r o p p e d a r e a i r r i g a t e d0.2760.065*0.066*0.077***0.005(0.034)(0.035)(0.027)(0.032)F e r t i l i z e r u s e (k g /h a )24.6410.708***10.992***9.988***10.695***(3.345)(3.406)(2.301)(3.040)P r o p o r t i o n o f r i c e a r e a u n d e r H Y V0.2980.079*0.094**0.0160.074*(0.044)(0.043)(0.032)(0.038)P r o p o r t i o n o f w h e a t a r e a u n d e r H Y V0.5180.092**0.119***0.0310.107**(0.046)(0.045)(0.036)(0.052)P r o p o r t i o n o f o t h e r c e r e a l s a r e a u n d e r H Y V0.1960.057*0.084***-0.0350.109***(0.031)(0.024)(0.025)(0.041)A G R I C U L T U R A L P R O D U C T I V I T Y l o g (y i e l d o f 15 m a j o r c r o p s )0.157**0.152**0.173***0.089(0.071)(0.074)(0.053)(0.085)l o g (r i c e y i e l d )0.171**0.195**0.0990.173**(0.081)(0.081)(0.062)(0.079)l o g (w h e a t y i e l d )0.229***0.228***0.188***0.143(0.067)(0.070)(0.054)(0.098)N o . o f d i s t r i c t s 166143166109Y e a r f i x e d e f f e c t s Y E S Y E S Y E S Y E S G e o g r a p h i c c o n t r o l s Y E S Y E S Y E S Y E S D a t e o f B r i t i s h l a n d r e v e n u e c o n t r o lY E S Y E SY E SY E SS t a n d a r d e r r o r s i n p a r e n t h e s e s , c o r r e c t e d f o r d i s t r i c t -l e v e l c l u s t e r i n g . * s i g n i f i c a n t a t 10%; ** s i g n i f i c a n t a t 5%; *** s i g n i f i c a n t a t 1%E a c h c e l l r e p r e s e n t s t h e c o e f f i c i e n t f r o m a r e g r e s s i o n o f t h e d e p e n d e n t v a r i a b l e o n t h e m e a s u r e o f n o n -l a n d l o r d c o n t r o l .D a t a a r e f r o m 1956-87. D a t a f o r a r e a u n d e r h i g h -y i e l d i n g v a r i e t i e s (H Y V ) i s a f t e r 1965.G e o g r a p h i c c o n t r o l s a r e a l t i t u d e , l a t i t u d e , m e a n a n n u a l r a i n f a l l , a n d d u m m i e s f o r s o i l t y p e a n d c o a s t a l r e g i o n s .T h e n o n -l a n d l o r d d u m m y i s a s s i g n e d a s f o l l o w s : t h e d u m m y e q u a l s o n e f o r a l l i n d i v i d u a l -b a s e d d i s t r i c t s a n d a l l v i l l a g e -b a s e d d i s t r i c t s e x c e p t t h o s e i n O u d h . F o r l a n d l o r d -b a s e d d i s t r i c t s a n d t h e v i l l a g e -b a s e d d i s t r i c t s o f O u d h , t h e d u m m y i s z e r o .C o e f f i c i e n t o n n o n -l a n d l o r d p r o p o r t i o n C o e f f i c i e n t o n n o n -l a n d l o r d d u m m yTABLE 4: ROBUSTNESS OF OLS RESULTSPANEL A: ROBUSTNESS CHECKSDependent Variable Coefficient on non-landlord proportionOLS IVNeighbors only Full sample(1)(2) AGRICULTURAL INVESTMENTSProportion of gross cropped area irrigated0.101**0.216(0.041)(0.137)Fertilizer use (kg/ha)10.589**26.198**(4.979)(13.244)Proportion of rice area under HYV-0.0150.411**(0.083)(0.163)Proportion of wheat area under HYV0.078**0.584***(0.034)(0.163)Proportion of other cereals area under HYV-0.0250.526***(0.024)(0.129)AGRICULTURAL PRODUCTIVITYlog(yield of 15 major crops)0.145**0.409(0.061)(0.261)log(rice yield)0.1260.554*(0.098)(0.285)log(wheat yield)0.253***0.706***(0.084)(0.214)No. of districts35166Year fixed effects YES YESGeographic controls YES YESDate of British land revenue control YES YESStandard errors in parentheses, corrected for district-level clustering.* significant at 10%; ** significant at 5%; *** significant at 1%Each cell represents the coefficient from a regression of the dependent variable on the non-landlord proportion. Data are from 1956-87. Data for area under high-yielding varieties (HYV) is after 1965.Geographic controls are altitude, latitude, mean annual rainfall, and dummies for soil type and coastal regions. Instrument is a dummy which equals one if the date of British revenue control is after 1820 and before 1856. PANEL B: FIRST STAGE REGRESSIONS FOR IVDependent variable : Non-landlord proportionCoefficient on(1)(2)(3) Instrument0.331***0.430***0.419*** (=1 if date of British revenue control is between 1820 and 1856)(0.086)(0.092)(0.087)R-squared0.400.430.63 No. of observations166166166Geographic controls YES YES YES Date of British land revenue control YES YES YES Date of British land revenue control squared NO YES NO State fixed effects NO NO YESTABLE 5: ARE YIELDS EXPLAINED BY INVESTMENTS?Dependent variablesLog total yield Log rice yield Log wheat yieldOLS OLS OLS(1)(2)(3)Proportion non-landlord0.0350.0700.109(0.053)(0.063)(0.063)Proportion of gross cropped area irrigated0.693**0.439**0.435**(0.112)(0.096)(0.117)Fertilizer use (kg/ha)0.007**0.004**0.001(0.001)(0.001)(0.001)% area under HYV 4.274**0.580**0.618**(1.122)(0.063)(0.070)Adjusted R-squared0.600.520.56No. of districts166166166Year fixed effects YES YES YESGeographic controls YES YES YESDate of British land revenue control YES YES YESStandard errors in parentheses, corrected for district-level clustering.* significant at 10%; ** significant at 5%; *** significant at 1%Data are from 1956-87. Data for area under high-yielding varieties (HYV) is after 1965.Geographic controls are altitude, latitude, mean annual rainfall, and dummies for soil type and coastal regions.TABLE 6: WHEN DO THE DIFFERENCES APPEAR?PANEL A : FULL SAMPLE 1956-65After 1965(1)(2)(3)AGRICULTURAL INVESTMENTS Proportion of gross cropped area irrigated 0.0460.079**0.033**(0.033)(0.036)(0.016)Fertilizer use (kg/ha)1.026**15.581***14.55***(0.425)(4.763)(4.44)AGRICULTURAL PRODUCTIVITY log(yield of 15 major crops)0.0660.201***0.135***(0.065)(0.076)(0.033)log(rice yield)0.1080.196**0.088**(0.069)(0.089)(0.044)log(wheat yield)0.146**0.268***0.122*(0.058)(0.079)(0.063)No. of districts 166166166Year fixed effects YES YES YES Geographic controlsYES YES YES Date of British land revenue controlYESYESYESStandard errors in parentheses, corrected for district-level clustering.* significant at 10%; ** significant at 5%; *** significant at 1%Data are from 1956-87. Geographic controls are altitude, latitude, mean annual rainfall, and dummies for soil type and coastal regions. Estimates in column (3) are computed from a regression of the dependent variable on the interaction of the non-landlord proportion and a dummy for year>1965, after controlling for the main effects of these variables, as well as geographic controls.PANEL B: RICE YIELDS FOR TAMIL NADU DISTRICTSSample : 10 districts of Tamil NaduData are for 1870, 1901, 1911, 1917, 1919, and five-yearly intervals from 1922 to 1982Dependent variableBefore 1965After 1965DifferenceLog rice yield-0.0990.4150.514**(0.172)(0.366)(0.217)No. of districts 101010Year fixed effectsYESYESYESStandard errors in parantheses, adjusted for district-level clustering.* significant at 10%; ** significant at 5%; *** significant at 1%Coefficient on non-landlord proportion Coefficient on non-landlord proportionTABLE 7: IMPACT OF STATE POLICYCoefficient on non-landlord proportion Dependent variables Mean ofdependent OLS OLS OLSvariable Base specification Control for state State FEdev exp per capita(1)(2)(3) PANEL A: AGRICULTURAL INVESTMENTSProportion of gross cropped area irrigated0.2760.065*0.074**0.028(0.034)(0.035)(0.036) Fertilizer use (kg/ha)24.6410.708***10.805*** 4.297(3.345)(3.717)(3.308) Proportion of rice area under HYV0.2980.079*0.0070.000(0.044)(0.040)(0.042) Proportion of wheat area under HYV0.5180.092**0.0610.028(0.046)(0.047)(0.039) Proportion of other cereals area under HYV0.1960.057*0.0250.043*(0.031)(0.030)(0.026) PANEL B: AGRICULTURAL PRODUCTIVITYlog(yield of 15 major crops)0.157**0.174**0.059(0.071)(0.076)(0.072) log(rice yield)0.171**0.0830.016(0.081)(0.082)(0.078) log(wheat yield)0.229***0.243***0.150***(0.067)(0.072)(0.045)PANEL C: EDUCATION AND HEALTH INVESTMENTS 1981Proportion of villages having:Primary school0.7450.154***0.062*0.102***(0.036)(0.037)(0.039) Middle school0.2040.125***0.093***0.064***(0.023)(0.021)(0.018) High school0.0820.052***0.0190.030**(0.018)(0.014)(0.013) Primary health center0.0230.011***0.0020.012***(0.004)(0.004)(0.004) Primary health subcenter0.0310.033***0.0110.006(0.011)(0.009)(0.006) PANEL D: EDUCATION AND HEALTH OUTCOMESLiteracy rate (1961, 1971, 1981, 1991)0.29450.0524**0.0290*0.0241(0.0190)(0.0171)(0.0176) Infant mortality rate (1991)82.17-32.71***-25.43***-15.81***(5.38)(5.28)(5.40)State fixed effects NO NO YES Year fixed effects YES YES YES Geographic controls YES YES YES Date of British land revenue control YES YES YESStandard errors in parentheses, corrected for district-level clustering.* significant at 10%; ** significant at 5%; *** significant at 1%Geographic controls are altitude, latitude, mean annual rainfall, and dummies for soil type and coastal regions.A P P E N D I X T AB L E 1: D I S T R IC T S O F B R I T I S H I ND I A , W I T H D A TE S A N D M O D E OF A C Q U I S I T I O N B Y T H E B R I T I S HP r o v i n c e R e g i o n D a t e a n d m o d e o f a c q u i s i t i o n D i s t r i c t s i n c l u d e d B e n g a l C a l c u t t aS e t u p b y B r i t i s h i n 1690 C a l c u t t a P r e s i d e n c yo n l a n d o b t a i n e d f r o m M u g h a l e m p e r o r F i r s t c o n q u e s t sC a m e u n d e r B r i t i s h p o l i t i c a l c o n t r o l 24-P a r g a n a s (p a r t s ), B u r d w a n , M i d n a p o r e (p a r t s ), f r o m 1757 t o 1761C h i t t a g o n gB e n g a l a n d B e h a rR e v e n u e c o l l e c t i o n r i g h t s g r a n t e dB a n k u r a , B i r b h u m , H o o g h l y , H o w r a h , M a l d a , M u r s h i d a b a d , b y M u g h a l e m p e r o r i n 1765N a d i y a (m o d e r n W e s t B e n g a l ); B h a g a l p u r , C h a m p a r a n , D a r b h a n g a ,G a y a , H a z a r i b a g h , L o h a r d a g g a , M u n g e r , P a t n a ,P u r n e a , S a n t a l P a r g a n a s , S a r a n , S h a h a b a d , S i n g h b h u m (m o d e r n B i h a r ); B a k i r g a n j , B o g r a , D a c c a , F a r i d p u r , D i n a j p u r , J e s s o r e , K h u l n a , M a i m a n s i n g h , N o a k h a l l i , P a b n a , R a j s h a h i , R a n g p u r , T i p r a (m o d e r n B a n g l a d e s h )J a l p a i g u r i a n d C a m e u n d e r c o n t r o l i n 1826 J a l p a i g u r i , D a r j e e l i n g .D a r j e e l i n g a n d 1838 r e s p e c t i v e l y .O r i s s a C o n q u e r e d i n 1803B a l a s o r e ,C u t t a c k , P u r i (r e s t o f O r i s s a u n d e r t r i b u t a r y c h i e f s )M a d r a s J a g i rG r a n t e d b y N a w a b o f t h e C a r n a t i c C h i n g l e p u t , M a d r a sP r e s i d e n c yi n 1750-63N o r t h e r n C i r c a r sG r a n t e d b y M u g h a l e m p e r o r i n 1765, V i z a g a p a t a m , G a n j a m , K i s t n a , G o d a v a r ig r a n t c o n f i r m e d b y N i z a m o f D e c c a n i n 1768.T e r r i t o r i e s o b t a i n e d O b t a i n e d f r o m M y s o r e a f t e r t h e S a l e m , C o i m b a t o r e , M a l a b a r , K a n a r a , f r o m M y s o r e S e c o n d M y s o r e W a r 1792s o m e a r e a s o f M a d u r a C e d e d D i s t r i c t s O b t a i n e d b y N i z a m o f D e c c a n a f t e r A n a n t a p u r , B e l l a r y , C u d d a p a h , K a r n u lM y s o r e W a r a n d t h e n c e d e d t o B r i t i s h i n 1800C a r n a t i c D i s t r i c t sC e d e d t o B r i t i s h b y N a w a b o f N e l l o r e , N o r t h A r c o t , S o u t h A r c o t , M a d u r a , C a r n a t i c i n 1801T r i c h i n o p o l y , T i n n e v e l l y T a n j o r eT a k e n o v e r b y B r i t i s h d u e t o i n c a p a c i t y T a n j o r eo f H i n d u r u l e r i n 1799P r i n c e l y M y s o r eT a k e n o v e r b y B r i t i s h i n 1831 d u e t o M y s o r es t a t e sm i s m a n a g e m e n t o f r u l e r , g i v e n b a c k t o W o d e y a r s i n 1881P r o v i n c e R e g i o n D a t e a n d m o d e o f a c q u i s i t i o n D i s t r i c t s i n c l u d e d U n i t e d B e n a r e s C e d e d b y t h e N a w a b o f O u d h i n 1775B e n a r e s , M i r z a p u r , J a u n p u r , G h a z i p u r , B a l l i a , P r o v i n c e s C e d e d D i s t r i c t s C e d e d b y t h e N a w a b o f O u d h i n 1801A z a m g a r h , G o r a k h p u r ,B a s t i , A l l a h a b a d , F a t e h p u r , K a n p u r ,F a r u k h a b a d , E t a w a , M a i n p u r i , E t a h , S h a h j a h a n p u r , B a d a y u n , B a r e l i , P i l i b h i t , M o r a d a b a d , B i j n a u r , T a r a i P a r g a n a sC o n q u e r e dD i s t r i c t sC o n q u e r e d b y L o r d L a k e f r o m S c i n d i a A g r a , M a t h u r a , A l i g a r h , B u l a n d s h a h r , M e e r u t , a n d o t h e r s i n 1803M u z a f f a r n a g a r , S a h a r a n p u r B u n d e l k h a n d C o n q u e r e d i n p a r t s f r o m 1803-17.B a n d a , H a m i r p u r T a k e n o v e rT a k e n o v e r d u e t o l a p s e , f o r f e i t u r e e t c . J a l a u n , J h a n s i , L a l i t p u ri n y e a r s a f t e r 1840.D e h r a d u n C e d e d a f t e r t h e N e p a l w a r i n 1815D e h r a d u n .O u d hA n n e x e d f r o m N a w a b o f O u d h i n 1856.K h e r i , S i t a p u r , H a r d o i , L u c k n o w , U n a o , B a r a b a n k i , R a i -B a r e l i ,P a r t a b g a r h , S u l t a n p u r , F a i z a b a d , G o n d a , B a h r a i c h B o m b a y S u r a t O b t a i n e d f r o m N a w a b o f S u r a t i n 1800S u r a t P r e s i d e n c y G u j a r a tC o n q u e r e d f r o m B a r o d a i n 1803 a n d A h m e d a b a d , K a i r a , B r o a c hM a r a t h a s i n 1818.M a r a t h a t e r r i t o r yC o n q u e r e d f r o m P e s h w a i n 1818T h a n a , K h a n d e s h , N a s i k , A h m e d n a g a r , P o o n a , S h o l a p u r ,K o l a b a , R a t n a g i r i , B e l g a u m (s o m e p a r t s o b t a i n e d i n 1827),B i j a p u r , D h a r w a r S a t a r a T a k e n o v e r b y l a p s e i n 1848S a t a r a K a n a r a T r a n s f e r r e d f r o m M a d r a s i n 1862K a n a r a S i n d h C o n q u e r e d i n 1843K a r a c h i , H a i d a r a b a d , S h i k a r p u r , U p p e r S i n d h F r o n t i e r , T h a r & P a r k a r (m o d e r n P a k i s t a n )P a n c h M a h a l s O b t a i n e d i n 1861P a n c h M a h a l s A s s a mF r o m B e n g a lO b t a i n e d a s p a r t o f d i w a n i i n 1765,G o a l p a r a (m o d e r n A s s a m ), S y l h e t (m o d e r n B a n g l a d e s h )l a t e r t r a n s f e r r e d t o A s s a m A s s a m C o n q u e r e d i n 1824D a r r a n g , K a m r u p , L a k h i m p u r , N a u g o n g , S i b s a g a r H i l l d i s t r i c t sB r o u g h t u n d e r c o n t r o l i n 1830-35C a c h a r , C a c h a r H i l l s , E a s t e r nD w a r s (1866), J a i n t y a P a r g a n a s , K h a s i a n d J a i n t y a s , N a g a H i l l s .C e n t r a l M a r a t h a t e r r i t o r yC o n q u e r e d f r o m B h o n s l e i n 1818; s o m e a r e a s B a l a g h a t , B e t u l , B h a n d a r a , B i l a s p u r , C h a n d a , C h h i n d w a r a , P r o v i n c e sl e f t u n d e r B h o n s l e t i l l 1854D a m o h , H o s h a n g a b a d , J a b a l p u r , M a n d l a , N a g p u r , N a r s i n g h p u r , N i m a r (1820), R a i p u r , S a g a r , S e o n i , W a r d a h S a m b a l p u rC o n q u e r e d i n 1818, u n d e r l o c a l c h i e f S a m b a l p u rt i l l 1849P r o v i n c e R e g i o n D a t e a n d m o d e o f a c q u i s i t i o n D i s t r i c t s i n c l u d e d P a n j a bD e l h i C o n q u e r e d i n 1803 D e l h i , G u r g a o n , H i s a r , K a r n a l S i k h t e r r i t o r y O b t a i n e d a f t e r S i k h W a r i n 1845-46A m b a l a , F i r o z p u r , H o s h i y a r p u r , J a l a n d h a r , K a n g r a , L u d h i a n a S i k h t e r r i t o r y O b t a i n e d a f t e r S i k h W a r i n 1849A m r i t s a r , G u r d a s p u r , R o h t a k (I n d i a );B a n n u , D e r a G h a z i K h a n , D e r a I s m a i l K h a n , G u j r a n w a l a , G u j r a t , H a z a r a , J h a n g , J h e l u m , K o h a t , L a h o r e , M o n t g o m e r t y , M u l t a n , M u z a f f a r g a r h , P e s h a w a r ,R a w a l p i n d i , S h a h p u r , S i a l k o t (P a k i s t a n )S h i m l a O b t a i n e d i n 1815S h i m l aS o u r c e : B a d e n -P o w e l l (1892,1894), K u m a r (1982)APPENDIX TABLE 2: ESTABLISHMENT OF LAND REVENUE SYSTEMS IN BRITISH INDIAland revenue controlBengal1757, 1765Revenue auctions in early 1770s; old landlords dispossessed, Presidency several defaults and famine;old landlords reinstated in 1784;Lord Cornwallis announces Permanent Settlement in 1793:landlords' rents fixed in perpetuity with stiff penalties for default. Madras 1765, 1790-18011765 territories came under Permanent Settlement.Presidency Munro and Read tried individual system in some districts from1796-1805; in 1807 all districts put under landlords for 3 years,leases renewed for 10 years in 1810-11; Munro went to Englandand convinced the Directors of the East India Company to orderan individual settlement in the whole of Madras;order implementedafter 1820 when leases expired; all future defaulting landlordestates also converted to individual system.Bombay 1803, 1817-18Individual system tried in Poona in 1820's, but failed; Wingate and Presidency Goldsmid start Bombay Survey System in 1835 for individualsettlement system; a few long-standing landlords left in place incertain areas.North-West1775, 1801-03Permanent Settlement in 1775 areas.Provinces 3 and 4-year landlord leases in 1802-1819. Question of PermanentSettlement widely debated; revenue secretary Holt Mackenzie's1819 Minute recognized the existence of village bodies and askedfor their rights to be protected in any settlement; regulation passedin 1822.Oudh1856Lord Dalhousie announced settlement with village bodies whereverpossible; Mutiny in 1857 before this could be done; Lord Canningreversed policy in 1858 and brought back landlords (talukdars) withfull proprietary rights.Central 1818, 1849No fixed policy until landlord settlement (malguzari)Provinces announced in 1853, implemented in 1850s. Sambhalpurdistrict however put under individual cultivator system.Berar1856Was under Nizam till 1856; landlord system tried found unsuccessful;Bombay Survey System (individual cultivator based) implemented. Assam1765, 1824-26Some areas transferred from Bengal had Permanent Settlement;others got individual-cultivator systems.Panjab1846, 1849Village-based system put into place everywhere; practically nobig landlords.APPENDIX TABLE 3: DATA SOURCES AND CONSTRUCTION OF VARIABLESPost-Independence dataData on district geography, crop areas, yields, irrigation, fertilizer use, adoption ofhigh-yielding varieties: India Agriculture and Climate Data Set (World Bank)/indian/home.cfmDistrict level data on literacy, occupation classes, proportion of scheduled castes etc:Indian Database Project Vanneman, Reeve and Douglas Barnes (2000)Indian District Data, 1961-1991: Machine-readable data file and codebook, Center on Population, Gender, and Social Inequality, College Park, Maryland.URL: /socy/vanneman/districts/index.htmlDistricts and maps of modern India: Village infrastructure variables: State statistical abstracts of 1981Land-holdings by size category: Agricultural census of 1990-91.Data on poverty and inequality (1972, 1987): based on National Sample Surveys.Data on state development expenditure: Database on Poverty and Growth in India compiled byBerk Ozler, Gaurav Datt and Martin Ravallion (World Bank)Data on state land reforms: Besley and Burgess (2000)Historical dataDistricts and maps of British India: Baden-Powell (1892)Non-landlord proportion:For Uttar Pradesh, Madhya Pradesh and Panjab: computed from district-level Land Settlement Reports as the proportion of villages, estates or land area not under the revenue liability of landlords. The Settlement Reports were compiled by British administrators in the 1870's and 1880's.For Madras Presidency: non-landlord proportion obtained from Baden-Powell (1892).For Bombay Presidency, Bengal Presidency, Orissa, Berar and districts for which we do not have district-level settlement reports: Non-landlord measure is assigned as zero or one based onhistorical accounts of the dominant land tenure system in the district. Sources of information include Baden-Powell (1892), Gupta (1940), Kumar (1982), Misra (1942), Mukherjee (1962) and Patel (1957). Land revenue inequality 1885: Digital South Asia Library ()Land revenue inequality 1948 for districts of Uttar Pradesh:Report of the United Provinces Zamindari Abolition Committee, 11 (Allahabad, 1948) pp. 12-17. Reproduced in Stokes (1978b).A P P E N D I X T AB L E 4: D E T A I L E D R E G R E S S I O N S P EC I F I C A T I O ND epend entva riable:Lo gagr icul tur aly ield(base don15ma jorcrops)N o c o n t r o l s A l t i t u d e , l a t i t u d e M e a n a n n u a l r a i n f a l l ,S o i l d u m m i e s D a t e o f B r i t i s h c o a s t a l d u m m y l a n d r e v e n u e c o n t r o l (1)(2)(3)(4)(5)P r o p o r t i o n n o n -l a n d l o r d 0.1010.0910.1230.117*0.157**(0.076)(0.088)(0.086)(0.069)(0.071)A l t i t u d e (x 10-3)0.2960.425*0.644***0.722***(0.243)(0.245)(0.194)(0.189)L a t i t u d e 0.0040.003-0.007-0.006(0.006)(0.007)(0.007)(0.007)M e a n a n n u a l r a i n f a l l (x 10-3)0.161**0.0290.006(0.067)(0.060)(0.062)C o a s t a l d u m m y 0.171*0.0720.032(0.096)(0.094)(0.093)B l a c k s o i l d u m m y -0.409***-0.396***(0.085)(0.085)R e d s o i l d u m m y 0.137*0.104(0.071)(0.069)A l luv i a l s o i l d u m m y 0.196***0.190***(0.053)(0.052)D at e o f B r i t i s h l a n d r e v e n u e c o n t r o l -0.002***(0.001)C o ns t a n t -0.314***-0.503***-0.782***-0.494***3.586**(0.038)(0.145)(0.181)(0.186)(1.502)Y e a r f i x e d e f f e c t sy e s y e s y e s y e s y e s N o . o f d i s t r i c t s 166166166166166R -s q u a r e d 0.170.190.230.420.43* s i g n i f i c a n t a t 10%; ** s i g n i f i c a n t a t 5%; *** s i g n i f i c a n t a t 1%S t a n d a r d e r r o r s i n p a r a n t h e s e s , a d j u s t e d f o r d i s t r i c t -l e v e l c l u s t e r i n g .D ata f o r f r o m 1956-87.A P P E N D I X T AB L E 5 : L I S T O F N E I G H B O R I N G D I S T R IC T S G r oup StatesLa nd lo rddis t r ic ts Non-l a nd lo rdd is t r ic ts Re aso nfo rdiff e renc eintenu r e1A n d h r a P r a d e s h S r i k a k u l a m E a s t G o d a v a r i A r e a s p u t u n d e r l a n d l o r d s a n d P e r m a n e n t V i s h a k h a p a t n a m S e t t l e m e n t b e f o r e t h e r e s t o f M a d r a s P r e s i d e n c y w a s c o n v e r t e d t o i n d i v i d u a l s y s t e m .2T a m i l N a d u M a d u r a i C o i m b a t o r e A r e a s p u t u n d e r l a n d l o r d s a n d P e r m a n e n t R a m a n a t h a p u r a m T h a n j a v u r S e t t l e m e n t b e f o r e t h e r e s t o f M a d r a s T i r u c h i r a p a l l i P r e s i d e n c y w a s c o n v e r t e d t o i n d i v i d u a l s y s t e m .T i r u n e l v e l i 3M a d h y a P r a d e s h ,B i l a s p u r R a i g a r h S a m b a l p u r d i s t r i c t w a s p u t u n d e r O r i s s a R a i p u r S a m b a l p u r i n d i v i d u a l c u l t i v a t o r s y s t e m , u n l i k e t h e r e s t o f t h e C e n t r a l P r o v i n c e s .4M a h a r a s h t r a ,C h a n d r a p u r A m r a v a t i B e r a r p r o v i n c e w a s i n d i v i d u a l -b a s e d M a d h y a P r a d e s h W a r d h a Y a v a t m a l w h i l e C e n t r a l P r o v i n c e s w a s l a n d l o r d -b a s e d .B e t u l 5U t t a r P r a d e s h F a i z a b a d A l l a h a b a d O u d h d i s t r i c t s h a v e g r e a t e r % o f (E a s t )G o n d a A z a m g a r h l a n d l o r d s b e c a u s e o f c h a n g e o f P r a t a p g a r h B a s t i p o l i c y a f t e r 1857 M u t i n y .S u l t a n p u r G o r a k h p u r J a u n p u r 6U t t a r P r a d e s h H a r d o i F a r r u k h a b a d O u d h d i s t r i c t s h a v e g r e a t e r % o f(W e s t )K h e r i F a t e h p u r l a n d l o r d s b e c a u s e o f c h a n g e o f R a e B a r e l i K a n p u r N a g a r p o l i c y a f t e r 1857 M u t i n y .U n n a o P i l i b h i t S h a h j a h a n p u r。