windbg 调试指南,英文版
Windows调试工具入门-6(WinDbg内核调试常用命令2)

WinDbg内核调试常用命令(2)接上一章继续介绍内核调试下的常用命令,这一章主要涉及内存相关、对象相关、驱动设备相关以及蓝屏Dump 相关命令。
介绍每个命令的主要作用,以及常用方式,不会涉及详细的命令参数,目的是能快速上手熟悉内核调试下的常用操作,而不是替代帮助文件。
内存相关内存操作应该是调试最常用的,比如查看内存、修改内存等。
本节介绍内核模式下常用的内存操作命令,大部分是内核模式下特有的命令,诸如db/eb/dt/s等基本内存命令则不会介绍。
!address!address命令显示内存信息,如内存范围、内存权限等。
这条命令在用户模式下也能用,而且显示的信息比较丰富。
!address命令不带参数时,显示所有内存信息。
kd>!address80800000-0026b000Usage KernelSpaceUsageImageImageName ntoskrnl.exe80a6b000-0001f000Usage KernelSpaceUsageImageImageName halacpi.dll......f51d9000-00005000Usage KernelSpaceUsageKernelStackKernelStack81827020:340.7ac......f894f000-00002000Usage KernelSpaceUsageImageImageName swenum.sysf8951000-00256000Usage KernelSpaceUsageNonPagedSystemf8ba8000-07038000Usage KernelSpaceUsageNonPagedPoolExpansionUsage表示内存用途,如内核映像、非分页内存、内核栈、会话空间等。
通过Usage就能大概了解某段内存的使用情况,也为进一步分析内存指明了方向。
!address xxxxxxxx显示指定地址的内存信息。
WinDbg 调试入门

WinDbg 调试入门Living1 使用方式1.1 启动进程通过菜单File->Open Executable启动,为了接近常用启动环境,最好把Start directory 设置为进程所在目录。
1.2 注入进程通过菜单File->Attach to a Process注入到当前运行的进程中。
1.3 系统默认调试器HKEY_LOCAL_MACHINE\SOFTWARE\Microsoft\WindowsNT\CurrentVersion\AeDebug修改其中的Debugger项""C:\WinDbg\windbg.exe"" -p %ld -e %ld如果系统中任意进程发生崩溃,则自动调用系统默认调试器注入到该进程中。
如果Auto 取值为1,不提示用户直接进入。
1.4 程序启动时自动加载调试器当任意进程以任意方式启动时,自动加载调试器并注入到该进程中。
例如有loader.exe加载game.exe,而且game.exe必须由loader加载才能正常运行。
如果game.exe在启动过程中出现错误,希望调试game.exe的启动过程,可使用本方法。
运行WinDbg所附带的工具Global Flags。
请注意,在Image编辑框中只能输入进程的文件名,不能包括路径信息。
1.5 使用AdPlus脚本自动捕捉错误使用WinDbg附带的AdPlus脚本监视进程,如果进程发生崩溃则自动写入到Dump文件中。
adplus –crash –pn notepad.exe –o c:\dumps –quiet说明:-crash 表示监测进程中的崩溃情况-pn 对notepad.exe进行监测,系统中必须有notepad.exe在运行。
也可使用-p <PID>参数,通过进程ID指定要监视的进程。
-o C:\dumps 把日志与捕捉到的dump文件保存到该目录中。
WinDbg用户指南说明书

Table of ContentsAbout1 Chapter 1: Getting started with WinDbg2 Remarks2 Versions2 Examples2 Installation or Setup2 Debuggers3 Chapter 2: Crash analysis4 Examples4 Basic user mode crash analysis4 Chapter 3: DML(Debugger Mark Language)5 Examples5 Turn on/off5 Chapter 4: Extensions6 Examples6 SOS6 SOSex6 PyKD6 Getting started with PyKd6 NetExt7 Extensions overview7 CoSOS7 Chapter 5: Kernel debugging9 Examples9 Important commands9 Chapter 6: Remote debugging10 Examples10 Important commands10 Chapter 7: User mode / application debugging11 Examples11Important commands11 Documenting your work11 Working with symbols11 Crash analysis12 The environment12 Threads, call stacks, registers and memory12 Controlling the target13 Working with extensions13 Stop debugging13 Attach and detach14 Behavior of WinDbg14 Usability Commands14 Getting Helps14 Create Custom Command Window in Windbg14 Credits16AboutYou can share this PDF with anyone you feel could benefit from it, downloaded the latest version from: windbgIt is an unofficial and free WinDbg ebook created for educational purposes. All the content is extracted from Stack Overflow Documentation, which is written by many hardworking individuals at Stack Overflow. It is neither affiliated with Stack Overflow nor official WinDbg.The content is released under Creative Commons BY-SA, and the list of contributors to each chapter are provided in the credits section at the end of this book. Images may be copyright of their respective owners unless otherwise specified. All trademarks and registered trademarks are the property of their respective company owners.Use the content presented in this book at your own risk; it is not guaranteed to be correct nor accurate, please send your feedback and corrections to ********************Chapter 1: Getting started with WinDbg RemarksThis section provides an overview of what windbg is, and why a developer might want to use it.It should also mention any large subjects within windbg, and link out to the related topics. Since the Documentation for windbg is new, you may need to create initial versions of those related topics.VersionsImportant versions of WinDbg, for supported versions of WinDbg. See also a detailed list with historical versions online.It's important to note that there's a versioning scheme change from older 6.12 to the newer 6.1 version. The older versions have low numbers (<100) in the third place while newer versions have high numbers (>6000).In many cases, WinDbg versions provided for newer Windows versions still work on older versions on Windows, e.g. Version 10 of WinDbg can still be used on Windows 7. However, some commands may make use of API calls that are not available and thus fail. Therefore it's good to have several versions of WinDbg available.ExamplesInstallation or SetupMicrosoft describes 3 ways of installing WinDbg:•as part of the WDK (Windows Driver Kit)•as part of the SDK (Software Development Kit)with the installer of the SDK and deselecting everything else but "Debugging Tools for•Windows"To get the installer, visit Download the WDK, WinDbg, and associated tools and scroll down to a section called "Get debugging tools".A well-known and convenient but inofficial source is Codemachine where you can also download older versions of the Debugging Tools directly.The setup itself is straight-forward. Click through the installer until it finishes.DebuggersWinDbg is often used as an abbreviation of "Debugging tools for Windows". It contains different debuggers:The commands are identical, except that there may be GUI related commands which don't work in the console versions.Read Getting started with WinDbg online: https:///windbg/topic/1833/getting-started-with-windbgChapter 2: Crash analysisExamplesBasic user mode crash analysis.exr -1 gives you details about the last exception thrown.!analyze -v usually does a good job as well.For .NET, the command !pe of the SOS extension shows details about the .NET exception that was thrown.Read Crash analysis online: https:///windbg/topic/5389/crash-analysisChapter 3: DML(Debugger Mark Language) ExamplesTurn on/off.prefer_dml 1 turn on dmlformat output.prefer_dml 0 turn off dmlformat outputRead DML(Debugger Mark Language) online: https:///windbg/topic/7987/dml-debugger-mark-language-Chapter 4: ExtensionsExamplesSOSSOS (son of strike) is the official WinDbg extension from Microsoft for .NET. It gets installed as part of the .NET framework and thus is available by default.Like any extension, it can be loaded using .load x:\full\path\to\sos.dll, but there are easier ways. Depending on the version of .NET, the extension is located side by side to mscorwks.dll(.NET CLR 2), clr.dll (.NET CLR 4) or coreclr.dll (Silverlight and Universal apps), so one of the following commands should work:.loadby sos clr.loadby sos coreclr.loadby sos mscorwksFor a list of available commands, consult !help.SOSexSOSex is an extension to SOS, written by Steve Johnson, a Microsoft employee. He provides SOSex for download for free, but it's not open source.Typically, the extension is not available side by side to any other DLL, so it is usually loaded with .load x:\full\path\to\sosex.dll.Besides simplifying debugging of .NET, the command !dlk can also be used in native environments for checking deadlocks of critical sections.For a list of available commands, consult !help of SOSex.PyKDPyKD is a WinDbg extension that enables you writing Python scripts. It's open source.Typically, the extension is not available side by side to any other DLL, so it is usually loaded with .load x:\full\path\to\pykd.pyd, where PYD is the extension for a python DLL, but you can rename it to DLL if you like.Getting started with PyKdPyKD does not offer !help, so look up the documentation at Codeplex. Many developers seem to be from Russia and the most up-to-date and complete documentation is probably in Russian. The Google translater does a decent job.Like other extensions, use the correct bitness of the extension that corresponds to that of WinDbg. In addition to that you must have Python installed with the same bitness as well.!py runs an REPL interpreter and !py x:\path\to\script.py runs a python script. Scripts should usefrom pykd import *as the first line in order to make use of PyKD's functionality, while this line is not needed in the REPL interpreter. The interpreter can be exited using exit().NetExtNetExt is an extension for .NET which provides•LINQ-like queries for objects on the heap (!wselect, !wfrom)•display capabilities for special objects like dictionaries and hash tables (!wdict, !whash) / HTTP related commands (!wcookie, !wruntime, !whttp)••several other network related commandsTypically, the extension is not available side by side to any other DLL, so it is usually loaded with .load x:\full\path\to\netext.dllExtensions overviewAn incomplete list of WinDbg extensions that are not installed with WinDbg itself:CoSOSCoSOS (cousin of SOS) is an open source extension for WinDbg focusing on .NET memory fragmentation (!gcview) and threading issues (!wfo, !tn).Typically, the extension is not available side by side to any other DLL, so it is usually loaded with .load x:\full\path\to\cosos.dll. It requires that SOS is loaded and currently works with 32 bit applications only.Read Extensions online: https:///windbg/topic/5391/extensionsExamplesImportant commands•!process - list user mode processes•.process - set process context•!peb - show process environment block•!teb - show thread environment block•!locks - deadlock analysis.dump - save a crash dump file to disk•Read Kernel debugging online: https:///windbg/topic/6076/kernel-debuggingExamplesImportant commands•.server - create a debugging server•.clients - list debugging clients connected to the server•.endsrv - end a debugging server•.servers - list debugging server connections•.remote - start a remote.exe server.noshell - prevent shell commands•Read Remote debugging online: https:///windbg/topic/5977/remote-debuggingChapter 7: User mode / application debuggingExamplesImportant commandsDocumenting your workRemember what you've done and retain long outputs which can't be kept in WinDbg's buffer. It's always good to have a log available for reproducing debugging steps, e.g. to ask questions on Stack Overflow.Working with symbolsWithout or with incorrect symbols, you may receive wrong information and be misled. Make sure you're familiar with these commands before starting work in WinDbg. See also How to set up symbols in WinDbg.Crash analysisFind out what has happened (in crash dumps) and how to handle events (in live debugging).The environmentCheck the process name and version information.Threads, call stacks, registers and memoryInspect the details.Controlling the targetIn live debugging, take control the execution.Working with extensionsExtensions may provide significant advantages and enhancements.Stop debuggingAttach and detachBehavior of WinDbgUsability CommandsGetting HelpsCreate Custom Command Window in WindbgThe .cmdtree command allows to open a .txt file with predefined commands which you can simply double click to execute.How to create command fileCreate the file using this templatewindbg ANSI Command Tree 1.0title {"Window title"}body{"Group Heading"}{"Name of command to display"} {"command"}{"Name of command to display"} {"command"}{"Group Heading"}{"Name of command to display"} {"command"}Things to take care1.The template format should be followed precisely for opening the file in Windbg.2.The newline is required after each {Group Heading}.3.Each {Name of command to display} {command} pair should be in one line and should be followed by a new line.Example of custom command filewindbg ANSI Command Tree 1.0title {"Your title goes here"}body{"Basic commands"}{"Show CLR Version"} {"lmv m clr"}{"Load SOS from CLR"} {".loadby sos clr "}{"Symbols"}{"Load my symbols"} {".sympath+ "c:\DebugSymbols" ; .reload"}How to open command UI from command windowExecute .cmdtree <path of your .txt file> to open the window. You will see a window like thisDouble click on the command to execute.Read User mode / application debugging online: https:///windbg/topic/5384/user-mode---application-debuggingCredits。
windbg使用方法
windbg使用方法Windbg是一款由Microsoft开发的强大的调试工具,它可以帮助开发人员诊断和解决Windows平台上的各种软件问题。
本文将介绍Windbg的基本使用方法,希望能够帮助读者更好地利用这一工具进行调试和分析。
首先,我们需要下载并安装Windbg工具。
可以在Microsoft官方网站上找到Windbg的安装包,并按照提示进行安装。
安装完成后,我们可以在开始菜单或者桌面上找到Windbg的快捷方式,双击打开即可进入工具界面。
在使用Windbg进行调试之前,我们需要先了解一些基本概念和操作。
首先是符号文件的设置,符号文件包含了程序中各个函数和变量的调试信息,可以帮助我们更好地进行调试。
在Windbg中,可以通过设置符号路径和加载符号文件来进行符号文件的管理。
接着是源代码的设置,如果我们有程序的源代码,可以通过设置源代码路径来进行源代码级别的调试。
最后是调试目标的设置,可以通过Attach或者Open Crash Dump来加载需要调试的程序。
接下来,我们来看一下Windbg的一些常用命令和功能。
在Windbg的命令行窗口中,可以输入各种命令来进行调试操作,比如设置断点、查看变量的值、跟踪函数的调用等。
此外,Windbg还提供了丰富的图形化界面,可以通过菜单栏和工具栏来进行各种调试操作,比如查看内存、查看寄存器、查看线程信息等。
除了基本的调试功能,Windbg还提供了一些高级的调试工具和扩展,比如分析内存泄漏、分析崩溃转储、分析性能问题等。
通过这些工具和扩展,我们可以更深入地了解程序的运行情况,找出潜在的问题并加以解决。
在使用Windbg进行调试的过程中,我们可能会遇到各种各样的问题和挑战,比如调试信息不够详细、调试速度太慢、调试过程中出现崩溃等。
针对这些问题,我们可以通过调整符号文件的设置、优化调试环境、使用合适的调试工具等方式来进行解决。
总的来说,Windbg是一款功能强大的调试工具,可以帮助我们更好地进行程序调试和分析。
windbg gflags操作流程
windbg gflags操作流程Windbg是一种Windows操作系统的调试工具,它可以帮助开发人员分析和调试应用程序的崩溃和性能问题。
Gflags是Windbg的一个重要组成部分,它提供了一种简便的方式来配置系统的全局标志和调试标志。
本文将介绍如何使用Windbg和Gflags进行调试和性能分析的操作流程。
第一步:安装Windbg和配置符号文件路径我们需要安装Windbg调试工具,并配置符号文件路径。
符号文件包含了应用程序的调试信息,可以帮助开发人员更方便地分析崩溃和性能问题。
在Windbg安装目录下,找到“sym”文件夹,将符号文件下载到该文件夹中。
然后,在Windbg的命令行中输入以下命令来配置符号文件路径:.sympath+ C:\Sym其中,C:\Sym是符号文件路径的根目录,可以根据实际情况进行修改。
第二步:启动Windbg并加载应用程序打开Windbg,选择“文件”菜单中的“打开进程”选项,然后在弹出的对话框中输入应用程序的可执行文件路径。
点击“确定”按钮后,Windbg会加载该应用程序并暂停在入口点处。
第三步:设置断点和观察点在Windbg的命令行中,输入以下命令来设置断点:bp symbol其中,symbol是要设置断点的函数名或地址。
通过设置断点,我们可以在应用程序执行到特定位置时中断程序的执行,以便进行调试和分析。
除了设置断点,我们还可以设置观察点来监视特定的变量或内存地址的值。
在Windbg的命令行中,输入以下命令来设置观察点:ba r/w size address其中,size是要监视的内存块的大小,address是要监视的内存地址。
通过设置观察点,我们可以在特定的内存地址发生变化时中断程序的执行,以便进行调试和分析。
第四步:运行应用程序并触发断点和观察点在Windbg的命令行中,输入“g”命令来继续执行应用程序。
当应用程序执行到设置的断点或观察点处时,Windbg会中断程序的执行,并显示相关的调试信息。
蓝屏修复工具Windbg使用教程
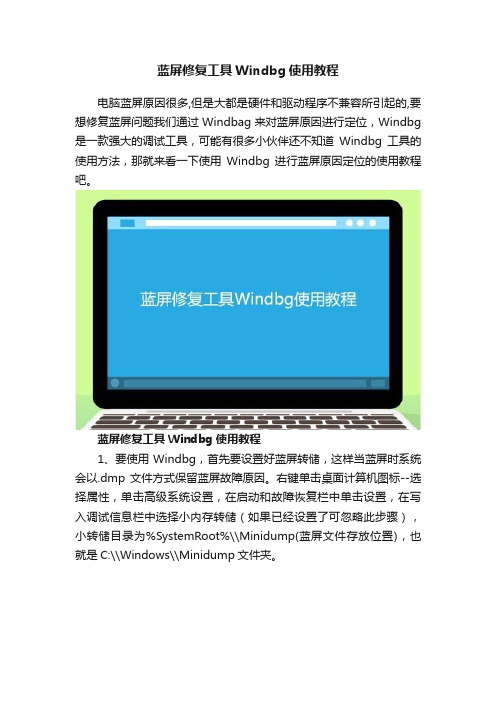
蓝屏修复工具Windbg使用教程电脑蓝屏原因很多,但是大都是硬件和驱动程序不兼容所引起的,要想修复蓝屏问题我们通过Windbag来对蓝屏原因进行定位,Windbg 是一款强大的调试工具,可能有很多小伙伴还不知道Windbg工具的使用方法,那就来看一下使用Windbg进行蓝屏原因定位的使用教程吧。
蓝屏修复工具Windbg使用教程1、要使用Windbg,首先要设置好蓝屏转储,这样当蓝屏时系统会以.dmp文件方式保留蓝屏故障原因。
右键单击桌面计算机图标--选择属性,单击高级系统设置,在启动和故障恢复栏中单击设置,在写入调试信息栏中选择小内存转储(如果已经设置了可忽略此步骤),小转储目录为%SystemRoot%\\Minidump(蓝屏文件存放位置),也就是C:\\Windows\\Minidump文件夹。
2、搜索下载安装Windbg。
3、安装成功后,启动Windbg。
4、先为Windbg软件设置符号表路径,作为蓝屏原因分析数据库,否则软件将没有作用。
单击File--选择Symbol File Path。
5、在弹出的对话框Symbol Path文本框中输入SRV*C:\\Symbols*/download/symbols,单击OK。
6、设置完毕后单击File--选择Open Crash Dump来打开蓝屏文件,在弹出的对话框中点选到C:\\Windows\\Minidump文件夹,单击我们要分析的蓝屏文件,单击打开。
7、接下来就是对文件进行分析,这需要一定的经验和知识。
这里我们着重可以看一下System Uptime(开机时间)和Probably Caused By(可能引起故障的原因是)。
8、需要进一步分析,可以单击!analyze -v9、可以从中提取到蓝屏错误代码和引起蓝屏的程序名称,再通过网络搜索这些程序名和代码等方式弄清原因。
以上就是蓝屏修复工具Windbg使用教程的全部内容,通过使用Windbg,我们就能比较容易的确定导致电脑蓝屏的原因了。
windbg使用方法
windbg使用方法Windbg是一款由微软公司开发的调试工具,它可以帮助开发人员分析和诊断Windows操作系统和应用程序的问题。
本文将介绍Windbg的基本使用方法,希望能够帮助读者更好地利用这个工具进行调试和分析。
首先,我们需要了解如何安装Windbg。
通常情况下,Windbg是作为Windows驱动程序开发工具包(Windows Driver Kit)的一部分发布的,也可以在微软的官方网站上下载到独立安装包。
安装完成后,我们可以在开始菜单或者安装目录中找到Windbg的可执行文件。
接下来,我们需要了解如何打开并配置Windbg。
在打开Windbg 后,我们可以通过“文件”菜单中的“符号文件路径”选项来设置符号文件的路径,以便Windbg能够正确地加载符号文件。
符号文件对于调试非常重要,它包含了源代码和可执行文件之间的映射关系,能够帮助我们更好地理解程序的运行状态。
在Windbg中,我们可以通过“文件”菜单中的“打开转储文件”选项来打开需要分析的转储文件(dump file)。
转储文件是程序崩溃时生成的一种内存快照,包含了程序崩溃时的内存状态和调用栈信息。
通过分析转储文件,我们可以找出程序崩溃的原因,并进行相应的调试和修复。
除了分析转储文件外,我们还可以通过“调试”菜单中的“附加到进程”选项来附加到正在运行的进程,以实时地监视和分析程序的运行状态。
这对于调试一些无法通过转储文件分析的问题非常有帮助,比如内存泄漏、死锁等问题。
在Windbg中,我们可以使用各种命令来进行调试和分析。
比如,通过“!analyze”命令可以自动分析转储文件,并给出可能的崩溃原因;通过“kb”命令可以查看当前线程的调用栈信息;通过“!heap”命令可以查看进程的堆内存分配情况等等。
熟练掌握这些命令对于高效地进行调试和分析非常重要。
除了命令之外,Windbg还提供了丰富的调试工具,比如内存窗口、寄存器窗口、线程窗口等,这些工具可以帮助我们更直观地了解程序的运行状态。
Windbg调试驱动

be[id] 启用断点,e=Enable,id为断点编号
来个简单的实践过程,步骤如下:
1.编译好你的驱动,假设名为ShowSSDT.sys,并把驱动符号文件ShowSSDT.pdb发送到MySysSymbols文件夹下(之前设定的自己的调试符号文件夹)
键入!thread和Kp,查看当前的线程详细信息和堆栈(或者Alt+6也可以看stack).
!process [PID] 0, 查到当前进程:
ቤተ መጻሕፍቲ ባይዱ
在lm命令列出的信息中,start是模块的起始地址,通过键入"u 驱动起始地址",我们可以反汇编出它的代码
fffff800`044d51b2 4c8d1587e72300 lea r10,[nt!KeServiceDescriptorTable (fffff800`04713940)]
6.把ShowSSDT.sys拖到虚拟机中,在虚拟机系统中启动InstDrv,加载此驱动
7.回到Windbg窗口,如果一切正常的话,你会看到已经中断在ShowSSDT.sys的入口代码处了
接下来,要单步还是要下断点、要继续执行什么的,就全由你来作主了~~
指定需要查看的变量的名字
dv /V VariableName
fffff800`044d51b9 4c8d1dc0e72300 lea r11,[nt!KeServiceDescriptorTableShadow (fffff800`04713980)]
bl 列出所有断点,L=List
bc[id] 清除断点,c=Clear,id是bl查看时的断点编号
2.启动虚拟机,选择调试方式进入系统
- 1、下载文档前请自行甄别文档内容的完整性,平台不提供额外的编辑、内容补充、找答案等附加服务。
- 2、"仅部分预览"的文档,不可在线预览部分如存在完整性等问题,可反馈申请退款(可完整预览的文档不适用该条件!)。
- 3、如文档侵犯您的权益,请联系客服反馈,我们会尽快为您处理(人工客服工作时间:9:00-18:30)。
Debugging Windows Applications with IDA WinDbg PluginCopyright 2011 Hex-Rays SA Quick overview:The Windbg debugger plugin is an IDA Pro debugger plugin that uses Microsoft's debugging engine (dbgeng) that is used by Windbg, Cdb or Kd.To get started, you need to install the latest Debugging Tools from Microsoft website:/whdc/devtools/debugging/installx86.mspxor from the Windows SDK / DDK package.Please make sure you should install the x86 version of the debugging tools which is used by both IDA Pro and IDA Pro 64. The x64 version will NOT work.After installing the debugging tools, make sure you select « Debugger / Switch Debugger » and select the WinDbg debugger.Also make sure you specify the correct settings in the “Debugger specific options” dialog:•User mode: Select this mode for user mode application debugging (default mode)•Kernel mode: Select this mode to attach to a live kernel.•Non Invasive debugging: Select this mode to attach to a process non-invasively•Output flags: These flags tell the debugging engine which kind of output messages to display and which to omit•Kernel mode debugging with reconnect and initial break: Select this option when debugging a kernel and when the connection string contains 'reconnect'. This option will assure that the debugger breaks as soon as possible after a reconnect.To make these settings permanent, please edit the IDA\cfg\dbg_windbg.cfg file.To specify the debugging tools folde r you may add to the PATH environment variable the location of Windbg.exe or edit %IDA%\cfg\ida.cfg and change the value of the DBGTOOLS key.After the debugger is properly configured, edit the process options and leave the connection string value empty because we intend to debug a local user-mode application.Now hit F9 to start debugging:The Windbg plugin is very similar to IDA Pro's Win32 debugger plugin, nonetheless by using the former, one can benefit from the command line facilities and the extensions that ship with the debugging tools.For example, one can type “!chain” to see the registered Windbg extensions:“!gle” is another command to get the last error value of a given Win32 API call.Another benefit of using the Windbg debugger plugin is the use of symbolic information. Normally, if the debugging symbols path is not set, then the module window will only show the exported names. For example kernel32.dll displays 1359 names:Let us configure a symbol source by adding this environment variable before running IDA: set _NT_SYMBOL_PATH=srv*C:\Temp\pdb*/download/symbols It is also possible to set the symbol path directly while debugging:and then typing “.reload /f” to reload the symbols.Now we try again and notice that more symbol names are retrieved from kernel32.dll:Now we have 5818 symbols instead!It is also possible to use the “x” command to quickly search for symbols:(Looking for any symbol in any module that contains the word “continue”)Debugging a remote process:We have seen how to debug a local user mode program, now let us see how to debug a remote process. First let us assume that “pcA” is the target machine (where we will run the debugger server and the debugged program) and “pcB” is the machine where IDA Pro and the debugging tools are installed. To start a remote process:•On “pcA”, type:dbgsrv -t tcp:port=5000(change the port number as needed)•On “pcB”, setup IDA Pro and Windbg debugger plugin:◦“Application/Input file”: these should contain a path to the debuggee residing in “pcA”◦Connection string: tcp:port=5000,server=pcANow run the program and debug it remotely.To attach to a remote process, use the same steps to setup “pcA” and use the same connection string when attaching to the process.More about connection strings and different protocols (other than TCP/IP) can be found in “debugger.chm” in the debugging tools folder.Debugging the kernel with VMWare:We will now demonstrate how to debug the kernel through a virtual machine.In this example we will be using VMWare 6.5 and Windows XP SP3.Configuring the virtual machine:Run the VM and then edit “c:\boot.ini” file and add one more entry (see in bold):[operating systems]multi(0)disk(0)rdisk(0)partition(1)\WINDOWS="Microsoft Windows XP Professional"/noexecute=optin /fastdetectmulti(0)disk(0)rdisk(0)partition(1)\WINDOWS="Local debug" /noexecute=optin /fastdetect/debug /debugport=com1 /baudrate=115200For MS Windows Vista please see: /en-us/library/ms791527.aspxp Actually the last line is just a copy of the first line but we added the “/debug” switch and some configuration values.Now shutdown the virtual machine and edit its hardware settings and add a new serial port with option “use named pipes”:Press “Finish” and start the VM. At the boot prompt, select “Local debug” from the boot menu:Configuring Windbg debugger plugin:Now run IDA Pro and select Debugger / Attach / WindbgThen configure it to use “Kernel mode” debugging and use the following connection string: com:port=\\.\pipe\com_1,baud=115200,pipeIt is possible to use the 'reconnect' keyword in the connection string:com:port=\\.\pipe\com_1,baud=115200,pipe,reconnectAlso make sure the appropriate option is selected from the debugger specific options.Please note that the connection string (in step 1) refers to the named pipe we set up in the previous steps.Finally, press OK to attach and start debugging.When IDA attaches successfully, it will display something like this:If you do not see named labels then try checking your debugging symbols settings.Note: In kernel mode IDA Pro will display one entry in the threads window for each processor. For example a two processor configuration yields:VMWare configurationThreads in IDAThis screenshot shows how we are debugging the kernel and changing the disassembly listing (renaming stack variables, or using structure offsets):At the end you can detach from the kernel and resume it or detach from the kernel and keep it suspended.To detach and resume, simply select the “Debugger / Detach”, however to detach and keep the kernel suspended select “Debugger / Terminate Process”.Debugging the kernel through kdsrv.exeIn some cases, when debugging a 64bit kernel using a 1394 cable then 64bit drivers are needed, thus dbgeng (32bits) will not work. To workaround this problem we need to run the kernel debugger server from the x64 debugging tools folder and connect to it:•Go to “Debugging Tools (x64)” installation•Run kdsrv.exe (change the port number/transport appropriately):◦kdsrv -t tcp:port=6000•Now run ida64 and specify the following connection string (change the transport value appropriately):◦kdsrv:server=@{tcp:port=6000,server=127.0.0.1},trans=@{com:port=\\.\pipe\com_3,bau d=115200,pipe}。