统计学专业论文参考文献
统计学优秀毕业论文范文(必备12篇)
统计学优秀毕业论文范文(必备12篇)《Mind on statistics(英文版)》 BrooksCole出版社只需要高中的数学水平,统计的扫盲书。
有一句话影响很深:Mathematics as to statistics is something like hammer, nails, wood as to a house, it's just the material and tools but not the house itself。
《Mathematical Statistics and Data Analysis(英文版.第二版)》Cengage Learning , Inc出版社看了就发现和国内的数理统计树有明显的不同。
这本书理念很好,讲了很多新的东西,把很热门的Bootstrap方法和传统统计在一起讲了。
Amazon上有书评。
《统计学》David Freedman等著,魏宗舒,施锡铨等译中国统计出版社据说是统计思想讲得最好的一本书,读了部分章节,受益很多。
整本书几乎没有公式,但是讲到了统计思想的精髓。
《Understanding Statistics in the behavioral science(影印版)》中国统计出版社和上面那本是一个系列的。
老外的书都挺有意思的。
《探索性数据分析》中国统计出版社和第一本是一个系列的。
大家好好看看陈希儒老先生做的序,可以说是对中国数理统计的一种反思。
《Business Statistics a decision making approach(影印版)》中国统计出版社在实务中很实用的东西,虽然往往为数理统计的老师所不屑《应用线性回归》中国统计出版社还是著名的蓝皮书系列,有一定的深度,道理讲得挺透的。
看看里面对于偏回归系数的说明,绝对是大开眼界啊!非常精彩的书《Logistics回归模型――方法与应用》王济川郭志刚高等教育出版社不多的国内的经典统计教材。
统计学专业论文范文(2)

统计学专业论文范文(2)统计学专业论文范文篇3论文摘要:统计分析是运用统计方法与分析对象有关的知识,从定量与定性的结合上进行的研究活动,是整个统计工作中的重要组成部分,在企业中发挥着巨大的作用,也是企业制定生产计划、发展战略与规划的主要依据。
论文关键词:统计分析企业发展一、统计分析的概述及其特点1.统计分析的概述统计分析是指运用统计方法及与分析对象有关的知识,从定量与定性的结合上进行的研究活动。
它是继统计设计、统计调查、统计整理之后的一项十分重要的工作,是在前几个阶段工作的基础上通过分析从而达到对研究对象更为深刻的认识。
它又是在一定的选题下,集分析方案的设计、资料的搜集和整理而展开的研究活动。
系统、完善的资料是统计分析的必要条件。
2.统计分析的特点运用统计方法、定量与定性的结合是统计分析的重要特点。
随着统计方法的普及,不仅统计工作者可以进行统计分析,各行各业的工作者都可以运用统计方法进行统计分析。
只将统计工作者参与的分析活动称为统计分析的说法严格说来是不正确的。
提供高质量、准确而又及时的统计数据和高层次、有一定深度、广度的统计分析报告是统计分析的产品。
从一定意义上讲,提供高水平的统计分析报告是统计数据经过深加工的最终产品。
(1)运用统计方法:统计方法是以总体现象的数量关系为对象的一类特殊科学研究方法的总称,从运用的角度可分为经验方法和数学方法。
经验方法是指人们长期的统计实践经验相关的方法。
在统计分析中常用的数量比较法、分组分析法、指数及因素分析法等就属于这一类。
对于这一类方法如能正确运用,可以提高统计分析的科学性。
(2) 定量与定性的结合:统计分析面对的不是抽象的数字,而是在定性分析的前提下。
通过其数量表现对研究对象进行认识。
因此,熟悉和掌握与研究对象有关的知识是十分必要的。
二、统计分析在企业中的运用统计分析在一个企业的运转中发挥着举足轻重的作用。
从统计认识的全过程来看,通过统计设计、调查和初步整理所取得的统计资料,可以对客观现象总体的数量特点取得一定的认识。
统计学专业毕业论文参考文献

统计学专业毕业论文参考文献在一篇统计学的论文中,引用参考文献论证自己的观点或者理念是十分必要的。
下面是店铺带来的关于统计学论文参考文献的内容,希望能对大家有所帮助,欢迎阅读参考!统计学论文参考文献(一)[1]苏伟,聂宜民,胡晓洁,李强,张建国.农田土壤微量元素的空间变异及Kriging估值[J].华中农业大学学报.2004(02)[2]詹绍康.正确应用相关回归分析[J].劳动医学.1997(04)[3]颜艳,徐勇勇.统计思想是第一位的--教育部面向21世纪课程教材《医学统计学》评介之一[J].中国卫生统计.2001(04)[4]胡良平.医学实验中常见设计类型的辨析及统计方法的合理选用[J].中国应用生理学杂志.2000(01)[5]方积乾,凌莉,张敏瑞.近期医学论文中常见统计错误及其纠正[J].中山医科大学学报.1999(04)[6]程萍,祖述宪.临床医学论文统计方法应用的调查分析[J].安徽医科大学学报.1998(02)[7]王倩,张博恒.五种中华医学会系列杂志论着中统计方法的应用现况[J].中华医学杂志.1998(03)[8]刘勤,金丕焕主编.分类数据的统计分析及SAS编程[M].复旦大学出版社,2002[9]陈峰编着.医用多元统计分析方法[M].中国统计出版社,2000[10]孙尚拱编着.医学多变量统计与统计软件[M].北京医科大学出版社,2000[11]胡良平主编.医学统计应用错误的诊断与释疑[M].军事医学科学出版社,1999[12]毛宗福,丁元林,陈东峨,张金荣,王圣基.临床论着中统计推断应用缺陷特征及对策[J].中国卫生统计.1998(03)[13]胡良平主编.现代统计学与SAS应用[M].军事医学科学出版社,1996[14]胡良平.医学科研与新药评价等工作中一个不可忽视的问题--轻视和误用统计学[J].军事医学科学院院刊.1996(03)[15]胡良平.充分了解资料的特点是进行统计分析的首要前提[J].中国卫生统计.1988(06)统计学论文参考文献(二)[1]蔡立梅,马瑾,周永章,黄兰椿,窦磊,张澄博,付善明.东莞市农业土壤重金属的空间分布特征及来源解析[J].环境科学.2008(12)[2]钟晓兰,周生路,赵其国,李江涛,廖启林.长三角典型区土壤重金属有效态的协同区域化分析、空间相关分析与空间主成分分析[J].环境科学.2007(12)[3]张仁铎着.空间变异理论及应用[M].科学出版社,2005[4]张建同,孙昌言编着.以Excel和SPSS为工具的管理统计[M].清华大学出版社,2005[5]王政权编着.地统计学及在生态学中的应用[M].科学出版社,1999[6]李小建主编.经济地理学[M].高等教育出版社,1999[7]王政权编着.地统计学及在生态学中的应用[M].科学出版社,1999[8]杜瑞成,闫秀霞主编.系统工程[M].机械工业出版社,1999[9]侯景儒等编着.实用地质统计学[M].地质出版社,1998[10]陈静生,周家义主编.中国水环境重金属研究[M].中国环境科学出版社,1992[11]国家环境保护局主持,中国环境监测总站主编.中国土壤元素背景值[M].中国环境科学出版社,1990[12]王仁铎,胡光道编.线性地质统计学[M].地质出版社,1988[13]史舟,李艳,程街亮.水稻土重金属空间分布的随机模拟和不确定评价[J].环境科学.2007(01)[14]乔胜英,蒋敬业,向武,唐俊红.武汉地区湖泊沉积物重金属的分布及潜在生态效应评价[J].长江流域资源与环境.2005(03)[15]张丽旭,任松,蔡健.东海三个倾倒区表层沉积物重金属富积特征及其潜在生态风险评价[J].海洋通报.2005(02)统计学论文参考文献(三)[1] 冯克忠,万庆,励惠国. 基于组件技术的GIS广义空间分析[J]. 地球信息科学. 2003(01)[2] 陈斐,杜道生. 空间统计分析与GIS在区域经济分析中的应用[J]. 武汉大学学报(信息科学版). 2002(04)[3] 肖斌,赵鹏大,陈玉玲,侯景儒. 时空多元协同克立格的理论研究[J]. 物探化探计算技术. 1998(01)[4] 毛政元,李霖着.空间模式的测度及其应用[M]. 科学出版社,2004[5] 刘阳. 基于地统计学的县/团区域土壤养分空间变异研究[D]. 新疆农业大学 2006[6] 杨中庆. 基于R语言的空间统计分析研究与应用[D]. 暨南大学2006[7] 杨红芳. 基于合理城市空间模式的杭州适度人口规模研究[D]. 浙江大学 2007[8] 冯锦霞. 基于GIS与地统计学的土壤重金属元素空间变异分析[D]. 中南大学 2007[9] 陈述彭主编.地学信息图谱探索研究[M]. 商务印书馆, 2001[10] 刘昌明,岳天祥,周成虎主编,朱海燕,刘卓澄责任编辑.地理学的数学模型与应用[M]. 科学出版社, 2000[11] 王政权编着.地统计学及在生态学中的应用[M]. 科学出版社,1999[12] 李小建主编.经济地理学[M]. 高等教育出版社, 1999[13] 侯景儒等编着.实用地质统计学[M]. 地质出版社, 1998[14] 郭仁忠着.空间分析[M]. 武汉测绘科技大学出版社, 1997[15] 徐建华编着.现代地理学中的数学方法[M]. 高等教育出版社,1996。
统计学文献24
Introduction
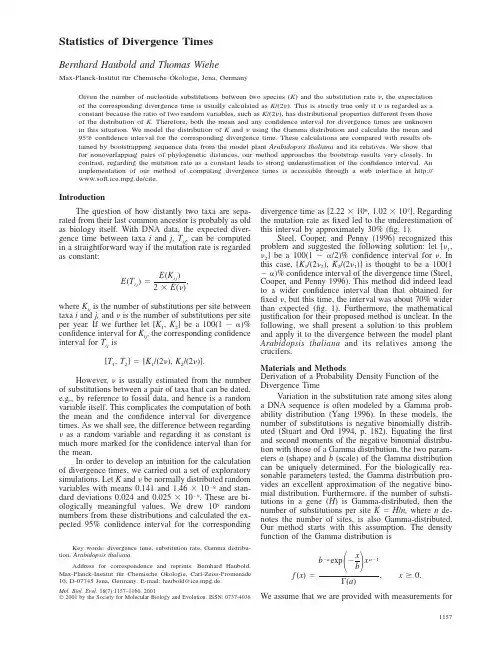
The question of how distantly two taxa are separated from their last common ancestor is probably as old as biology itself. With DNA data, the expected divergence time between taxa i and j, Tij, can be computed in a straightforward way if the mutation rate is regarded as constant:
In order to develop an intuition for the calculation of divergence times, we carried out a set of exploratory simulations. Let K and be normally distributed random variables with means 0.141 and 1.46 ϫ 10Ϫ8 and standard deviations 0.024 and 0.025 ϫ 10Ϫ9. These are biologically meaningful values. We drew 105 random numbers from these distributions and calculated the expected 95% confidence interval for the corresponding
Statistics of Divergence Times
Bernhard Haubold and Thomas Wiehe
统计学专业优秀毕业论文范本经济数据的时间序列分析与

统计学专业优秀毕业论文范本经济数据的时间序列分析与预测在统计学专业的毕业论文中,经济数据的时间序列分析与预测是一个重要的研究方向。
本文将为大家提供一个优秀的论文范本,以展示在统计学专业中,如何进行经济数据的时间序列分析与预测。
一、引言经济数据是经济学研究的基础,而时间序列分析和预测是处理经济数据的重要方法之一。
时间序列分析旨在通过对历史数据的观察和分析,揭示数据内在的规律和趋势,为未来经济变化提供预测依据。
因此,时间序列分析在经济学中具有重要的研究价值和实际应用意义。
二、数据收集与整理经济数据的时间序列分析首先需要收集和整理相关的数据集。
收集数据的来源可以包括政府部门、研究机构、行业协会等。
在数据整理过程中,需要对数据进行清洗、处理异常值和缺失值,并将数据进行合适的时间区间划分。
三、时间序列模型的选择与建立时间序列模型是进行时间序列分析和预测的数学工具。
在选择时间序列模型时,需要根据数据的性质和特点进行合理的选择。
常用的时间序列模型包括ARMA模型、ARCH模型、GARCH模型等。
根据数据的特征,可以通过模型的拟合度、残差检验等指标进行模型的选择与建立。
四、模型参数估计与检验在时间序列模型建立完成后,需要对模型的参数进行估计和检验。
常用的参数估计方法包括极大似然估计、最小二乘估计等。
而模型的检验则可以通过残差分析、模型拟合度检验、序列平稳性检验等指标进行。
五、时间序列预测与评估时间序列预测是时间序列分析的重要任务之一。
通过对历史数据的观察和模型的建立,可以利用已有的信息对未来的经济发展进行预测。
常用的时间序列预测方法包括平滑法、回归法、ARIMA模型等。
在进行时间序列预测时,需要对预测结果进行评估,包括均方误差、平均绝对误差等指标。
六、实证分析与结果讨论在论文中,应该选取合适的经济数据进行实证分析,并对实证分析的结果进行详细的讨论和解释。
可以对模型的拟合度、稳定性、预测准确度等进行分析,并结合实际情况进行解释和推论。
3统计学文献
ÓBoard of the Foundation of the Scandinavian Journal of Statistics2006.Published by Blackwell Publishing Ltd,9600Garsington Road,Oxford OX42DQ,UK and350Main Street,Malden,MA02148,USA Vol33:169–190,2006Inference on Survival Data with Covariate Measurement Error–An Imputation-based ApproachYI LI and LOUISE RYANDepartment of Biostatistics,Harvard UniversityABSTRACT.We propose a new method forfitting proportional hazards models with error-pronecovariates.Regression coefficients are estimated by solving an estimating equation that is theaverage of the partial likelihood scores based on imputed true covariates.For the purpose ofimputation,a linear spline model is assumed on the baseline hazard.We discuss consistency andasymptotic normality of the resulting estimators,and propose a stochastic approximation schemeto obtain the estimates.The algorithm is easy to implement,and reduces to the ordinary Coxpartial likelihood approach when the measurement error has a degenerate distribution.Simulationsindicate high efficiency and robustness.We consider the special case where error-prone replicatesare available on the unobserved true covariates.As expected,increasing the number of replicatesfor the unobserved covariates increases efficiency and reduces bias.We illustrate the practicalutility of the proposed method with an Eastern Cooperative Oncology Group clinical trial where agenetic marker,c-myc expression level,is subject to measurement error.Key words:bootstrap,covariate measurement error,Cox models,imputed partial likelihoodscore1.IntroductionAnalyses of survival data are often hampered by the presence of covariate measurement error.For example,in clinical trials,many biomarkers,such as blood pressure(Carroll et al.,1995)and CD4counts(Tsiatis et al.,1995),are subject to measurement error,and in nutritional studies,fat intake is often measured with error(Carroll et al.,1995).A large body of literature has been devoted to the measurement error problem within the propor-tional hazard model framework.Prentice(1982)has shown that the induced hazard function conditional on the observed covariates is also a multiplicative hazard model,but having a complicated form;consequentlyfitting the naive model by directly using the contaminated covariates will typically lead to biases.Several remedy methods have been proposed recently.Likelihood-based approaches,where the distribution of unobserved covariates is fully parametrically,semiparametrically and non-parametrically specified have been considered by Hu et al.(1998).From perspectives of estimating equation,Huang&Wang(2000),and Tsiatis&Davidian(2001)(whose method is asymptotically equivalent to that of Nakamura, 1992)have considered asymptotically consistent corrected partial likelihood approaches.Their methods are robust with respect to the assumptions on the unobserved covariates or measurement error.In all these aforementioned methods,the cumulative baseline hazards are non-parametri-cally estimated by step functions with jumps at distinct failure times.Though they are robust with respect to misspecification in the baseline hazards,the number of unknown parameters which need to be estimated increase with number of events.Hence,the computation may be complex and the efficiency may be low.A naive alternative is to consider a fully parametric model,with all the baseline hazards and the distribution of unknown covariates specified,and carry out a parametric maximum likelihood estimation,which shall yield consistent and themost efficient estimates under the correct model.However,the estimates are generally biased when the model is misspecified.In view of these difficulties and along the line of the impu-tational methods introduced by Satten et al.(1998)for interval censored data,and by Li et al. (2003)for clustered survival data,this article proposes a method that is intermediate between the fully parametric and non-parametric approaches for survival data with covariate meas-urement error.A linear spline model is assumed on the baseline hazard,but it is only used to impute the unobserved error prone covariates.Once the baseline distribution is specified,the distribution of true covariates conditional on the observed data can be calculated.A new estimating equation can be obtained by averaging the score equation for the Cox partial likelihood with respect to the conditional distribution of unobserved true covariates,given observed data.We propose to use this average partial likelihood score equation for estimating regression parameters,and give closed-form estimators of the sampling variance of our pro-posed estimators.The algorithms are easy to implement,and reduces to the ordinary Cox partial likelihood approach,when the measurement error has a degenerate distribution.Si-mulations indicate high efficiency and robustness of the estimates obtained by the proposed method.As expected,increasing the number of replicates for the unobserved covariates increases efficiency and reduces bias.The rest of the article is structured as follows.In sections2and3,we state the model and derive an average partial likelihood score equation.We show in section4,asymptotic results and outline in section5a stochastic approximation scheme for constructing the estimates.In section6,we assess via simulation thefinite sample performance of the proposed methods,and in section7,we apply the methods to the analysis of a published clinical trial(Augenlicht et al.,1997)in colon cancer.We conclude with general discussion in section8.2.Imputed partial likelihood score equationLet V i and C i be failure and censoring times,respectively,for subject i,i¼1,...,m.Suppose for each subject,an error-free covariate vector Z i(r1Â1),and an error-prone covariate vector X i(r2Â1),where r1þr2¼r,are of interest.We suppose that the X i are not directly observable,but instead,multiple error-prone replicates,W i¼(W i1,...,W ini),are observed, where the number of replicates n i is an i.i.d.random variable taking positive integer values and is independent of X i.We assume that the C i are independently and identically distributed and independent of the V i and X i,conditional on Z i.The observed data are right censored with only T i¼min f V i,C i g and the censoring code d i¼I(V i C i)observed,where I(Æ)denotes an indicator function. Introduce the counting process N i(t)¼I(T i t,d i¼1),and the at-risk process Y i(t)¼I(T i!t).Our model specifies that,conditional on the true covariates Z i and X i,the counting process N i(t)has an intensity function following the proportional hazards model(Cox,1972),lim D t!0þ1D tP f N iðtþD tÞÀN iðtÞ¼1j X i;Z i;N iðsÞ;Y iðsÞ;0s t g¼k0ðtÞY iðtÞexpðX0i b xþZ0i b zÞ;ð1Þwhere b x and b z are the vectors offixed effects and k0(t)is an unknown baseline hazard function.This model is completed by adding a classical non-differential measurement error structure (Carroll et al.,1995),W ij¼X iþU ij;ð2Þwhere the U ij are assumed independent of X i,Z i,and are i.i.d.with a normal distributionN(0,R u).Here non-differentiality indicates the conditional law L(T i,d i|X i,W i,Z i)¼170Y.Li and L.Ryan Scand J Statist33L (T i ,d i |X i ,Z i ),implying that,conditional on the true unobserved covariate X i ,the observed replicates W i do not contain additional information about the survival outcome (T i ,d i ).In what follows,we assume that the unobserved covariates X i are time-invariant and are i.i.d.with a known conditional density function f x |z (X |Z )or conditional distribution function F x |z (X |Z ).It is common in practice to postulate a normal distribution N (l x |z ,R x |z )(Carroll et al .,1995).For notational convenience,we denote X ¼(X 1,...,X m ),Z ¼(Z 1,...,Z m ),and likewise for W ,T ,D ,N (t )and Y (t ).Write W i ¼P n i j ¼1W ij =n i ,and W ¼ð W 1;...; W m Þ.Under model (2)and non-differentiality of measure error, Wi is a sufficient statistic for X i conditional on T i ,d i and Z i .Hence,for convenience,we will work with Wi ; W in lieu of W i ,W ,hereafter.Throughout,unless otherwise specified,F (Æ)represents a distribution function,f (Æ)is a density function,and expectations are taken conditionally on the observed covariates Z .Following Cox (1972),if X were observed,one would be able to estimate b ¼(b x ,b z )from the Ôcomplete Õdata partial likelihood score functionS ðT ;D ;X ;Z ;b Þ¼Xm i ¼1Z s 0Z Ãi ÀS ð1Þðt ;Z Ã;b ÞS ðt ;Z Ã;b Þ()d N i ðt Þ;ð3Þwhere Z üðZ Ã1;...;Z Ãm Þ;Z Ã0i ¼ðX 0i ;Z 0i Þ,S ðl Þðt ;Z Ã;b Þ¼P m i ¼1Z à l i Y i ðt Þexp ðZ Ã0i b Þ,ands <1is a constant such that pr(C i >s )>0.In practice,s is usually the study duration.Here,for a vector u ,u l ¼uu 0if l ¼2,u l ¼u if l ¼1,and u l ¼1if l ¼0.However,as X is not observerable,the Ôcomplete Õdata partial likelihood function (3)is not calculable.Instead,we propose to estimate b from an average partial likelihood function,which is the conditional expectation of S (T ,D ,X ,Z ;b )with respect to X over the observed quantities,i.e.the observed survival information,the observed covariates Z and the error-prone covariates W.Explicitly,we introduce S f b ;k 0ðÁÞg ¼E f S ðT ;D ;X ;Z ;b Þj T ;D ; W ;Z ;b ;k 0ðÁÞg :ð4ÞDenote by b 0and ~k 0ðÁÞ,the true values of b and k 0(Æ),ing a double expec-tation theorem (e.g.Fleming &Harrington,1991,p.22),we can show thatE ½S f b 0;~k 0ðÁÞg ¼0ð5Þunder b 0and ~k 0ðÁÞ.As a result,S f b ;~k 0ðÁÞg ¼0is indeed an unbiased estimating equation for b ,given the true value of the baseline hazard function.The form of (4)thus motivates us to regard the unobserved true covariates as Ômissing Õcovariates,to impute them by simulating from the conditional distribution,and to use the imputed values to construct an unbiased estimating equation;we term this simulated version of (4)an imputed partial likelihood equation .Indeed,data augmentation by imputing unob-served quantities has drawn large attention in recent years,and multiple imputation has become a general approach to handle missing values in regression models (see,e.g.Rubin,1987;Rubin &Schenker,1991).We also remark that this proposed imputation-based methodology can easily handle the presence of interactions between the error-free and error-prone covariates,which has been rarely explored in the existing literature.3.Construction of the estimating equationThe conditional score function (4)can be written asScand J Statist 33Imputation for contaminated covariates 171Z S ðT ;D ;X ;Z ;b ;Þd F f X j T ;D ; W;Z ;b ;k 0ðÁÞg ;where the conditional distribution of X ,F has a product formF f X j T ;D ; W ;Z ;b ;k 0ðÁÞg ¼Ym i ¼1F f X i j T i ;d i ; Wi ;Z i ;b ;k 0ðÁÞg :To fully specify this conditional distribution,instead of considering the baseline hazard function k 0(Æ)in an infinite dimensional space,we impose a local parametric form on it.That is,we assume a piecewise-linear spline model for the log baseline hazard function:log k 0ðt ;g Þ¼g 1þg 2t þg 3ðt Às 1ÞþÁÁÁþg q ðt Às q À2Þþ;ð6Þwith knots fixed at 0 s 0<s 1<ÁÁÁ<s q À2.x þ¼max(x ,0),and g ¼(g 1,...,g q ).In practice,the choice of knots should be data-driven,e.g.by the criteria of AIC or BIC,and Cai et al .(2002)recommend choosing knots densely to allow for a detailed study for the structure of the baseline hazard function.In our particular setting (for the purpose of imputation),we found that a relatively small number of knots suffice,especially when the underlying hazard is relatively smooth.Our later simulations confirm this.Under model (2)and the normality assumption on measurement error,we can writed F f X i j T i ;d i ; W i ;Z i ;b ;k 0ðÁ;g Þg ¼L ðT i ;d i j X i ;Z i ;b ;g Þ/ð W i ;X i ;R u =n i Þd F x j z ðX i j Z i ÞL ðT i ;d i ; W i j Z i ;b ;g Þ;ð7Þwhere /(Æ;l ,R )is the density function for a multivariate normal random variable N (l ,R )and L (T i ,d i |X i ,Z i ;b ,g )is the conditional likelihood for the i th subject given the covariate X i under (1)and (6),i.e.L ðT i ;d i j X i ;Z i ;b ;g Þ¼k d i 0ðT i ;g Þexp d i ðX 0i b x þZ 0i b z ÞÀK 0ðT i ;g ÞeX i b x þZ 0i b z n o ;ð8Þand L ðT i ;d i ; Wi j Z i ;b ;g Þis the marginal likelihood for the observed data ðT i ;d i ; W i Þ.That is L ðT i ;d i ; W i j Z i ;b ;g Þ¼Z L ðT i ;d i j X i ;Z i ;b ;g Þ/ð W i ;X i ;R u =n i Þd F x j z ðX i j Z i Þ;ð9Þwhich follows from the non-differentiality of the assumed measurement error.In (8)the cumulative baseline hazard K 0ðt ;g Þ¼R t 0k 0ðs ;g Þd s .For notational ease,we rewriteS f b ;k 0ðÁ;g Þg ¼S ðb ;g Þ:ð10ÞAs g is unknown,we resort to a full likelihood maximization to obtain an estimate.Specifically,given an estimate of b ,we solve for g from the following log likelihood score equationU ðb ;g Þ¼Xm i ¼1U ðT i ;d i ; W i ;Z i ;b ;g Þ¼X m i ¼1@@g log L ðT i ;d i ; W i j Z i ;b ;g ÞÈÉ;ð11Þwhere L (Æ)is defined at (9).The aforementioned scheme is equivalent to obtaining estimates for b and g by simul-taneously solving172Y.Li and L.Ryan Scand J Statist 33S ðb ;g ÞU ðb ;g Þ ¼0:ð12ÞUnder model (1)with k 0(t ;g )correctly specified and by the usual properties of maximum likelihood estimation,the estimating equations (12)are unbiased,and,consequently,would be expected to yield consistent estimates.Even when k 0(t ;g )is incorrectly specified,we may expect that (10)is less sensitive to such misspecification than is the observed data likelihood score obtained by differentiating (9)with respect to b ,because the Ôcomplete Õdata partial likelihood score S (T ,D ,X ,Z ;b )is independent of the baseline distribution.A similar observation was made by Satten et al .(1998),who imputed unobserved failure times in the context of independent interval-censored survival data by specifying a Weibull model on the baseline hazard.We study this more analytically in section 4and conduct simulations in section 7to verify the theoretical results.4.Asymptotic theory and robustness analysisDenote by ~b0,the true value of the regression coefficient b .With the assumption that (T i ,d i ,X i ,Z i )are i.i.d.,Lin &Wei (1989)have shown that the Ôcomplete Õdata partial likelihoodscore S ðT ;D ;X ;Z ;~b0Þcan be represented,up to o p (1),as an i.i.d.sum.That is,m À1=2S ðT ;D ;X ;Z ;~b0Þ¼m À1=2X m i ¼1n ðT i ;d i ;X i ;Z i ;~b 0Þþo p ð1Þ;ð13Þwheren ðT i ;d i ;X i ;Z i ;b Þ¼d i Z Ãi Às ð1ÞðT i ;b Þs ð0ÞðT i ;b Þ&'Àe Z Ã0i b Z T i 0Z Ãi Às ð1Þðt ;b Þs ð0Þðt ;b Þ&'d G ðt Þs ð0Þðt ;b Þ:Here,G (t )¼E f N i (t )g ,and s (l )(t ;b )¼E fS (l )(t ,Z Ã;b )g for l ¼0,1,2,where the expecta-tion is taken with respect to the true (but unspecified)distribution distribution of (N ,Y ,X ,Z ).Denote by c ¼(b ,g ),the collection of unknown parameters.Following the proof of Datta et al .(2000)and Li et al .(2003),we further show that in a small neighborhood of c the term-wise integration of (13)is allowable,enabling us to writem À1=2S ðc Þ¼m À1=2Xm i ¼1w ðT i ;d i ; W i ;Z i ;c Þþo p ð1Þ;ð14Þwhere S (Æ)is defined in (10)and w ðT i ;d i ; Wi ;Z i ;c Þ¼R n ðT i ;d i ;X i ;Z i ;b ÞÂd F f X i j T i ;d i ; Wi ;Z i ;b ;k 0ðÁ;g Þg :Hence,we are able to approximate the average partial likelihood score with respect to the conditional distribution of unobserved covariates using a sum of i.i.d.random variables.Denote by c 0¼(b 0,g 0)the solution to the following equation:E w ðT i ;d i ; W i ;Z i ;c Þ@@glog L ðT i ;d i ; W i j Z i ;c ÞÈÉ ¼0;ð15Þwhere the expectation is taken with respect to the true distribution distribution of (N ,Y ,X ,Z ,W ).Note when the baseline hazard k 0(t ;g )and the distribution of X ,W arecorrectly specified,b 0¼~b0,as the terms inside the braces of (15)are unbiased under the true parameters.Scand J Statist 33Imputation for contaminated covariates173When implementing the proposed estimating procedure,however,we might misspecify the baseline hazard function as well as the distribution functions of X,W and measurement error U.Hence the proposed estimates will incorporate some asymptotic bias.Theorem1shows that,under regularity conditions C1–C3(in the Appendix),the imputed partial likelihood estimates converge in probability to b0,the solution to(15),enabling the calculation of potential asymptotic biases.Theorem1There exists a sequence of solutions b c to(12)such that for any given >0,there exists a K<1 and an integer m0>0such that pr f b c2N K=ffiffiffim pðc0Þg!1À for any m!m0,where N q(c0)is the neighbourhood around c0with radius q.Using(14),it can be shown readily thatmÀ1=2f Sðc0Þ;Uðc0Þg!d Nð0;WÞ;ð16Þwhere W,the covariance matrix of wðT i;d i; W i;Z i;c0Þand UðT i;d i; W i;Z i;c0Þ,is defined later.Asymptotic properties of the solution to(12)follow in part from(16)and are summarized in theorem2.Theorem2Let b c be a solution to(12)that converges to c0in probability.Thenm1=2ðb cÀc0Þ!d Nð0;VÞ;where V¼AÀ1W(AÀ1)T,with W¼W11W12W012W22:Here,A is expectation of the Jacobian matrixof the score equations(12)andW11¼E f wðT i;d i; W i;Z i;c0ÞwðT i;d i; W i;Z i;c0Þ0g;W12¼E f wðT i;d i; W i;Z i;c0ÞUðT i;d i; W i;Z i;c0Þ0g;W22¼E f UðT i;d i; W i;Z i;c0ÞUðT i;d i; W i;Z i;c0Þ0g:We now compute the asymptotic bias from(15),wherein the expectation can be evaluated, for any measurable function g,byE f gðT i;d i; W i;Z iÞg¼X1d¼0Zgðt;d; w;zÞk dðt j x;zÞSðt j x;zÞc1ÀdcðtÞC d cðtÞf w j x;zð w j x;zÞf x;zðx;zÞd t d w d x d z;where k(t|x,z)[defined in(1)],Sðt j x;zÞ¼expðÀR tkðs j x;zÞd sÞare the true hazard functionand survival function,respectively,c c(t),C c(t)are the density and survival functions for the censoring time C,and f w j x;x;f x;z are the conditional density function of W and the joint density of X,Z,respectively.Numerical integration can be employed to evaluate this integral,if necessary.To illustrate bias patterns,we calculated the asymptotic biases for the imputed partial likelihood estimates(denoted by^b I)under the following settings:the true hazard kðt j xÞ¼k0ðtÞexpð~b0xÞ,where k0(t)¼0if t<1and2if t!1,x$N(0,1);censoring time C$U(0,4);the number of replicates per subject is n i 4.We varied the measurement errorvariance r2u from0.25to2and the regression coefficient~b0from0.25to2.For the purpose of174Y.Li and L.Ryan Scand J Statist33comparison we also calculated the asymptotic biases for the fully parametric maximum likelihood estimates (denoted by ^b L),converging in probability to the solution to the following equation.E @@b log L ðT i ;d i ; W i j Z i ;b ;g ÞÈÉ@@glog L ðT i ;d i ; W i j Z i ;b ;g ÞÈÉ !¼0:The relative biases (|bias|/true value)were computed and depicted in Fig.1for various measurement error variances and true regression parameter ~b 0.When calculating ^b I and ^b L ,we assumed a linear spline model on the baseline hazard log k 0(t ,g )¼g 1þg 2t þg 3(t À0.5)þ.The plot indicates the asymptotic biases for ^b I were small,when ~b 0was not too large (i.e.<1)and when the measurement error was moderate [the noise-signal ratioðr 2u =n i Þ=r 2x <0:25],in which cases the absolute asymptotic biases for ^b I were less than 0.20and the relative biases were below 12%.We also notice that,under the extreme cases,when ~b 0>0and the measurement error variance was as large as 2,the absolute asymptotic bias for ^b I was large,indicating that the proposed method may not work well.Under all the scenarios examined,the absolute asymptotic biases for the fully parametric MLE,^b L ,always exceeded those for ^b I .For example,when the measurement error variance was 2and ~b 0¼0:25,the relative bias for ^b L was À0.12compared with À0.04for ^b I .Note that even in the absence of0.5 1.0 1.5 2.0−0.8−0.6−0.4−0.20.0σu 2R e l a t i v e b i a s i n e s t i m a t i o n o f β IPLE (β~0=0.25)MLE (β~0=0.25)IPLE (β~0=1.00)MLE (β~0=1.00)IPLE (β~0=2.00)MLE (β~0=2.00)Fig.1.Asymptotic biases of ^b I ,the imputed partial likelihood estimates (IPLE),and ^b L ,the para-metric MLE,under various values of ~b 0and r 2u .The horizontal line is the zero-line,corresponding tono bias.Scand J Statist 33Imputation for contaminated covariates 175measurement error (r 2u ¼0),^b L was still biased (especially when ~b 0was as large as 2.0)because the baseline hazard function was misspecified.In contrast,our proposed imputation-based method reduces to the standard Cox proportional hazards analysis in the absence of measurement error,and hence incurs no bias.5.A stochastic approximation schemeIn practice,R u ,l x and R x will typically be unknown,but can be consistently estimated by moment estimators,when replicate data are available.For example,following Carroll et al .(1995),we have the following ffiffiffiffim p -consistent estimating equations:b l x ¼P m i ¼1P n i j ¼1W ij P m i ¼1n i ;b R u ¼P m i ¼1P n i j ¼1ðW ij À W i ÞðW ij À W i Þ0P m i ¼1ðn i À1Þ;andb R x ¼P mi ¼1n i ð W i Àb l x Þð W i Àb l x Þ0P m i ¼1n i:We rewrite (11)asU ðc Þ¼Z U ðT ;D ;X ;Z ;b ;g Þd F ðX j T ;D ; W;Z Þ;where U ðT ;D ;X ;Z ;b ;g Þ¼ð@=@g ÞP mi ¼1log L ðT i ;d i ;X i ;Z i ;b ;g Þ.Both U (c )and S (c )in (12)are multidimensional integral with respect to the conditional distributionF ðX j T ;D ; W;Z Þ.As neither F ðX j T ;D ; W ;Z Þnor f ðX j T ;D ; W ;Z Þhas a closed form,we propose to use a stochastic approximation (see,e.g.Gu &Zhu,2001),coupled with a sampling-importance resampling (SIR)scheme (McLachlan and Krishnan,1997,Ch.6),to evaluate U (c )and S (c )and solve (12).In contrast to the common rejection sampling approach,an advantage of the SIR algorithm is that the bound of the ratio of the candidate and the target distributions do not need to be evaluated.We proceed as follows.Denote by c k ,the estimate of the unknown parameter c ¼(b ,g )at the k th step.AssumeX k ,1,...,X k ,n are n i.i.d realizations following distribution F ðX j T ;D ; W;Z ;H k Þ.Introduce I (X ;b )¼(o /o b )S (T ,D ,X ,Z ;b )and J (X ;b ,g )¼(o /o g )U (T ,D ,X ,Z ;b ,g ).Let I k ¼ð1=n ÞP n i ¼1IðX k ;i ;b k ÞJ k ¼ð1=n ÞP n i ¼1J ðX k ;i ;b k ;g k Þ;S k ¼ð1=n ÞP n i ¼1S ðT ;D ;X ;Z ;b k Þ;and U k ¼ð1=n ÞP ni ¼1U ðT ;D ;X ;Z ;b k ;g k Þ.Then at the (k þ1)-step,the updated estimate of c is^b k þ1¼~b k Àa k ~I k ~Sk ;^g k þ1¼~g k Àa k ~J k ~U k ;where ~b k ¼ð1=k ÞP k i ¼1^b i ;~g k ¼ð1=k ÞP k i ¼1^g i ;~I k ¼ð1=k ÞP k i ¼1I i ;~S k ¼ð1=k ÞP k i ¼1S i ;~J k ¼ð1=k ÞP k i ¼1J i ;~U k ¼ð1=k ÞP k i ¼1U i .Here the gain constant a k is defined to be a k ¼c /(k e þg ),where c ,g >0,e 2(0,1)are fixed.In practice,e is chosen to be close to 1/2and c to be small and g is relatively large (cf.Gu &Zhu,2001).The iteration continues until convergence.To guarantee convergence in stochastic approximation,a good starting value is often needed;our experience suggested that choosing the naive estimates as starting points is preferable.We apply the SIR to draw samples from intractable distribution F ðX j T ;D ; W;Z ;c Þor density f ðX j T ;D ; W;Z ;c Þ.Specifically,we draw M values,X 1,...,X M from a candidate density h (X )and calculate the importance ratios :r j ¼f ðX j j T ;D ; W;Z ;c Þ=h ðX j Þfor j ¼1,...,M .Then draw n values from X 1,...,X M .It can be shown that as M /n !1,the 176Y.Li and L.Ryan Scand J Statist 33distribution of the drawn values follows the targeted distribution (McLachlan &Krishnan,1997,Ch.6).In order for SIR to work well,one needs to carefully select the candidate densityh (X )such that h (X )and the object density function f ðX j T ;D ; W;Z ;c Þhave the same support,and h (X )approximates f ðX j T ;D ; W;Z Þwell.We proceed as follows.First notice that f ðX j T ;D ; W ;Z Þ¼Q m i ¼1f ðX i j T i ;d i ; W i ;Z i Þ,and apply a Taylor series expansion to ‘i ðx Þ log f ðx j T i ;d i ; Wi ;Z i Þcentred at its mode ~l i ,yielding ‘i ðx Þ¼‘i ð~l i Þþ12ðx À~l i Þ0@2@x @x 0‘i ðx Þj x ¼~l i &'ðx À~l i Þþr i ;ð17Þwhere the remainder term r i is negligible compared to the quadratic term if x is close to ~li or n i is large.From (7)and (8),~li solves 0¼@‘i ðx Þ¼d i ÀK 0ðT i ;g Þe b 0x x þb 0z Z i n o b x Àn i R À1u ðx À W i ÞÀR À1x ðx Àl x Þand À@2@x @x 0‘i ðx Þj x ¼~l i ¼K 0ðT i ;g Þe b 0x ~l i þb 0z Z i b x b 0x þn i R À1u þR À1x :Considering (17)as a function of x only,the first term is a constant,whereas the second term is proportional to the logarithm of a normal density,yielding a normal approximationN ð~li ;~R i Þ,where ~R i ¼À@2@x @x 0‘i ðx Þj x ¼~l i &'À1:Therefore,h ðÁÞ¼Q mi ¼1/ðÁ;~li ;~R i Þ.Notice when min i (n i )!1or norm ||R u ||!0,~li À W i !0almost surely and jj ~R i jj !0almost surely for i ¼1,...,m ,in which case W i can be substituted for X i ,and the estimating equation reduces to the ordinary partial likelihood equation and attains semiparametric efficiency (Bickel et al .,1993).Consequently,increasing the number of replicates for the unobserved covariates increases efficiency and reduces bias.6.Variance estimatorThe variances of the maximum likelihood estimates are conventionally calculated by inverting the Fisher information matrix.However,because (12)is not an i.i.d.sum of ordinary likeli-hood scores,a more in-depth analysis is required to derive an estimate of the variance matrix of b c ,the zero of (12).The appendix establishes that the asymptotic variance of m 1=2ðb c Àc 0Þ,V ,can be estimated byb V ¼A À1m ðbc Þb W f A À1m ðb c Þg 0;ð18Þwhere A m and b Ware consistent estimates to A and W in theorem 2and are given in the appendix.Computationally,using (18)to calculate a variance estimate is complicated and time-consuming,even without accounting for the additional variability induced by estimating l x ,R x and R u .A simple alternative is to use the bootstrap approach (Efron,1981).Specific-ally,we resample m subjects,with replacement,from ðT i ;d i ; W i ;Z i Þj m i ¼1to obtain a new data set f T ði Þ;d ði Þ; W ði Þ;Z ði Þgj m i ¼1.Given this new dataset,we solve (12)for the estimates of c ,in particular,b .Such a procedure can be repeated for B times to obtain a sequence of estimates,say,~bðl Þ;l ¼1,...,B .The bootstrap variance estimates can be calculated using the sample varianceScand J Statist 33Imputation for contaminated covariates 177。
统计学-部分经典文献
统计学-部分经典文献Estimation in Two Classes of Semiparametric Diffusion Models两类半参数扩散模型的估计In this paper we propose an estimation method for two classes of semiparametric scalar diffusion models driven by a Brownian motion: In the first class, only the diffusion term is parameterised while the drift is unspecified; in the second, the drift term is specifified while the diffffusion is of unknown form. The estimation method is based on the assumption of stationarity of the observed process. This allows us to express the unspecified term as a functional of the parameteric part and the stationary density. A MLE-like estimator for the parametric part and a kernel estimator of the nonparametric part are defined for a discrete sample with a fixed time distance between the observations. We show that the parametric part of the estimator is n consistent while the nonparametric part has a slower convergence rate. Also, the asymptotic distribution of the estimator is derived. To illustrate the usefulness of these two classes, we fit a specific model from the first class to a proxy of the Eurodollar short-term interest rate. We find non-linearities in both the drift and diffusion function that standard parametric models are unable to capture.本文提出了两类半参数标量的估计方法由布朗运动驱动的扩散模型:在第一类中,只有扩散项参数化,而漂移是未指定的;在第二种情况下,漂移项被指定,而扩散项形式未知。
统计学课程论文(5篇)
统计学课程论文(5篇)统计学课程论文(5篇)统计学课程论文范文第1篇自1998年之后,统计学课程两次被教育部列为高等学校经济学类各专业的共同核心课程和工商管理类各专业的九门核心课程之一。
2000年,教育部还特地组织力气进行讨论,为统计学课程的教学确定了基本教学要求、详细教学内容和教学要点,指出统计学“不是着重于统计方法数学原理的推导,而是侧重于阐明统计方法背后隐含的统计思想,以及这些方法在实际各领域中的详细应用②”。
至此,统计学的主要教学内容也被明确了下来,主要包括绪论、描述统计、推断统计、经济管理中采纳的统计方法和国民经济统计基础学问等。
在教育部的指挥棒下,统计学老师开头了统计学教学的讨论探究、试验论证和改革创新。
统计学也由此开头肩负起培育同学统计学问方面的基本技能和应用统计方法发觉、分析、解决问题的力量之重任。
二、当前高校统计学课程的教学现状一提到统计学,同学普遍反映难学、难懂、难理解,广阔老师也倍感难讲、难教、难入心。
教育部虽然统一确定了统计学课程的主要教学内容和基本教学要求,从人才培育的角度提出了课程性质和地位、教学任务及总体要求,但是各高校在开展统计学教学过程中还应结合本校实际对其提出详细要求或做出适当调整。
可是圆满的是,在调查中笔者发觉很多高校生搬硬套,从而导致当前统计学课程教学中仍存在以下共性问题。
第一,教材选用的针对性不强,教材建设落后于实践需要。
很多老师在教材选用过程中完全不考虑学校层次、生源质量、专业设置、师资结构等实际状况的差异而盲目选择,甚至消失了一本、二本和三本院校选用同一本统计学教材的怪相。
因此,老师在教学中只能随机自行删减、调整内容,基本教学要求根本得不到保证。
另外,目前国内有些统计学教材完全忽视从应用层面上介绍统计学在专业领域的运用,从而导致有些同学把统计学课程当成了一门高等数学课程,把统计学教材当作一本数学书籍。
其次,教学大纲设计严峻滞后,学时少、内容多的冲突尖锐。
概率论与数理统计各章参考文献
概率论与数理统计各章参考文献《概率论与数理统计》各章参考文献第1章事件与概率罗建中. 排列组合、二项式定理与概率统计[J]. 数学教学通讯, 2006,(Z2)吐尔洪江. 关于古典概型问题的几点思考[J]. 塔里木大学学报, 2006,(02)潘佩. 概率中易混淆概念的对比与思考[J]. 高中数学教与学, 2007,(01)姜丽娟. 概率教学中几个相关概念的探讨[J]. 鸡西大学学报, 2001,(04)左振钊, 张艳红. 利用概率的古典定义求概率常见错误解法分析[J]. 河北北方学院学报(自然科学版) , 2006,(04)黄良文. 第一讲概率的意义及其基本运算[J]. 中国统计, 1984,(01)第2章离散型随机变量刘青桂, 王书田, 郝香芝. 一类离散型随机变量[J]. 石家庄职业技术学院学报, 2005,(06)王昭海, 杜贵春. 关于随机变量分布函数定义的一点注记[J]. 安康师专学报, 2006,(02)徐德义. 随机变量及分布函数[J]. 高等函授学报(自然科学版) , 1996,(05)赵晓兵. 随机变量函数分布的教学实践与探索[J]. 雁北师范学院学报, 2006,(05)刘淼. 关于二维随机变量概率密度函数算法的一点补充[J]. 中央民族大学学报(自然科学版) , 2006,(03)汪红. 用换元法求连续型随机变量函数分布的两个问题[J]. 绵阳师范高等专科学校学报, 1998,(S1)王昭海. 一类离散型随机变量的分布列与数学期望[J]. 安康师专学报, 2006,(01)朱学军. 有关数字特征的几个计算技巧问题[J]. 嘉兴学院学报, 2004,(03)覃光莲. 数学期望的计算方法探讨[J]. 高等理科教育, 2006,(05)徐传胜. 离散型随机变量数学期望的求法探究[J]. 高等数学研究, 2005,(01)第3章连续型随机变量汪仲文. 连续型随机变量函数的密度函数的计算公式[J]. 喀什师范学院学报, 2004,(03)刘平兵. 二维连续型随机变量函数的密度公式及计算[J]. 数学理论与应用, 2005,(04)唐小峰. 连续型随机变量独立性的几个充要条件[J]. 阜阳师范学院学报(自然科学版) , 2006,(02)李裕奇, 赵刊. n维随机变量独立性的一个充要条件[J]. 西南交通大学学报(自然科学版) , 1998,(05)尹传存, 吕玉华, 李福山. 随机变量独立性的几个结果[J]. 河南师范大学学报(自然科学版) , 1998,(04)黄爱英, 李春芳. 解决二维连续型随机变量函数分布的一种方法[J]. 雁北师范学院学报, 1998,(02)王雪琴. 随机变量的函数的数学期望[J]. 渭南师范学院学报, 2002,(02)许兆龙. 关于随机变量的特征函数与独立性关系的一个性质的证明[J]. 湘潭师范学院学报,1996,(03)唐秋晶, 蒋传凤. 数学期望的几种求法[J]. 洛阳师范学院学报, 2000,(05)第4章大数定律与中心极限定理李贤平等《概率论与数理统计》(学习方法指导丛书)复旦大学出版社,2003刘剑平等《概率论与数理统计方法》华东理工大学出版,2004赵衡秀等《概率论与数理统计全程学练考》东北大学出版社,2003胡东华等《概率统计辅导》机械工业出版社,2003第5章数理统计的基本概念王天营. 谈数理统计在统计学中的地位[J]. 统计与决策, 2006,(09)何鹏光. 充分统计量的证明及其相关结论[J]. 阜阳师范学院学报(自然科学版) , 2006,(03)陈红, 山其骞. 几种重要统计量数字特征的简算法[J]. 青岛大学学报(自然科学版) , 1999,(01)李秀兰. 对教材中有关次序统计量分布证明的一点看法[J]. 雁北师范学院学报, 2000,(06)费青云. 几个统计量的初等诠释[J]. 数学教学, 1999,(04)第6章点估计张永利. 矩估计的基本原理及其解题方法[J]. 巢湖学院学报, 2005,(03)谢安. 浅谈极大似然估计的教学方法[J]. 统计教育, 2002,(03)陈思宝, 王海贤, 陈桂景. 指数分布族中矩估计序贯置信区间[J]. 系统科学与数学, 2006,(03) 张忠诚. 参数极大似然估计的几点注记[J]. 高等函授学报(自然科学版) , 2006,(02)聂高辉. 参数θ的函数f(θ)的极大似然估计[J]. 大学数学, 2005,(05) .张忠诚. 两种情形下参数的极大似然估计[J]. 高等函授学报(自然科学版) , 2005,(01)第7章假设检验张忠群. 对假设检验中两类错误的探讨[J]. 六盘水师范高等专科学校学报, 2006,(06)张光春, 宿莉. 假设检验问题分析[J]. 重庆科技学院学报(自然科学版) , 2005,(04)刘舒强. 关于假设检验的两类错误在应用上的处理方法[J]. 现代财经-天津财经学院学报, 1989,(03)谭萄. 统计假设建立的一般原则刍议[J]. 晋东南师范专科学校学报, 2003,(05)蔡越江. 论假设检验中的两类错误[J]. 数理统计与管理, 1999,(03)王德劲. 论假设检验中两类错误的关系[J]. 内江科技, 2006,(01)曹玲. 关于假设检验中两类错误的探讨[J]. 云南财贸学院学报(社会科学版) , 2004,(04)第8章方差分析和回归分析金兰. 回归分析与方差分析教学的几点思考[J]. 统计教育, 2006,(11)杨国忠, 刘再明. 一类带跳的线性回归模型[J].湖南大学学报(自然科学版) , 2005,(03)张勇. 评介《应用线性回归模型》[J]. 统计研究, 1990,(01)赵岗, 吕淼. 回归分析方法应用于产品检验中的探讨[J]. 山东轻工业学院学报, 1998,(01)白雪梅, 赵松山. 回归分析与方差分析的异同比较[J]. 江苏统计, 2000,(10)龚自方. 关于相关与回归的讨论[J]. 统计教育, 2002,(03)。
【统计学的参考论文】 统计学论文参考文献
【统计学的参考论文】统计学论文参考文献随着信息化时代的到来,统计数据应用日益广泛,关注度也在逐渐增加,这也对统计工作提出了新的要求,促使统计工作进行改革以适应时代的发展变化。
下文是小编为大家搜集整理的关于统计学的参考论文的内容,欢迎大家阅读参考!统计学的参考论文篇1论统计学发展的阶段及面临的任务前言:随着社会的发展,统计学在生活中的作用逐渐的增大,并且统计学不仅仅是一个单独的学科,同时也与其他的学科有着很大的联系,并且对其他的学科有着巨大的推动作用。
现今统计学经过不断的发展,其发展的空间不断的拓展,由原始的单一的发展思路,逐渐的走向了信息化的发展道路。
并且随着信息社会的进步,计算机技术的发展,统计学知识在计算机领域得到了广泛的应用,同时也为计算机科学的发展作出了很大的贡献。
因此统计学知识在现今的社会中,具有很高的研究价值,在很多的发达国家,都十分重视统计学的研究,并且都将其作为了一种主要的大学学科,这样在很大程度上促进了统计学的研究发展。
但是在现今我国,对于统计学的研究仍然处于一个比较落后的地位,我国仅仅是处于起步的阶段,因此国家必须要能够加强对统计学的研究,从而确立出统计学的重要地位。
一、统计学的提出与发展配第主要是利用统计学的方式,利用数量比较方法来进行政治经济的分析研究,这充分的表示统计学是一个独立的学科。
之后相关的学者也利用统计学知识进行相应的问题研究,并且都取得了很好的效果。
逐渐的,统计学在生活中逐渐的得到了应用,人们开始利用数据来对问题进行研究。
随后在十八世纪到十九世纪,相关学者开辟了统计学的新路径,学者们将概率论引入到了统计学之中,并且将统计学划分为边缘学科,将统计学中实质性的学科过渡到了通用的方法论学科。
并且在统计学中,其中概率论是基础,对统计学有着很好的指导作用,在现今的统计学之中,概率论也是占有很重要的作用。
随着社会的发展,到了十九世纪末期,统计学在社会经济研究领域取得了很大的效果,并且随着相关学者的不断研究,统计学在物价指数编制、国民经济测定以及经济前景预测中都得到了广泛的应用,并且都取得了很大的效果。
- 1、下载文档前请自行甄别文档内容的完整性,平台不提供额外的编辑、内容补充、找答案等附加服务。
- 2、"仅部分预览"的文档,不可在线预览部分如存在完整性等问题,可反馈申请退款(可完整预览的文档不适用该条件!)。
- 3、如文档侵犯您的权益,请联系客服反馈,我们会尽快为您处理(人工客服工作时间:9:00-18:30)。
统计学专业论文参考文献
统计学的英文statistics最早源于现代拉丁文statisticumcollegium(国会)、意大利文statista(国民或政治家)
以及德文Statistik,最早是由GottfriedAchenwall于1749年使用,代表对国家的资料进行分析的学问,也就是“研究国家的科学”。
十九世纪,统计学在广泛的数据以及资料中探究其意义,并且由JohnSinclair引进到英语世界。
统计学专业论文参考文献范文一:
[1]蔡立梅,马瑾,周永章,黄兰椿,窦磊,张澄博,付善明.东莞市农业土壤重金属的空间分布特征及解析[J].环境科学.xx(12) [2]钟晓兰,周生路,赵其国,李江涛,廖启林.长三角典型区土壤重金属有效态的协同区域化分析、空间相关分析与空间主成分分析[J].环境科学.xx(12)
[3]张仁铎着.空间变异理论及应用[M].科学出版社,xx
[4]张建同,孙昌言编着.以Excel和SPSS为工具的管理统计[M].清华大学出版社,xx
[5]PGoovaerts,R.Webster,J.-P.Dubois.Assessingtheriskofsoilc ontaminationintheSwissJurausingindicatorgeostatistics[J].En vironmentalandEcologicalStatistics.1997(1)
[6]PeterM.Chapman.Sedimentqualityassessment:statusandoutloo
k[J].JournalofAquaticEcosystemHealth.1995(3)
[7]王政权编着.地统计学及在生态学中的应用[M].科学出版社,1999
[8]杜瑞成,闫秀霞主编.系统工程[M].机械工业出版社,1999
[9]侯景儒等编着.实用地质统计学[M].地质出版社,1998
[10]陈静生,周家义主编.中国水环境重金属研究[M].中国环境科学出版社,1992
[11]国家环境保护局主持,中国环境监测总站主编.中国土壤元素背景值[M].中国环境科学出版社,1990
[12]王仁铎,胡光道编.线性地质统计学[M].地质出版社,1988
[13]史舟,李艳,程街亮.水稻土重金属空间分布的随机模拟和不确定评价[J].环境科学.xx(01)
[14]乔胜英,蒋敬业,向武,唐俊红.武汉地区湖泊沉积物重金属的分布及潜在生态效应评价[J].长江流域资源与环境.xx(03)
[15]张丽旭,任松,蔡健.东海三个倾倒区表层沉积物重金属富积特征及其潜在生态风险评价[J].海洋通报.xx(02)
[16]ZHANGXuelei,GONGZitong(StateKeyLabofSoilandSustainableA griculture,InstituteofSoilScience,CAS,Nanjing210008,China).
Apedodiversitypattern:taxonomicallyestablishedsoilordersinC hina[J].JournalofGeographicalSciences.xx(S1)
[17]苏伟,聂宜民,胡晓洁,李强,张建国.农田土壤微量元素的空间变异及Kriging估值[J].华中农业大学学报.xx(02)
[19]Anonymous.Apillarofmedicine.TheJournalofTheAmericanMedi calAssociation.1966
统计学专业论文参考文献范文二:
[1]冯克忠,万庆,励惠国.基于组件技术的GIS广义空间分析[J].地球信息科学.xx(01)
[2]陈斐,杜道生.空间统计分析与GIS在区域经济分析中的应用[J].武汉大学学报(信息科学版).xx(04)
[3]肖斌,赵鹏大,陈玉玲,侯景儒.时空多元协同克立格的理论研究[J].物探化探计算技术.1998(01)
[4]毛政元,李霖着.空间模式的测度及其应用[M].科学出版社,xx
[5]刘阳.基于地统计学的县/团区域土壤养分空间变异研究[D].新疆农业大学xx
[6]杨中庆.基于R语言的空间统计分析研究与应用[D].暨南大学xx
[7]杨红芳.基于合理城市空间模式的杭州适度人口规模研究
[D].浙江大学xx
[8]冯锦霞.基于GIS与地统计学的土壤重金属元素空间变异分析[D].中南大学xx
[9]陈述彭主编.地学信息图谱探索研究[M].商务印书馆,xx
[10]刘昌明,岳天祥,周成虎主编,朱海燕,刘卓澄.地理学的数学模型与应用[M].科学出版社,2000
[11]王政权编着.地统计学及在生态学中的应用[M].科学出版社,1999
[12]李小建主编.经济地理学[M].高等教育出版社,1999
[13]侯景儒等编着.实用地质统计学[M].地质出版社,1998
[14]郭仁忠着.空间分析[M].武汉测绘科技大学出版社,1997
[15]徐建华编着.现代地理学中的数学方法[M].高等教育出版社,1996
[16]李德仁.关于地理信息理论的若干思考[J].武汉测绘科技大学学报.1997(02)
[17]李天生,周国法.空间自相关与分布型指数研究[J].生态学报.1994(03)
[18]CarlWalters,DanielPauly,VillyChristensen.Ecospace:Predi ctionofMesoscaleSpatialPatternsinTrophicRelationshipsofExpl oitedEcosystems,withEmphasisontheImpactsofMarineProtectedAr eas[J].Ecosystems.1999(6)
[19]A.G.Journel.Nonparametricestimationofspatialdistributio ns[J].JournaloftheInternationalAssociationforMathematicalGe ology.1983(3)
统计学专业论文参考文献范文三:
[1]郭祖超主编.医学统计学[M].人民军医出版社,1999
[2]詹绍康.正确应用相关回归分析[J].劳动医学.1997(04)
[3]颜艳,徐勇勇.统计思想是第一位的--教育部面向21世纪课程教材《医学统计学》评介之一[J].中国卫生统计.xx(04)
[4]胡良平.医学实验中常见设计类型的辨析及统计方法的合理选用[J].中国应用生理学杂志.2000(01)
[5]方积乾,凌莉,张敏瑞.近期医学论文中常见统计错误及其纠正[J].中山医科大学学报.1999(04)
[6]程萍,祖述宪.临床医学论文统计方法应用的调查分析[J].安徽医科大学学报.1998(02)
[7]王倩,张博恒.五种中华医学会系列杂志论着中统计方法的应用现况[J].中华医学杂志.1998(03)
[8]刘勤,金丕焕主编.分类数据的统计分析及SAS编程[M].复旦大学出版社,xx
[9]陈峰编着.医用多元统计分析方法[M].中国统计出版社,2000
[10]孙尚拱编着.医学多变量统计与统计软件[M].北京医科大学出版社,2000
[11]胡良平主编.医学统计应用错误的诊断与释疑[M].军事医学科学出版社,1999
[12]毛宗福,丁元林,陈东峨,张金荣,王圣基.临床论着中统计推断应用缺陷特征及对策[J].中国卫生统计.1998(03)
[13]胡良平主编.现代统计学与SAS应用[M].军事医学科学出版社,1996
[14]胡良平.医学科研与新药评价等工作中一个不可忽视的问题--轻视和误用统计学[J].军事医学科学院院刊.1996(03)
[15]胡良平.充分了解资料的特点是进行统计分析的首要前提[J].中国卫生统计.1988(06)
[16]胡良平.选择多因素设计类型的一般原则[J].中国卫生统计.1988(02)
[17]Anonymous.Apillarofmedicine.TheJournalofTheAmericanMedi calAssociation.1966
[18]FreimanJA,ChalmersTC,SmithHJr,etal.Theimportanceofbeta, thetypeⅡerrorandsamplesizeinthedesignandinterpretationoftherandomiz edcontroltrial.TheNewEnglandJournalofMedicine.1978。