Characteristics of aerosol particles from corona discharge ammonia radical injection desulphurizatio
宽频段太赫兹大气传输特性的理论与实验研究

摘要太赫兹波在电磁波谱中位于微波和红外波之间,具有瞬态性、宽带性、低能量性、透射性等优点,在分子光谱、生物医学、空间通信、大气遥感和雷达探测等领域有广阔的应用前景。
太赫兹波在大气中的传输特性是太赫兹波空间应用的基础,研究不同温度、湿度、大气压强和海拔高度等条件下太赫兹波的大气衰减系数,找到透过率窗口的位置和宽度对于促进该频段在空间中的应用具有重要意义。
本文的研究内容可以归纳如下:1、介绍了太赫兹波的空间应用以及研究太赫兹波大气传输特性的重要性,并综述了太赫兹波大气传输特性的国内外发展历史和研究现状。
2、根据HITRAN数据库中的光谱参数,用逐线计算方法计算了水蒸气和氧气的谱线吸收,用MT_CKD模型计算了水蒸气的连续吸收。
考虑到气温、气压和相对湿度对吸收系数的影响,比较了0~8 THz 的太赫兹波的吸收系数随这三个因素的变化,并给出了大气窗口的频率。
通过对不同海拔高度的吸收系数进行计算,分析了高频太赫兹波在高空尤其是平流层中远距离传输的可行性。
3、根据米氏散射理论对气溶胶粒子的散射特性参数进行计算,以此为基础在高能见度天气中计算太赫兹波的单次散射衰减,在低能见度天气中用蒙特卡罗法解决多次散射问题。
并且分析了我国海雾和内陆雾以及塔克拉玛干沙漠和毛乌素沙漠中太赫兹波的衰减、散射、透过率情况。
4、在实验室环境下用远红外傅里叶光谱仪(FTIR)搭建了太赫兹波大气传输特性实验平台,测量了不同压强和湿度条件下0.5 THz~7.5 THz 频段的太赫兹波传输2.3 m的透过率,用比尔-朗伯定律反推大气吸收系数,实验结果与理论计算结果吻合得很好。
关键词:太赫兹波,吸收系数,蒙特卡罗法,FTIRABSTRACTTerahertz (THz) spectral range which falls between microwave and infrared, has many advantages, such as transient, broadband, low photon energy and transmission. And THz wave can be widely applied in spectroscopy, biomedical science, free-space based communication, remote sensing, radar and so on. The transmission characteristics of THz wave is the basis of THz free-space applications. To research THz atmospheric attenuation coefficients under different conditions (e.g. temperature, relative humidity, pressure, altitude etc ) and to find the locations and widths of atmospheric transmission windows will be important for THz free-space applications.The main contents of this dissertation are as follows:1. THz free-space applications, and the importance of research on terahertz atmospheric transmission characteristics are introduced. The development and present developing status of this problem are also summarized.2. Line absorption of water vapor and oxygen is calculated based on line-by-line calculations and the spectral parameters in HITRAN database. And water vapor continuum absorption is calculated based on MT_CKD model. Considering temperature, pressure and relative humidity, broadband THz atmospheric transmission characteristics from 0 to 8 THz is theoretically simulated. Atmospheric transmission windows in this range are also given. Based on absorption coefficients in different altitudes, the high frequency atmospheric windows are evaluated and the feasibility for long-range applications is estimated.3. The scattering characteristics of air aerosol are calculated based on Mie theory. According to these results, terahertz attenuation characteristics are studied for single scattering of particles in high-visibility environment and multiple scattering in low-visibility environment using Monte-Carlo method. Terahertz attenuation coefficients, scattering characteristics and transmittance are analyzed in real environment including sea fog, inland fog, Taklimakan Desert and Mu Us Desert.4. An experimental system is built based on a Fourier transform infrared spectrometer (FTIR) in laboratory. Considering the influence of water concentrationand pressure, the terahertz transmission is measured from 0.5~7.5 THz with 2.3-m path length. The absorption coefficients are calculated according to Beer-Lambert Law, which are consistent with calculation results.KEY WORDS:THz Wave, Absorption Coefficients, Monte-Carlo, FTIR目录摘要 (I)ABSTRACT ................................................................................................................. I I 第1章绪论 .. (1)1.1 太赫兹波简介 (1)1.1.1 太赫兹波的特点 (1)1.1.2 太赫兹波的空间应用及大气传输特性研究的意义 (2)1.2 国内外研究进展 (4)1.2.1 太赫兹波大气吸收特性的研究进展 (4)1.2.2 太赫兹波大气散射特性的研究进展 (7)1.3 本文主要内容 (8)第2章宽频段太赫兹波的大气吸收 (9)2.1 大气分子的选择吸收 (9)2.1.1 大气分子光谱 (9)2.1.2 谱线的增宽 (10)2.1.3 吸收系数和透过率 (10)2.2 大气分子光谱参数数据库——HITRAN (11)2.2.1 HITRAN数据库中的光谱参数 (11)2.2.2 光谱参数随温度和压强的变化 (12)2.2.3 吸收系数的计算 (13)2.3 主要大气成分对太赫兹波的吸收 (13)2.3.1 水蒸气和氧气的太赫兹吸收谱 (13)2.3.2 连续吸收 (15)2.3.3 吸收系数随温度、大气压强、相对湿度的变化情况 (17)2.4 不同海拔高度太赫兹波的传输衰减 (21)2.4.1 大气的物理概况 (21)2.4.2 大气吸收系数和太赫兹波透过率随海拔高度的变化 (22)2.4.3 太赫兹波垂直入射时的透过率 (25)2.5 本章小结 (26)第3章太赫兹波在复杂大气背景下的散射特性 (27)3.1 单个球形粒子的散射理论 (27)3.1.1 散射过程 (28)3.1.2 米散射理论 (29)3.2 单次散射理论 (30)3.3 多次散射的处理——蒙特卡罗法 (31)3.4 太赫兹波在雾中的散射特性 (33)3.4.1 雾的物理特性 (33)3.4.2 太赫兹波在雾中的单次散射 (35)3.4.3 太赫兹波在低能见度雾中的多次散射 (37)3.5 太赫兹波在风沙天气中的散射特性 (39)3.5.1 我国沙漠地区中沙尘的物理特性 (39)3.5.2 太赫兹波在扬沙天气中的单次散射 (41)3.5.3 太赫兹波在沙尘暴天气中的多次散射 (43)3.6 本章小结 (45)第4章太赫兹波大气传输特性实验 (47)4.1 太赫兹波大气传输特性实验平台设计 (47)4.2 实验结果与分析 (49)4.2.1 实验中湿度和压强对太赫兹波透过率的影响 (49)4.2.2 实验与理论计算结果比较分析 (51)4.2.3 存在问题及建议 (52)4.3 本章小结 (53)第5章总结与展望 (55)参考文献 (57)发表论文和参加科研情况说明 (63)致谢 (65)第1章绪论1.1 太赫兹波简介太赫兹波的频率范围是0.1 THz~10 THz(波长3mm~ 30μm),在电磁波谱中介于微波和红外波之间,如图1-1所示。
压力溶气气浮法的三种流程使用场合

英文回答:Pressure aerosols are a widely used process in the field of water treatment, mainly in the areas of sewage treatment plants, industrial wastewater treatment and drinking water treatment. In the case of sewage treatment plants, pressure soluble aerosols aremonly used to treat wastewater with higher suspension content, which can effectively remove suspensions and floating substances from wastewater and increase the efficiency of wastewater treatment by pressuring solvents and aerosols. In industrial wastewater treatment, this technology can effectively treat industrial wastewater containing more contaminants such as grease and suspension, and remove pollutants through aerosols to meet emission standards. In the treatment of drinking water, pressure soluble aerosols can be used to remove the obscenity of water, improve water transparency, improve water quality and ensure safe drinking water for people. Pressure aerosols are applied to sewage treatment, industrial wastewater treatment and potable water treatment that require the removal of suspended substances from water.压力溶气气浮法是一项在水处理领域中被广泛采用的工艺,其主要应用于污水处理厂、工业废水处理和饮用水处理等领域。
卷烟烟气气溶胶颗粒实时观测分析
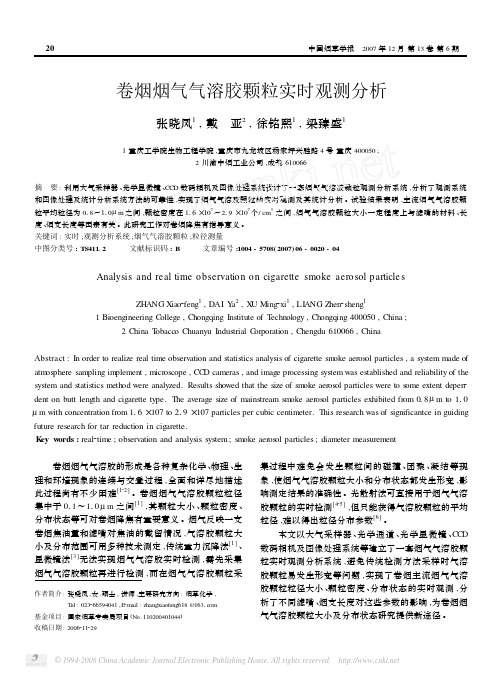
图 1 观测系统结构示意图
试验设计光学通道为 215 cm ×015 cm ×012 cm ,容 积为 0125 cm3 。以载玻片为基底 ,两侧有 012 cm 高支 撑架 ,粘结基底和支撑架 ,再覆上盖玻片 ,密封通道边 缘 ,其结构见图 2 。采样时盖玻片内表面均匀涂一薄 层甘油 ,以固定沉降的烟气颗粒和减小部分沉降颗粒 扩散产生的变形 。
21
113 采样操作条件 显微镜放大倍数为 16 ×40 倍 ,CCD 数码相机采用
3 倍光学变焦时 ,放大倍数约为 1920 倍 ,CCD 视场范 围为 133μm ×100μm。在烟支长度 (即采样点距滤嘴 的距离) 分别为 50 mm、35 mm、20 mm时开始采样 ,大气 采样器流速度为 1 L/ min ,使用 CCD 数码相机 (快门速 度 1/ 2000 s ,AVI(Motion J PEG) 视频格式 ,30 帧/ s ,尺寸 为 640 ×480 象素) 捕捉光学通道内主流烟气气溶胶颗 粒的状态 。 114 图像处理与统计分析
22 图 4 中 (a) 图 ,图中实心黑点为烟气气溶胶颗粒 。
中国烟草学报 2007 年 12 月 第 13 卷 第 6 期
图 5 012μm 核孔膜的 SEM 图
213 样品分析结果 21311 卷烟烟气气溶胶颗粒粒径分布
自组装观测系统上 ,20 mm 醋纤滤嘴的卷烟 ,烟支 长 20 mm ,采集主流烟气气溶胶颗粒的分布状态图 ,经 图像处理和统计分析 ,得到主流烟气气溶胶颗粒粒度 分布范围 ,如图 6 。图中主流烟气气溶胶颗粒分布于 011~215μm 之间 ,但由于光学显微镜的局限性 ,无法 观测小于 011μm 的颗粒 ,其中 112μm 左右颗粒所占 比例最大 。
离散颗粒抑制热喷流红外辐射的大涡模拟
第 54 卷第 4 期2023 年 4 月中南大学学报(自然科学版)Journal of Central South University (Science and Technology)V ol.54 No.4Apr. 2023离散颗粒抑制热喷流红外辐射的大涡模拟胡峰1,孙文静1, 2,张靖周1,单勇1(1. 南京航空航天大学 能源与动力学院,江苏 南京,210016;2. 中国航天科工飞航技术研究院 北京动力机械研究所,北京,100074)摘要:为了探究气溶胶离散颗粒对飞行器排气喷管热喷流3~5 μm 波段的红外辐射的抑制效果,设计地面状态下气溶胶颗粒投射的仿真环境,采用大涡模拟和颗粒离散相模型对含气溶胶颗粒的飞行器排气喷管尾部气固两相剪切流进行数值模拟研究,系统地分析颗粒的质量流量、粒径和喷射速度对离散颗粒空间分布形态以及热喷流红外辐射抑制的影响规律。
研究结果表明:颗粒的质量流量和粒径对于红外抑制效率的影响较为明显,增加颗粒质量流量对颗粒的空间分布形态影响较小,但能够显著提升红外抑制效率;当颗粒粒径大于1.0 μm 时,颗粒空间分布均匀,红外抑制效率最高;颗粒的喷射速度对于颗粒的空间分布以及红外抑制效率的影响较小。
关键词:红外抑制;高速剪切流;大涡模拟;气溶胶颗粒分布;气固相互作用中图分类号:V231.1 文献标志码:A 开放科学(资源服务)标识码(OSID)文章编号:1672-7207(2023)04-1576-16Large eddy simulation of discrete particles suppressing infraredradiation from thermal jetsHU Feng 1, SUN Wenjing 1, 2, ZHANG Jingzhou 1, SHAN Yong 1(1. College of Energy and Power, Nanjing University of Aeronautics and Astronautics, Nanjing 210016, China;2. Beijing Power Machinery Institute, China Aerospace Institute of Science and Technology, Beijing 100074, China)Abstract: To investigate the effect of aerosol discrete particles on the infrared radiation suppression in the 3~5 μm band of thermal jets of aircraft exhaust nozzles, the simulation environment of aerosol particle projection under ground conditions was designed. The large eddy simulation(LES) and particle discrete phase model(DPM) were used to numerically simulate the gas-solid two-phase shear flow at the tail of the aircraft exhaust nozzle containing aerosol particles, and the effect law of particle mass flow, size and jet speed on the spatial distribution of discreteparticles and the suppression of infrared radiation of thermal jets was systematically analyzed. The results show收稿日期: 2022 −05 −14; 修回日期: 2022 −07 −23基金项目(Foundation item):中国博士后科学基金特别资助(站前)项目(2020TQ0143);江苏省自然科学基金青年基金资助项目(BK20200448) (Project(2020TQ0143) supported by the Postdoctoral Science Foundation of China; Project(BK20200448) supported by the Youth Fund of Jiangsu Natural Science Foundation)通信作者:孙文静,博士,讲师,从事气固两相湍流、湍流燃烧、流动强化传热研究;E-mail :**************.cnDOI: 10.11817/j.issn.1672-7207.2023.04.033引用格式: 胡峰, 孙文静, 张靖周, 等. 离散颗粒抑制热喷流红外辐射的大涡模拟[J]. 中南大学学报(自然科学版), 2023, 54(4): 1576−1591.Citation: HU Feng, SUN Wenjing, ZHANG Jingzhou, et al. Large eddy simulation of discrete particles suppressing infrared radiation from thermal jets[J]. Journal of Central South University(Science and Technology), 2023, 54(4): 1576−1591.第 4 期胡峰,等:离散颗粒抑制热喷流红外辐射的大涡模拟that the effect of particle mass flow and size on infrared radiation suppression rate is obvious. With the increase of particle mass flow, its effect on the spatial distribution of particles is small, but the infrared suppression efficiency is significantly improved. When the particle diameter is 1.0 μm, the particle space distribution is uniform and the highest infrared suppression rate is achieved. However, the particle injection speed has less effect on the spatial distribution of particles and infrared radiation suppression efficiency.Key words: infrared suppressing; high-speed shear flow; large eddy simulation; aerosol particle distribution; gas-solid interactions气溶胶红外隐身技术是一种主动型应急红外对抗技术,该技术利用附加的机载引气装置,将细微颗粒喷射在发动机热喷流周围形成气溶胶云,借此对排气喷管热内腔和热喷流的强红外辐射进行遮蔽和散射。
EFFECTS-OF-AEROSOLS-ON-AUTUMN-PRECIPITATION-OVER-MID-EASTERN-CHINA
V ol.20 No.3 JOURNAL OF TROPICAL METEOROLOGY September 2014Article ID: 1006-8775(2014) 03-0242-09EFFECTS OF AEROSOLS ON AUTUMN PRECIPITATION OVERMID-EASTERN CHINACHEN Si-yu ( )1, HUANG Jian-ping ( )1, QIAN Yun ( )2, GE Jin-ming ( )1,SU Jing ( )1(1. Key Laboratory for Semi-Arid Climate Change of the Ministry of Education, Lanzhou University, Lanzhou 730000 China; 2. Atmospheric Science and Global Change Division, Pacific Northwest NationalLaboratory, Richland, WA, USA) Abstract: Long-term observational data indicated a decreasing trend for the amount of autumn precipitation (i.e. 54.3 mm per decade) over Mid-Eastern China, especially after the 1980s (~ 5.6% per decade). To examine the cause of the decreasing trend, the mechanisms associated with the change of autumn precipitation were investigated from the perspective of water vapor transportation, atmospheric stability and cloud microphysics. Results show that the decrease of convective available potential energy (i.e. 12.81 J kg -1/ decade) and change of cloud microphysics, which were closely related to the increase of aerosol loading during the past twenty years, were the two primary factors responsible for the decrease of autumn precipitation. Our results showed that increased aerosol could enhance the atmospheric stability thus weaken the convection. Meanwhile, more aerosols also led to a significant decline of raindrop concentration and to a delay of raindrop formation because of smaller size of cloud droplets. Thus, increased aerosols produced by air pollution could be one of the major reasons for the decrease of autumn precipitation. Furthermore, we found that the aerosol effects on precipitation in autumn was more significant than in other seasons, partly due to relatively more stable synoptic systems in autumn. The impact of large-scale circulation dominant in autumn and the dynamic influence on precipitation was more important than the thermodynamic activity. Key words: aerosol; autumn precipitation; atmospheric stability; cloud microphysical properties CLC number: X513 Document code: AReceived 2013-05-16; Revised 2014-05-06; Accepted 2014-07-15Foundation item: National Basic Research Program of China (2012CB955301)Biography: CHEN Si-yu, Ph.D., Lecturer, primarily undertaking research on climate change and atmospheric remote-sensing.Corresponding author: HUANG Jian-ping, e-mail: hjp@1 INTRODUCTIONPrecipitation is a key physical process that links many aspects of climate, weather and the hydrological cycle, which have significant impacts on agricultural production, aviation, marine, transportation, water conservancy construction, floods and droughts, etc.[1]. Previous studies mainly focused on the precipitation change during summer at both global and regional scales such as China [2-5]. However, the change of autumn precipitation will directly affect agricultural production in the coming year. In addition, autumn precipitation anomaly could also have potential effects on winter precipitation in the current year and summer precipitation in the following year, resulting in floods, droughts and other disasters [6]. In order to comprehensively understand the climate change and its effects, more emphasis is needed on autumn precipitation. So far, very few studies have investigated the spatial-temporal variations of autumn precipitation. Xu and Lin [7] analyzed autumn precipitation change characteristics and related physical mechanisms over Western China. Li et al.[8] investigated the spatial and temporal variations of spring temperature anomalies over Western China and the correlation between the sea surface temperature anomalies (SSTA) of the North Pacific and the spring rainfall anomalies in Western China for the period of 1960 1994. In addition, Li et al.[9, 10] analyzed the autumn rainfall anomaly over Northwest China and investigated the circulation variations during the El Niño/La Niña periods. Their results showed good relationship between the SSTA over East Equatorial Pacific and the autumn rainfall anomaly over the Northwest China. In El Niño years, relatively smaller amount of autumn precipitation was generated over the Northwest China whereas more autumn precipitation was generated in La Niña years. Song and Zhang [11] pointed out that the variability and trendNo.3 CHEN Si-yu ( ), HUANG Jian-ping ( ) et al. 243243of autumn precipitation are more significant than that in other seasons during the 20th century over the Northwest China. Zhang et al.[12] found that the change of general atmospheric circulation and the influence of ENSO events under global warming could be the direct factors in effecting the autumn precipitation generation over Northwest China. Shi [13] found a good relationship between precipitation anomaly in autumn and rainfall in the flood season of the following year. However, the above studies were limited only to the Northwest China region, with a focus on the interactions between autumn precipitation and natural climate variability (e.g., ENSO) at large scale. In this study, we investigated the causes of the autumn precipitation anomalies from the perspective of physical mechanisms influencing the precipitation change over Mid-Eastern China.Generally speaking, there are three dominant conditions for the formation of precipitation: (1) Horizontal transportation: water vapor is transported to the precipitation zones from source regions; (2) Convergence and upward movement: the strong upward motion is associated with the surface convergence over the precipitation regions. Water vapor condenses into cloud droplets or ice crystals in the adiabatic expansion during the lifting process. (3) Microphysical conditions with growth of the cloud droplets: The saturated air tends to condense on condensation nuclei and then water droplets grow, become heavier, and fall to the ground as precipitation [1]. Aerosol particles, which have close relationship with the last two points of conditions, are the dominant factors for the formation of precipitation [14-16]. Based on the observational data and modeling approach, Qian et al.[17] found a decreasing trend of light rain events over North America, Europe and Asia from 1973–2009, especially over East Asia, where a remarkable shift from light to heavy rain events has been observed. Besides, Qian et al.[18] pointed out that aerosols are at least partly responsible for the decreasing frequency and amount of light rain in summer over Eastern China. Huang et al.[19, 20] found that dust could heat cloud droplets, increase the evaporation of cloud droplets and further reduce the cloud water path, which may play an important role in cloud development and contribute to the reduction of precipitation over arid and semi-arid areas. Zhao et al.[21] also found a positive feedback mechanism between increased aerosol loadings and reduced precipitation over Mid-Eastern China. Based on 194 observation stations, Gong et al.[22] investigated the frequency change of daily precipitation in summer during 1979–2002 and found an obvious weekly cycle effects.Was the change of autumn precipitation over Mid-Eastern China related to the high aerosol loadings in autumn when the weather system isrelatively stable? How do aerosols affect autumn precipitation in heavily polluted China? What kinds of precipitation will be affected mostly by aerosol? In this study, we try to address these questions from the perspective of precipitation formation mechanism over Mid-Eastern China which is featured by the heavy pollution, dense meteorological station and records, and frequent precipitation events records [23]. The paper is organized as follows: Data and methodology are described in sections 2. The part of effects of aerosols on autumn precipitation over Mid-Eastern China is presented in section 3. Conclusions and discussions are presented in section 4.2 DATA AND METHODOLOGYThe following types of data are used in this study: (1) Daily observational data were obtained from China Meteorological Data Sharing Service System (/home.do). We screened all daily precipitation records from 1959 to 2008 over 503 observation stations and included them in our following analysis. It also should be noted that the drizzle being not recorded by precipitation instruments was used and assigned the value of 0 mm and only the liquid precipitation was considered in our study.(2) Visibility data were widely used to study the relationship between aerosol and precipitation, due to its relatively long historic records [24-26]. The variability of atmospheric visibility, which is a good measure of environmental pollution, is consistent with that of aerosol optical depth (AOD)[27]. The unit of visibility dataset changed from level (bins) to kilometer after 1980 in China, resulting in systematic discrepancies in data processing. Thus, only the visibility data after 1980 were used in this study and data was further revised by applying the Rosenfeld method [28] to reduce the effects induced by relative humidity and precipitation.(3) We collected the sounding data from Chinese international exchange stations, including the mean monthly air pressure, altitude, temperature, dew temperature and wind speed from January 1951. The dew temperature and air temperature from 28 observational stations were used to calculate the specific humidity, of which only the results under 300 hPa were considered for deducing the perceptible water vapor.(4) Aerosol optical depth, cloud fraction and cloud particle effective radius from Moderate Resolution Imaging Spectroradiometer (MODIS)[29, 30] were used in this study. The AOD at 550 nm as a proxy of aerosol loading was sorted into 10 bins at a regular interval of 0.1. Cloud microphysical and optical parameters for cloud optical depth are sorted244 Journal of Tropical Meteorology Vol.20244into individual AOD bins, of which mean values and standard errors (i.e., / (n 1)1 / 2, where and n are standard deviation and the number of data points, respectively) are then calculated. 3 RESULTS3.1 Change trends of precipitationFigure 1 shows the spatial distributions of trends for seasonal precipitation amounts during the past 50 years over Mid-Eastern China, estimated using the least squares technique. Decreasing trends of spring precipitation were mainly centered in the regions around the Yangtze River and Southeast China, with the largest decreasing trends (i.e. from –2%/decade to –8%/decade) over the Loess Plateau region. Increasing trends of spring mean precipitation were mainly found over the Northeastern China, Beijing, Tianjin, North China Plain, Yunnan-Guizhou Plateau and Tibet Plateau. The decreasing trends for summer precipitation are larger (i.e. from –1%/decade to –5%/decade) than for spring over Northeast China, Beijing, Tianjin, Shandong Peninsula and Loess Plateau. Positive change trends of summer mean precipitation were found over Southern China, with the largest increasing trends (from 1%/decade to 10%/decade) over the Yangtze River Plain. The trends for winter mean precipitation were generally positive over China, except for Beijing, Tianjin and Inner Mongolia. The decreasing trends of precipitation in autumn were distributed more broadly and homogeneously than that in other seasons. Significant decreasing trends of autumn mean precipitation were found over the Yangtze River Plain, Sichuan Plateau, North China Plain and Yunnan-Guizhou Plateau. As a whole, lower amount of precipitation was generated over the Mid-Eastern China, especially over Northeast China, Central China and South China.Figure 1. Spatial distribution of the trend (% per decade) of precipitation in (a) spring (b) summer (c) autumn (d) winter precipitation amount from 1959 to 2008.Figure 2 shows the temporal variation of seasonal mean precipitation averaged for all observationalNo.3 CHEN Si-yu ( ), HUANG Jian-ping ( ) et al. 245245stations in the Mid-Eastern China. Increasing trends of precipitation were found for summer and winter whereas decreasing trends were found for spring and autumn. The trend of autumn mean precipitation was more significant over Yangtze-Delta region (i.e. –5.6%/decade) since 1980 and later on, contributed to the characteristic of autumn mean precipitation variations over Mid-Eastern China.Figure 2. Time series of precipitation anomaly (%) in spring, summer, autumn and winter from 1959 to 2008 averaged over Mid-Eastern China.3.2 Change trends of atmospheric water content Figure 3 shows the temporal variations of autumn atmospheric water content averaged over Mid-Eastern China during 1959–2002. The year of 1975 tends to be the turning point of atmospheric water content, indicating a transition from negative to positive trend. The lowest atmospheric water content during the past 50 years was found at the end of 1960s, while two peaks at the end of 1990s (i.e. 15%) and at the begging of the 21 century (25%) respectively. Most of the regions over Mid-Eastern China experienced a positive change trend of atmospheric water content, especially over Yangtze River, Southeast, Southwest and Northeast of China with an increase of 0.3–0.6 mm/decade generally. The least square method was applied to calculate the change trends of autumn mean precipitation during the past 50 years over Mid-Eastern China. Based on the above analysis, no evidences were found to support that the decreasing autumn precipitation trend over Mid-Eastern China was related to changes of the large-scale atmospheric water content. We believe other factors could play more important roles in influencing the autumn precipitation characteristics over Mid-Eastern China.246Journal of Tropical Meteorology Vol.20246Figure 3. Time series of autumn precipitable water anomaly (%) in autumn from 1959 to 2008 averaged over Mid-Eastern China. The dashed line represents the linear trend of precipitable water anomaly. The solid line represents the moving average of precipitable water.3.3 Effects of aerosols on precipitation3.3.1 S PATIAL VARIATION OF AOD AND VISIBILITYAerosols could directly and indirectly affect the radiation budgets of the earth system, with substantial effects on regional even global climate [31-36]. Thus, further analysis was done to demonstrate the role of aerosols on precipitation over Mid-Eastern China. Fig. 4 shows the spatial distribution of annual mean AOD derived from MODIS retrievals and visibilities from observational data in autumn. AOD values larger than 0.6 were found over the Sichuan Basin, Yellow River, the middle and lower reaches of Yangtze River. The spatial variations of annual mean AOD were also consistent with the findings of previous studies (Luo et al.[37], Wang et al.[38]). Visibility data also showed a consistent spatial pattern with that for AOD. It should be noted that the spatial distribution of visibility was of the opposite sign with that of AOD (i.e. larger AOD with smaller visibility), which gave more confidence to represent the characteristics of aerosol particles using visibility datasets.3.3.2 S VD ANALYSIS OF VISIBILITY AND PRECIPITATIONThe Singular Value Decomposition (SVD) analysis, a useful tool in demonstrating the spatial correlation of two atmospheric variables, has been widely used in various studies [39]. Autumn meanvisibility was treated as the left field whereas the autumn mean precipitation was treated as the right field. The coupling relationship between the anomalous distribution of autumn mean precipitation and the variation of visibility has been investigated using SVD analysis. It should be pointed out that only the simultaneous correlation was considered in this study due to the large spatial variation and short life period of aerosol particles.The variance contribution, cumulative variance and correlation coefficient for the first five SVD modes of singular vector were shown in Table 1. It was found that the first five pairs of singular vector contributed up to 75% of the total variance. Thus, they can be used to depict the coupling relationship of precipitation and visibility variations over Mid-Eastern China. The first mode of visibility and precipitation indicated a significant decrease of temporal coefficient (R =0.87, P <0.01). The heterogeneous correlation coefficient of the right field of the mode for visibility and precipitation was dominated by positive values, with negative correlation found over a few small regions. High positive correlation was found over Southeastern China and Northeastern China (17.5°–36°N, 105°–120°E), which was characterized by the significant coupling of the first mode. Thus, it can be inferred from the consistence of spatial variations between aerosol and precipitation that aerosol couldNo.3 CHEN Si-yu ( ), HUANG Jian-ping ( ) et al. 247247have large impacts on precipitation, with more aerosolloadings and lower precipitation.Figure 4. Spatial distribution of AOD retrievals from MODIS averaged for the autumns of 2002-2008 (a) and the corrected visibility for the autumns of 1959-2008 (b) over Mid-Eastern China.Table 1. The variance contribution, cumulative variance and correlation coefficient explained by the first five pairs (q =1, 2, 3, 4, 5) of singular vector in this study.Singular vector Variance contribution Cumulativevariance Correlation coefficient q =1 36.56% 36.56% 0.83 q =2 21.34% 58.19% 0.90 q =3 7.94% 66.13% 0.92 q =4 6.50% 72.63% 0.87 q =5 4.86%77.47%0.90By absorbing and scattering radiation, aerosols could alter regional atmospheric stability and vertical motions, and affect the large-scale circulation and hydrologic cycle with significant regional climate effects [40-43]. In addition, aerosol particles serve ascondensation nuclei for the formation of both cloud droplets and atmospheric ice particles, exerting large influence on the formation of precipitation [44-48]. With the rapid development of urbanization, pollutant emission has increased dramatically over Mid-Eastern China for the last few decades. Due to the production of more black carbon aerosols and sulfate aerosols, Mid-Eastern China became the unique experimental region for studying the impacts of aerosol on regional climate and hydrological cycle. Next, we try to focus on the effects of aerosol mechanisms on autumn precipitation from the perspective of atmospheric stability conditions and the cloud microphysical conditions.3.3.3 C HANGE TRENDS OF CONVECTIVE AVAILABLEPOTENTIAL ENERGY (CAPE), CONVECTIVE INHIBITION ENERGY AND REVISED VISIBILITYFigure 5 shows the temporal variations of CAPE, Convective Inhibition Energy (CIN) and revised visibility in autumn averaged over Mid-Eastern China during the past 50 years. High CAPE was accompanied by low CIN, suggesting an inverse correlation between CAPE and CIN. CIN increased by 28.67 J/kg per decade, while CAPE decreased by 12.81 J/Kg per decade. More specifically, air stability increased significantly after the 1980s, accompanied by the decrease of CIN by –2.1%/year and the increase of CAPE by 4.7%/year.A decreasing trend (i.e. –2.7%/year) was found for visibility variation, which was consistent with the trend of CAPE. Thus, it can be concluded that aerosols could suppress vertical motion of air and increase regional atmospheric stability, resulting in the decrease of autumn mean precipitation.3.3.4 R ELATIONSHIP BETWEEN AEROSOLS AND CLOUDEFFECTIVE PARTICLE RADIUSFigure 6 shows the comparison of autumn mean aerosol optical depth and cloud droplet effective radius under different cloud top temperature and liquid water path for 2002–2008. The solid line represents the relationship between aerosols and cloud effective particle radius when liquid water path exceeds 70 g m -2. A positive correlation between cloud droplet effective radius and liquid water path could be found when the magnitude of aerosol optical depth was lower than 0.2. Cloud droplet effective radius decreases quickly with the increase of aerosol optical depth, which is more significant with higher cloud top temperature. A decrease of cloud droplet effective radius (i.e. 5 m) was found with the increase of aerosol optical depth when cloud droplet effective radius exceeds 289 K. Thus, it can be inferred that more aerosols in autumn over Mid-Eastern China lead to smaller cloud droplet effective radius, which in turn decreases the conversion efficiency of cloud droplet into raindrop248 Journal of Tropical Meteorology Vol.20248and suppresses the formation of precipitation in autumn.Figure 5. The first SVD mode of the autumn visibility and autumn precipitation for the period 1980-2005. (a) The temporal coefficients of autumn visibility (solid line) and autumn precipitation (dash line); (b) The spatial pattern of heterogeneous correlation coefficient.From the perspective of precipitation formation mechanism, increased atmospheric stability and modified cloud microphysics could result in the decrease of autumn precipitation over Mid-Eastern China. Increased atmospheric stability induced by more aerosols may decrease the surface net radiation, inhibit the ascending motion of air and decrease the formation of precipitation. On the other hand, aerosols also change the characteristics of cloud microphysics by influencing the process of cloud condensation nucleus and lead to decreased precipitation. 4 CONCLUSIONS AND DISCUSSION In this study, the effects of aerosol on the autumn precipitation over Mid-Eastern China were investigated using ground observations, satellite retrievals and NCEP reanalysis dataset. Main conclusions are as follows.Precipitation decreased more significantly in autumn (i.e. 54.3 mm/decade) than in other seasons during the past 50 years over Mid-Eastern China. The decreasing trend of autumn precipitation was more significant after the 1980s, with an average decrease of 5.6% per year.From the perspective of precipitation formation mechanisms, water vapor, atmospheric stability and cloud microphysics could lead to the decrease of autumn precipitation. We found that the increased aerosols produced by enhanced industrialization and environmental pollution could result in the change of atmospheric stability and cloud microphysics, which were at least partly responsible for the decreased autumn precipitation observed over Mid-Eastern China for the past 20 years.The effects of aerosol on autumn precipitation were more outstanding than that on other seasons because the weather system in autumn was relatively stable compared to that in other seasons and the dynamical influence was greater than that of thermal dynamical activity. The wet removal of precipitation on aerosol was relatively small in autumn compared to that in summer, leading to the greater effects of aerosol on precipitation in autumn than in summer. Generally speaking, the high frequency of dust aerosol occurred in spring, which may be caused by relatively high frequency of convective weather outbreak and the dry loose soil. However, the impact of dynamical activity in spring also plays an important role in the spring precipitation change. Therefore it is hard to distinguish which factor is the most significant for precipitation change in spring. In winter, various types of precipitation could occur, including rain, snow and hail, leading to larger difficulty in detecting precipitation in winter than in other seasons. Furthermore, relatively more stable weather systems near the surface and the stable visibility could both lead to difficulty in studying the aerosol variations in winter. Thus, the precipitation change in winter was not considered in this study.In summary, the effects of aerosols on autumn precipitation change over Mid-Eastern China were demonstrated using observed datasets from the perspective of precipitation formation mechanisms. More efforts will be spent to study the physical interactions between precipitation change and aerosol variations.No.3 CHEN Si-yu ( ), HUANG Jian-ping ( ) et al. 249249Figure 6. Time series of convective available potential energy (dash line), convective inhibition energy (solid line) and revised visibility (red histogram) anomalies in autumn over Mid-Eastern China. The red line represents linear trend of revised visibility anomaly.Acknowledgement: We appreciate three anonymous reviewers for their valuable comments and suggestions. The contribution of PNNL in this research was supported by the Office of Science of the U.S. Department of Energy as part of the Regional & Global Climate Modeling (RGCM) Program through the bilateral agreement between U.S. Department of Energy and China Ministry of Science and Technology on regional climate research. The Pacific Northwest National Laboratory is operated for DOE by Battelle Memorial Institute under contract DE-AC06-76RLO 1830. And we also thank Dr. SHANG Ke-zheng, Dr. WANG Tian-he, SHAN Hai-xia and WANG Shan-shan from Lanzhou University for their help in this study.REFERENCES:[1] ZHU Qian-gen, LIN Jin-rui, SHOU Shao-wen, et al. The principle and method of Synoptic meteorology [M]. Beijing: China Meteorological Press, 2000: 458.[2] JIAN Mao-qiu, LUO Hui-bang, QIAO Yun-ting. Linkage between the interannual variation patterns of seasonal SST in Indian Ocean-Pacific and their relationship with the summer rainfall over China [J]. J. Trop. Meteor., 2006, 22(2): 131-137. [3] ZHANG Tian-Yu, SUN Zhao-bo, LI Zhong-Xian, et al. Relation between Spring Kuroshto SSTA and summer rainfall in China [J]. J. Trop. Meteor., 2007, 23(2): 189-195.[4] CHEN Shao-dong, WANG Qian-qian, QIAN Yong-pu. Preliminary discussions of basic climatic characteristics of precipitation during raining seasons in regions south of Changjiang River and its relationship with SST anomalies [J]. J. Trop. Meteor., 2003, 19(3): 260-268.[5] JIN Zu-hui, LUO Shao-hua. On the relationship between rainfall anomaly in middle and lower Yangtze valley during the Mei-Yu season and the anomaly of sea-surface temperature in South China Sea [J]. Acta Meteor. Sinica, 1986, 44(3): 360-372.[6] CHEN Yun, SHI Neng. Spatial and temporal distribution of autumn precipitation and temperature in China and climatic change [J]. J. Nanjing Instit. Meteor., 2003, 26(5): 662-630. [7] XU Gui-Yu, LIN Chun-Yu. Survey of the causes and features of autumn rain in Western China [J]. Sci. Meteor. Sinica, 1994, 12(4): 149-154.[8] LI Yao-hui, LI Dong-liang, ZHAO Qing-Yun. A study on spring rainfall anomaly in Northwest China and Pacific SSTA features in autumn and their correlations [J]. Plateau Meteor., 2000, 19(1): 100-110.[9] LI Yao-hui, LI Dong-liang, ZAHO Qing-yun. An analysis on characteristic of autumn rainfall anomaly in Northwest China [J]. Plateau Meteor., 2001, 20(2): 94-99.[10] LI Yao-hui, LI Dong-liang, ZHAO Qing-yun et al. Effect of ENSO on the autumn rainfall anomaly in northwest China [J]. Clim. Environ. Res., 2000, 25(2): 102-112.[11] SONG Lian-chun, ZHANG Cun-jie. Changing features of precipitation over Northwest China during the 20th century [J]. J. Glaciol. Geocry., 2003, 25(2): 143-147.[12] ZHANG Cun-jie, GAO Xue-jie, ZHAO Hong-yan. Impact of global warming on autumn precipitation in Northwest China [J]. J. Glaciol. Geocry., 2003, 25(2): 157-164.[13] SHI Neng. The temporal and spatial characteristics of monthly temperature and rainfall field during autumn and winter in China and their application in early summer precipitation forecasting [J]. Chin. J. Atmos. Sci., 1988, 12(3): 283-291.[14] HUANG J, MINNIS P, LIN B, et al. Possible influences of Asian dust aerosols on cloud properties and radiative forcing observed from MODIS and CERES [J]. Geophys. Res. Lett., 2006, 33, L06824, doi: 10.1029/2005GL024724.[15] CHEN Si-yu, HUANG Jian-ping, LIU Jin-jin, et al. Effects of dust aerosols on cloud in semi-arid regions as inferred from OMI and MODIS retrievals [J]. Adv. Ear. Sci., 2010, 25, doi: 1001-8166(2010) add- 0188-11.[16] HUANG J, MINNIS P, LINin B, et al. Advanced retrievals of multilayered cloud properties using multispectral。
高考英语考前突破阅读理解能力科普类人火山喷发与寒冷天气的关系素材

火山喷发与寒冷天气的关系Medieval chronicles have given an international group of researchers a glimpse into the past to assess how historical volcanic eruptions affected the weather in Ireland up to 1500 years ago. By criticall y assessing over 40,000 written entries in the Irish Annals and comparing them with measurements taken from ice cores, the researchers successfully linked the climatic aftermath of volcanic eruptions to extreme cold weather events in Ireland over a 1200-year period from 431 to 1649.Their study, which has been published today, 6 June, in IOP Publishing's journal Environmental Research Letters, showed that over this timescale up to 48 explosive vo lcanic eruptions could be identified in the Greenland Ice Sheet Project (GISP2) ice-core, which records the deposition(沉积物) of volcanic sulf ate in annual layers of ice.Of these 48 volcanic events, 38 were associated, closely in time, with 37 extreme cold events, which were identified by systematically examining written entries in the Irish Annals a nd picking out directly observed meteorological phenomena and conditions, such as heavy snowfall and frost, prolonged ice covering lakes and rivers, and contemporary descriptions of abnormally cold weather.Lead author of the study, Dr Francis Ludlow, from the Harvard University Center for the Environment and Department of History, said: "It's clear that the scribes of the Iris h Annals were diligent reporters of severe cold weathe r, most probably because of the negative impacts this had on societ y and the biosphere."Our major result is that explosive volcanic eruptions are strongly, and persistently, implicated in the occurrence of cold weather events over this long times cale in Ireland. In their severity, these events are quite rare for the country's mild maritime climate."Through the injec tion of sulphur dioxide gas into the stratosphere, volcanic eruptions can play a significant role in the regulation of the Earth's climate. Sulphur dioxide gas is converted into sulphate(硫酸盐) aerosol particles after eruptions which reflect incoming sunlight and result in an overall temporary cooling of the Earth's surface.Whilst the global effects of recent eruptions are quite well-known, such as the Mount Pinatubo eruption almost 22 years ago (15 June 1991), less is known about their effects on climate before the beginning of instrum ental weather recording, or their effects on regional scales; the Irish Annals provided an opportunity to explore both of these issues.The Irish Annals contain over one million written words and around 40,000 dist i nct written entries, detailing major historical events on an annual basis, and providing both systematic and sustained reporting of meteorological extremes.。
雾化吸入疗法

定量吸入器的四步吸入法(三)
将喷口放在口内,并合上嘴 唇含着喷口。在开始通过口 部深深地、缓慢地吸气后, 马上按下药罐将药物释出, 并继续深吸气。
定量吸入器的四步吸入法(四)
屏息10秒,或在没有不适的感 觉下尽量屏息久些,然后才缓 慢呼气。 若需要多吸一剂,应等待至 少一分钟后再重做第二、三 四步骤。 用后,将盖套回喷口上。
雾化吸入疗法
湖南省人民医院儿科医学中心 钟礼立
内容
1
雾化吸入疗法的历史及概念
常见吸入方法及特点 2
常见雾化吸入药物 3
4
雾化吸入的临床运用
雾化吸入的概念
雾化吸入疗法是利用气体射流原理,将水滴撞击的微小雾 滴悬浮于气体中,形成气雾剂而输入呼吸道,进行呼吸道 湿化或药物吸入的治疗方法,作为全身治疗的辅助和补充
2003年起,我国《儿童支气管哮喘防治常规》和《儿童 支气管哮喘诊断与防治指南》也把吸入疗法作为防治哮 喘的首选疗法4,5
1.苏长海、卢立山. 吸入法治疗哮喘发展史. 中国药师. 2008;11(8):985-7. 2.Global Initiative for Asthma: Global Strategy for Asthma management and Prevention (updated 2008). 3.Global Initiative for Asthma: Global Strategy for Asthma management and Prevention (updated 2009). 4.中华医学会儿科学分会呼吸学组. 儿童支气管哮喘防治常规(试行). 2004;42(2):100-6. 5.中华医学会儿科学分会呼吸学组. 儿童支气管哮喘诊断与防治指南.中华儿科杂志. 2008,46(10):745-53.
南昌一次持续雾霾天气成因分析_邹琳

南昌一次持续雾霾天气成因分析邹琳1,罗凝谊2,段志萍11、南昌市气象局江西南昌330038,2、眉山市气象局,四川眉山620020摘要:本文对气溶胶颗粒物的分布特征与气象因子在雾霾天气条件下的关系进行了分析。
并以2013年冬季的一次典型的雾霾持续过程为例进行相关性分析,利用气象观测数据、L波段雷达观测数据和Grimm180颗粒物检测仪观测数据进一步分析PM10、PM2.5、PM1.0颗粒物的演变特征、气象要素特征及此次雾霾过程的成因。
通过分析此次雾霾过程的数据表明,南昌地区1月下旬气温显著偏高,潮湿少雨,受高压天气系统控制,长时间近地面逆温层的稳定存在和近地面风速较小等影响,非常不利于大气污染物的扩散和清除,是造成这次持续雾霾天气过程的主要原因。
同时也验证了PM10、PM2.5、PM1.0与风速呈明显的负相关关系,即风速越大,颗粒物浓度越小;地面风向为E时,南昌出现霾的次数最多;PM10、PM2.5、PM1.0与能见度呈现明显的负相关性,即气溶胶颗粒物的浓度增加时,能见度明显降低;在未降水日PM10、PM2.5、PM1.0与相对湿度呈明显的正相关性;当产生降水时,降水对PM10、PM2.5、PM1.0的清除作用显著,PM10、PM2.5、PM1.0与相对湿度呈负相关性。
关键词:南昌气溶胶颗粒物雾霾气象要素Nanchang characteristics of fog and hazeZOU Lin1,LU Ningyi2,Duanzhiping111、Nanchang Meteorological Bureau,Jiangxi330046,2、Meishan Meteorological Bureau,Sichuan Meishan620020Abstract:The relation between the distribution characteristics of aerosol particulate matter(PM)and meteorological factors in hazy weather is also analyzed in this thesis.A typical continuing hazy weather in the winter of2013is taken as an example in correlation analysis. Furthermore,this thesis also further analyzes the characteristics of evolution and meteorological elements of PM10,PM2.5and PM1.0,and the causes of this hazy weather throµgh observation data of meteorology,L wave radar and GRIMMI180PM Detector.It is sµggested by the analysis of haze data that the temperature of Nanchang is significantly higher in the last ten days of January,and along with the moist and rainless weather,the control of high pressure 1课题项目:2013年江西省气象局局面上科研项目“江西主要城市灰霾天气气候特征及成因分析”;2013年度南昌市气象防灾减灾技术研发基金项目“南昌气溶胶颗粒物与气象条件的关系”。
- 1、下载文档前请自行甄别文档内容的完整性,平台不提供额外的编辑、内容补充、找答案等附加服务。
- 2、"仅部分预览"的文档,不可在线预览部分如存在完整性等问题,可反馈申请退款(可完整预览的文档不适用该条件!)。
- 3、如文档侵犯您的权益,请联系客服反馈,我们会尽快为您处理(人工客服工作时间:9:00-18:30)。
$849
$850
Abstracts of the 1999 European Aerosol Conference
with increasing applied voltages, and downstream distance from reactor exit, (3) However, it depends on applied voltage, (4) The particle size between 0.05 to 4 mm observed for all of distance however, only 7.66 mm can observed at wall. ACKNOWLEDGEMENTS The authors wish to express their thanks to T. Ohkubo, S. Kanazawa G. F. Round, I. Tomicic and J.Y. Park for valuable discussions and comments. This work is supported by STEH, R of Korea Grants.
5O
45
~ 4o
~ 3o ~ 2s ~. 20 E_ lO z
5
(Hale Waihona Puke I ~ 4Nm31h .l
"
o
~o
~ 2s
[ L ; 4,5N m 31h i
L~
E3
._~
~ .! 15 .u
C
4,
9
i
U
4.
i
O 0 S
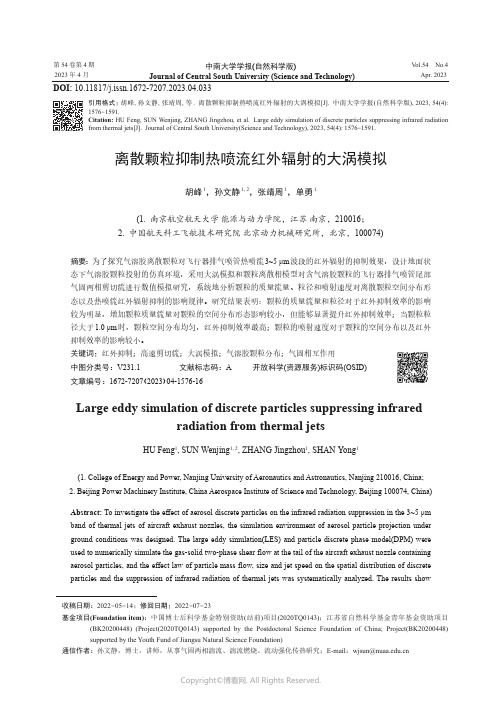
25 10 15 20 applied voltage [kV]
30
0
0
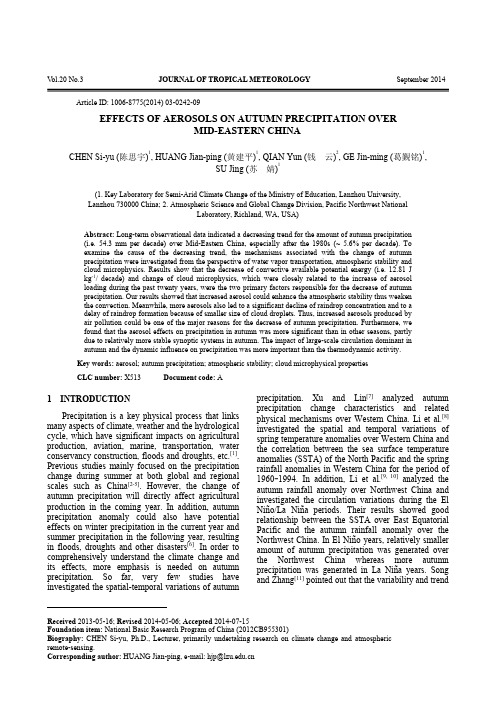
10 20 30 40 50 60 70 80 distance from reactor exit [cm]
REFERENCE [1] J. S. Chang, J. Aerosol Sci., 20:1087-1090(1989). [2] K. Urashima, T. [to and J. S. Chang, J. Aerosol ScL, 29:$621-622(1998) [3] J. S. Chang, K. Urashima, M. Arquilla, T. Ito, J. Comb. ScL & Tech., 133, 31-47 (1997)
80 70 60 50 Fraction of 40 particles(%)3~
21
actor Ocm tOcm 10cm "0.1 0.9 1.8 2.4 Particle 3.3 4.3 5.3 [xl0-6m] 7.0 8.5 14.6
wall
ld
size
Fig.1
Aerosol size distribution for various distance from corona radical shower reactor 35
Pergamon
J,4erosolSci. VoL 30, Suppl. l,pp. $849-$850, 1999 © 1999 Published by Elsevier Science Ltd. All rights reserved Printed in Great Britain 0021-8502/99/$ - see front matter
Fig.2 Aerosol particle density as a function of applied voltage for various gas flow rate.
Fig.3 Mean particle diameters along the d o w n s t r e a m flow piping system.
CHARACTERISTICS OF AEROSOL PARTICLES FROM CORONA DISCHARGE AMMONIA RADICAL INJECTION DESULPHURIZATION AND DENITRIFICATION PROCESSES FOR FLUE GASES CLEANINGS K. Urashima, S, £ Kim* and £ S. Chang Dept. of Eng. Phys., McMaster University, Hamilton, Ontario, Canada L8S 4MI *On leave from KIMM, Teajan, Republic of Korea KEYWORDS corona discharge, aerosol particle size distribution, denification, aerosol density, desulphurization INTRODUCTION Non-thermal plasma techniques offer an innovative approach to the problem of cleaning various polhitant gases such as NO~, SO2, HCI and H2S from coal, oil, natural gas and waste incinerator combustion flue gases. In this work, we focussed on the study of the aerosol particles formations during the denitrification and desulphurization of acid flue gases by a corona discharge ammonia radical shower system. EXPERIMENTAL APPARATUS The test flow loop consists of gas flow controllers for mixture gases, corona discharge radical shower reactors, condensation nucleation particle counting (CNPC) system, electrostatic precipitator (ESP), FFIR gas sampling system and gas monitors. A retro-fit type corona radical shower electrode consisted of a metal main tube with 28 hollow staggered position electrodes in the side of robe, where N2-NH3 (5%) mixture (99.999°/6 pure) gas with air exists from hollows and flow stabilized corona discharge is initiated. A grounded plate type electrode was located on the wall surface of the reactor air flows in the flow ducts, Aerosol particles generated by plasma induced processes were measured by CNPC system before and after electrostatic precipitator and deposited aerosol particles downstream of plasma reactor were analyzed by scanning electron microscopes (SEM) with image analyses. The electrostatic precipitator used in the present investigation was a wire-plate type dc ESP with three sections. Simulated combustion flue gas test are mixture of N2O2-CO2(balance)-NO(0.02 %)-SO2(0,08%)-H2S(0,0 l%). EXPERIMENTAL RESULTS SEM images of all aerosol particles deposited at l 0, 40, 70 cm downstream of reactor and reactor wall shows that the aerosol generated are submicron non-spherical shaped particles with the particle radius size between 0.1 to 1.5 ~tm (Fig. 1). The particle density as a function of applied voltage is shown in Fig.2 for various gas flow rates. The formation of aerosol particles depends on applied voltages of the corona shower system and the maximum density of 45,000 Pt/cm3 particle concentration is observed at 20kV. Also, high flow rate results indicated higher density than low flow rate. Mean particle diameters along the downstream flow piping system is shown in Fig.3. The distance of 10 to 70 cm from reactor exit shows that the mean particle diameter is increasing with increasing distance for 3Nm3/h. However, 4.5Nm3/h case shows that mean particle diameter nonmonotonically depend on distance. As has been reported [ 1-3] the most acid gases are simultaneously removed by the heterogeneous reactions at aerosol particle surface since aerosols adsorb significant amount of ammonia. Hence, the growth of aerosol particles sizes and increasing aerosol concentration as observed in the present experiment may be due to aerosol particle surface reactions to from ammonia sulfate and nitrates with adsorbing NH3. CONCLUDING REMARKS The results show that: (1) Formation of significant amounts of ammonia sulphate, ammonia chloride and ammonia nitrate and their mixture aerosol particles were observed; (2)Aerosol particle size increased