美赛论文模板(强烈推荐)
美赛论文模版
摘要:第一段:写论文解决什么问题1.问题的重述a. 介绍重点词开头:例1:“Hand move” irrigation, a cheap but labor-intensive system used on small farms, consists of a movable pipe with sprinkler on top that can be attached to a stationary main.例2:……is a real-life common phenomenon with many complexi t ies.例3:An (effective plan) is crucial to………b. 直接指出问题:例1:We find the optimal number of tollbooths in a highway toll-plaza for a given number of highway lanes: the number of tollbooths that minimizes average delay experienced by cars.例2:A brand-new university needs to balance the cost of information technology security measures wi t h the potential cost of attacks on its systems.例3:We determine the number of sprinklers to use by analyzing the energy and motion of water in the pipe and examining the engineering parameters of sprinklers available in the market.例4: After mathematically analyzing the …… problem, our modeling group would like to present our conclusions, strategies, (and recommendations )to the …….例5:Our goal is... that (mini mizes the time )……….2.解决这个问题的伟大意义反面说明。
美国大学生数学建模比赛的论文格式
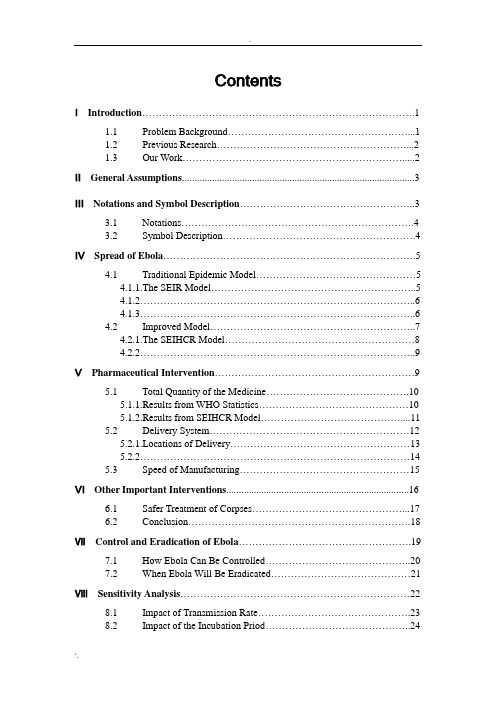
ContentsⅠIntroduction (1)1.1Problem Background (1)1.2Previous Research (2)1.3Our Work (2)ⅡGeneral Assumptions (3)ⅢNotations and Symbol Description (3)3.1 Notations (4)3.2 Symbol Description (4)ⅣSpread of Ebola (5)4.1 Traditional Epidemic Model (5)4.1.1.The SEIR Model (5)4.1.2 (6)4.1.3 (6)4.2 Improved Model (7)4.2.1.The SEIHCR Model (8)4.2.2 (9)ⅤPharmaceutical Intervention (9)5.1 Total Quantity of the Medicine (10)5.1.1.Results from WHO Statistics (10)5.1.2.Results from SEIHCR Model (11)5.2 Delivery System (12)5.2.1.Locations of Delivery (13)5.2.2 (14)5.3 Speed of Manufacturing (15)ⅥOther Important Interventions (16)6.1 Safer Treatment of Corpses (17)6.2 Conclusion (18)ⅦControl and Eradication of Ebola (19)7.1 How Ebola Can Be Controlled (20)7.2 When Ebola Will Be Eradicated (21)ⅧSensitivity Analysis (22)8.1 Impact of Transmission Rate (23)8.2 Impact of the Incubation Priod (24)ⅨStrengths and Weaknesses (25)9.1 Strengths (26)9.2 Weaknesses (27)9.3 Future Work (28)Letter to the World Medical Association (30)References (31)ⅠIntroduction1.1.Promblem Background1.2.Previous Research1.3.Our WorkⅡGeneral Assumptions●●ⅢNotations and Symbol Description3.1. Notataions3.2. Symbol DescriptionSymbol DescriptionⅣSpread of Ebola4.1. Traditional Epidemic Model4.1.1. The SEIR Model4.1.2. Outbreak Data4.1.3. Reslts of the SEIR Model4.2. Improved Model4.2.1. The SEIHCR Model4.2.2. Choosing paametersⅤPharmaceutical Intervention 5.1. Total Quantity of the Medicine 5.1.1. Results from WHO Statistics5.2. Delivery System5.2.1. Locations of Delivery5.2.2. Amount of Delivery5.3. Speed of Manufacturong5.4. Medicine EfficacyⅥOther Important Interventions 6.1. Safer Treatment of Corpses6.2. ConclusionⅦControl and Eradication of Ebola 7.1. How Ebola Can Be Controlled7.2. When Ebola Will Be EradicatedⅧSensitivity Analysis8.1. Impact of Transmission Rate8.2. Impact of Incubation PeriodⅨStrengths and Weaknesses 9.1. Strengths●●●9.2. Weaknesses●●●9.3.Future WorkLetter to the World Medical AssociationTo whom it may concern,Best regards,Team #32150References [1][2][3][4]。
数学建模美赛一等奖优秀专业论文
For office use onlyT1________________ T2________________ T3________________ T4________________ Team Control Number52888Problem ChosenAFor office use onlyF1________________F2________________F3________________F4________________Mathematical Contest in Modeling (MCM/ICM) Summary SheetSummaryIt’s pleasant t o go home to take a bath with the evenly maintained temperature of hot water throughout the bathtub. This beautiful idea, however, can not be always realized by the constantly falling water temperature. Therefore, people should continually add hot water to keep the temperature even and as close as possible to the initial temperature without wasting too much water. This paper proposes a partial differential equation of the heat conduction of the bath water temperature, and an object programming model. Based on the Analytic Hierarchy Process (AHP) and Technique for Order Preference by Similarity to Ideal Solution (TOPSIS), this paper illustrates the best strategy the person in the bathtub can adopt to satisfy his desires. First, a spatiotemporal partial differential equation model of the heat conduction of the temperature of the bath water is built. According to the priority, an object programming model is established, which takes the deviation of temperature throughout the bathtub, the deviation of temperature with the initial condition, water consumption, and the times of switching faucet as the four objectives. To ensure the top priority objective—homogenization of temperature, the discretization method of the Partial Differential Equation model (PDE) and the analytical analysis are conducted. The simulation and analytical results all imply that the top priority strategy is: The proper motions of the person making the temperature well-distributed throughout the bathtub. Therefore, the Partial Differential Equation model (PDE) can be simplified to the ordinary differential equation model.Second, the weights for the remaining three objectives are determined based on the tolerance of temperature and the hobby of the person by applying Analytic Hierarchy Process (AHP) and Technique for Order Preference by Similarity to Ideal Solution (TOPSIS). Therefore, the evaluation model of the synthesis score of the strategy is proposed to determine the best one the person in the bathtub can adopt. For example, keeping the temperature as close as the initial condition results in the fewer number of switching faucet while attention to water consumption gives rise to the more number. Third, the paper conducts the analysis of the diverse parameters in the model to determine the best strategy, respectively, by controlling the other parameters constantly, and adjusting the parameters of the volume, shape of the bathtub and the shape, volume, temperature and the motions and other parameters of the person in turns. All results indicate that the differential model and the evaluation model developed in this paper depends upon the parameters therein. When considering the usage of a bubble bath additive, it is equal to be the obstruction between water and air. Our results show that this strategy can reduce the dropping rate of the temperatureeffectively, and require fewer number of switching.The surface area and heat transfer coefficient can be increased because of the motions of the person in the bathtub. Therefore, the deterministic model can be improved as a stochastic one. With the above evaluation model, this paper present the stochastic optimization model to determine the best strategy. Taking the disparity from the initial temperature as the suboptimum objectives, the result of the model reveals that it is very difficult to keep the temperature constant even wasting plentiful hot water in reality.Finally, the paper performs sensitivity analysis of parameters. The result shows that the shape and the volume of the tub, different hobbies of people will influence the strategies significantly. Meanwhile, combine with the conclusion of the paper, we provide a one-page non-technical explanation for users of the bathtub.Fall in love with your bathtubAbstractIt’s pleasant t o go home to take a bath with the evenly maintained temperature of hot water throughout the bathtub. This beautiful idea, however, can not be always realized by the constantly falling water temperature. Therefore, people should continually add hot water to keep the temperature even and as close as possible to the initial temperature without wasting too much water. This paper proposes a partial differential equation of the heat conduction of the bath water temperature, and an object programming model. Based on the Analytic Hierarchy Process (AHP) and Technique for Order Preference by Similarity to Ideal Solution (TOPSIS), this paper illustrates the best strategy the person in the bathtub can adopt to satisfy his desires. First, a spatiotemporal partial differential equation model of the heat conduction of the temperature of the bath water is built. According to the priority, an object programming model is established, which takes the deviation of temperature throughout the bathtub, the deviation of temperature with the initial condition, water consumption, and the times of switching faucet as the four objectives. To ensure the top priority objective—homogenization of temperature, the discretization method of the Partial Differential Equation model (PDE) and the analytical analysis are conducted. The simulation and analytical results all imply that the top priority strategy is: The proper motions of the person making the temperature well-distributed throughout the bathtub. Therefore, the Partial Differential Equation model (PDE) can be simplified to the ordinary differential equation model.Second, the weights for the remaining three objectives are determined based on the tolerance of temperature and the hobby of the person by applying Analytic Hierarchy Process (AHP) and Technique for Order Preference by Similarity to Ideal Solution (TOPSIS). Therefore, the evaluation model of the synthesis score of the strategy is proposed to determine the best one the person in the bathtub can adopt. For example, keeping the temperature as close as the initial condition results in the fewer number of switching faucet while attention to water consumption gives rise to the more number. Third, the paper conducts the analysis of the diverse parameters in the model to determine the best strategy, respectively, by controlling the other parameters constantly, and adjusting the parameters of the volume, shape of the bathtub and the shape, volume, temperature and the motions and other parameters of the person in turns. All results indicate that the differential model and the evaluation model developed in this paper depends upon the parameters therein. When considering the usage of a bubble bath additive, it is equal to be the obstruction between water and air. Our results show that this strategy can reduce the dropping rate of the temperature effectively, and require fewer number of switching.The surface area and heat transfer coefficient can be increased because of the motions of the person in the bathtub. Therefore, the deterministic model can be improved as a stochastic one. With the above evaluation model, this paper present the stochastic optimization model to determine the best strategy. Taking the disparity from the initial temperature as the suboptimum objectives, the result of the model reveals that it is very difficult to keep the temperature constant even wasting plentiful hotwater in reality.Finally, the paper performs sensitivity analysis of parameters. The result shows that the shape and the volume of the tub, different hobbies of people will influence the strategies significantly. Meanwhile, combine with the conclusion of the paper, we provide a one-page non-technical explanation for users of the bathtub.Keywords:Heat conduction equation; Partial Differential Equation model (PDE Model); Objective programming; Strategy; Analytical Hierarchy Process (AHP) Problem StatementA person fills a bathtub with hot water and settles into the bathtub to clean and relax. However, the bathtub is not a spa-style tub with a secondary hearing system, as time goes by, the temperature of water will drop. In that conditions,we need to solve several problems:(1) Develop a spatiotemporal model of the temperature of the bathtub water to determine the best strategy to keep the temperature even throughout the bathtub and as close as possible to the initial temperature without wasting too much water;(2) Determine the extent to which your strategy depends on the shape and volume of the tub, the shape/volume/temperature of the person in the bathtub, and the motions made by the person in the bathtub.(3)The influence of using b ubble to model’s results.(4)Give a one-page non-technical explanation for users that describes your strategyGeneral Assumptions1.Considering the safety factors as far as possible to save water, the upper temperature limit is set to 45 ℃;2.Considering the pleasant of taking a bath, the lower temperature limit is set to 33℃;3.The initial temperature of the bathtub is 40℃.Table 1Model Inputs and SymbolsSymbols Definition UnitT Initial temperature of the Bath water ℃℃T∞Outer circumstance temperatureT Water temperature of the bathtub at the every moment ℃t Time hx X coordinates of an arbitrary point my Y coordinates of an arbitrary point mz Z coordinates of an arbitrary point mαTotal heat transfer coefficient of the system 2()⋅/W m K1SThe surrounding-surface area of the bathtub 2m 2S The above-surface area of water2m 1H Bathtub’s thermal conductivity/W m K ⋅() D The thickness of the bathtub wallm 2H Convection coefficient of water2/W m K ⋅() a Length of the bathtubm b Width of the bathtubm h Height of the bathtubm V The volume of the bathtub water3m c Specific heat capacity of water/()J kg ⋅℃ ρ Density of water3/kg m ()v t Flooding rate of hot water3/m s r TThe temperature of hot water ℃Temperature ModelBasic ModelA spatio-temporal temperature model of the bathtub water is proposed in this paper. It is a four dimensional partial differential equation with the generation and loss of heat. Therefore the model can be described as the Thermal Equation.The three-dimension coordinate system is established on a corner of the bottom of the bathtub as the original point. The length of the tub is set as the positive direction along the x axis, the width is set as the positive direction along the y axis, while the height is set as the positive direction along the z axis, as shown in figure 1.Figure 1. The three-dimension coordinate systemTemperature variation of each point in space includes three aspects: one is the natural heat dissipation of each point in space; the second is the addition of exogenous thermal energy; and the third is the loss of thermal energy . In this way , we build the Partial Differential Equation model as follows:22212222(,,,)(,,,)()f x y z t f x y z t T T T T t x y z c Vαρ-∂∂∂∂=+++∂∂∂∂ (1) Where● t refers to time;● T is the temperature of any point in the space;● 1f is the addition of exogenous thermal energy;● 2f is the loss of thermal energy.According to the requirements of the subject, as well as the preferences of people, the article proposes these following optimization objective functions. A precedence level exists among these objectives, while keeping the temperature even throughout the bathtub must be ensured.Objective 1(.1O ): keep the temperature even throughout the bathtub;22100min (,,,)(,,,)t t V V F t T x y z t dxdydz dt t T x y z t dxdydz dt ⎡⎤⎡⎤⎛⎫=-⎢⎥ ⎪⎢⎥⎢⎥⎣⎦⎝⎭⎣⎦⎰⎰⎰⎰⎰⎰⎰⎰ (2) Objective 2(.2O ): keep the temperature as close as possible to the initial temperature;[]2200min (,,,)tV F T x y z t T dxdydz dt ⎛⎫=- ⎪⎝⎭⎰⎰⎰⎰ (3) Objective 3(.3O ): do not waste too much water;()30min tF v t dt =⋅⎰ (4) Objective 4(.4O ): fewer times of switching.4min F n = (5)Since the .1O is the most crucial, we should give priority to this objective. Therefore, the highest priority strategy is given here, which is homogenization of temperature.Strategy 0 – Homogenization of T emperatureThe following three reasons are provided to prove the importance of this strategy. Reason 1-SimulationIn this case, we use grid algorithm to make discretization of the formula (1), and simulate the distribution of water temperature.(1) Without manual intervention, the distribution of water temperature as shown infigure 2. And the variance of the temperature is 0.4962. 00.20.40.60.8100.51 1.5200.5Length WidthH e i g h t 4242.54343.54444.54545.5Distribution of temperature at the length=1Distribution of temperatureat the width=1Hot water Cool waterFigure 2. Temperature profiles in three-dimension space without manual intervention(2) Adding manual intervention, the distribution of water temperature as shown infigure 3. And the variance of the temperature is 0.005. 00.5100.51 1.5200.5 Length WidthH e i g h t 44.744.7544.844.8544.944.9545Distribution of temperatureat the length=1Distribution of temperature at the width=1Hot water Cool waterFigure 3. Temperature profiles in three-dimension space with manual interventionComparing figure 2 with figure 3, it is significant that the temperature of water will be homogeneous if we add some manual intervention. Therefore, we can assumed that222222()0T T T x y zα∂∂∂++≠∂∂∂ in formula (1). Reason 2-EstimationIf the temperature of any point in the space is different, then222222()0T T T x y zα∂∂∂++≠∂∂∂ Thus, we find two points 1111(,,,)x y z t and 2222(,,,)x y z t with:11112222(,,,)(,,,)T x y z t T x y z t ≠Therefore, the objective function 1F could be estimated as follows:[]2200200001111(,,,)(,,,)(,,,)(,,,)0t t V V t T x y z t dxdydz dt t T x y z t dxdydz dt T x y z t T x y z t ⎡⎤⎡⎤⎛⎫-⎢⎥ ⎪⎢⎥⎢⎥⎣⎦⎝⎭⎣⎦≥->⎰⎰⎰⎰⎰⎰⎰⎰ (6) The formula (6) implies that some motion should be taken to make sure that the temperature can be homogeneous quickly in general and 10F =. So we can assumed that: 222222()0T T T x y zα∂∂∂++≠∂∂∂. Reason 3-Analytical analysisIt is supposed that the temperature varies only on x axis but not on the y-z plane. Then a simplified model is proposed as follows:()()()()()()()2sin 000,0,,00,000t xx x T a T A x l t l T t T l t t T x x l π⎧=+≤≤≤⎪⎪⎪==≤⎨⎪⎪=≤≤⎪⎩ (7)Then we use two ways, Fourier transformation and Laplace transformation, in solving one-dimensional heat equation [Qiming Jin 2012]. Accordingly, we get the solution:()()2222/22,1sin a t l Al x T x t e a l πππ-=- (8) Where ()0,2x ∈, 0t >, ()01|x T f t ==(assumed as a constant), 00|t T T ==.Without general assumptions, we choose three specific value of t , and gain a picture containing distribution change of temperature in one-dimension space at different time.00.20.40.60.811.2 1.4 1.6 1.8200.511.522.533.54Length T e m p e r a t u r e time=3time=5time=8Figure 4. Distribution change of temperature in one-dimension space at different timeT able 2.V ariance of temperature at different timet3 5 8 variance0.4640 0.8821 1.3541It is noticeable in Figure 4 that temperature varies sharply in one-dimensional space. Furthermore, it seems that temperature will vary more sharply in three-dimension space. Thus it is so difficult to keep temperature throughout the bathtub that we have to take some strategies.Based on the above discussion, we simplify the four dimensional partial differential equation to an ordinary differential equation. Thus, we take the first strategy that make some motion to meet the requirement of homogenization of temperature, that is 10F =.ResultsTherefore, in order to meet the objective function, water temperature at any point in the bathtub needs to be same as far as possible. We can resort to some strategies to make the temperature of bathtub water homogenized, which is (,,)x y z ∀∈∀. That is,()(),,,T x y z t T t =Given these conditions, we improve the basic model as temperature does not change with space.112213312()()()()/()p r H S dT H S T T H S T T c v T T c V V dt D μρρ∞⎡⎤=++-+-+--⎢⎥⎣⎦(9) Where● 1μis the intensity of people’s movement ;● 3H is convection between water and people;● 3S is contact area between water and people;● p T is body surface temperature;● 1V is the volume of the bathtub;● 2V is the volume of people.Where the μ refers to the intensity of people ’s movement. It is a constant. However , it is a random variable in reality, which will be taken into consideration in the following.Model T estingWe use the oval-shaped bathtub to test our model. According to the actual situation, we give initial values as follows:0.19λ=,0.03D =,20.54H =,25T ∞=,040T =00.20.40.60.8125303540Time T e m p e r a t u r eFigure 5. Basic modelThe Figure 5 shows that the temperature decreases monotonously with time. And some signs of a slowing down in the rate of decrease are evident in the picture. Reaching about two hours, the water temperature does not change basically and be closely to the room temperature. Obviously , it is in line with the actual situation, indicating the rationality of this model.ConclusionOur model is robust under reasonable conditions, as can be seen from the testing above. In order to keep the temperature even throughout the bathtub, we should take some strategies like stirring constantly while adding hot water to the tub. Most important of all, this is the necessary premise of the following question.Strategy 1 – Fully adapted to the hot water in the tubInfluence of body surface temperatureWe select a set of parameters to simulate two kinds of situation separately.The first situation is that do not involve the factor of human1122()()/H S dT H S T T cV dt D ρ∞⎡⎤=+-⎢⎥⎣⎦(10) The second situation is that involves the factor of human112213312()()()/()p H S dT H S T T H S T T c V V dt D μρ∞⎡⎤=++-+--⎢⎥⎣⎦(11) According to the actual situation, we give specific values as follows, and draw agraph of temperature of two functions.33p T =,040T =204060801001201401601803838.53939.540TimeT e m p e r a t u r eWith body Without bodyFigure 6a. Influence of body surface temperature50010001500200025003000350025303540TimeT e m p e r a t u r eWith body Without bodyCoincident pointFigure 6b. Influence of body surface temperatureThe figure 6 shows the difference between two kinds of situation in the early time (before the coincident point ), while the figure 7 implies that the influence of body surface temperature reduces as time goes by . Combing with the degree of comfort ofbath and the factor of health, we propose the second optimization strategy: Fully adapted to the hot water after getting into the bathtub.Strategy 2 –Adding water intermittentlyInfluence of adding methods of waterThere are two kinds of adding methods of water. One is the continuous; the other is the intermittent. We can use both different methods to add hot water.1122112()()()/()r H S dT H S T T c v T T c V V dt D μρρ∞⎡⎤=++-+--⎢⎥⎣⎦(12) Where r T is the temperature of the hot water.To meet .3O , we calculated the minimum water consumption by changing the flow rate of hot water. And we compared the minimum water consumptions of the continuous with the intermittent to determine which method is better.A . Adding water continuouslyAccording to the actual situation, we give specific values as follows and draw a picture of the change of temperature.040T =, 37d T =, 45r T =5001000150020002500300035003737.53838.53939.54040.5TimeT e m p e r a t u r eadd hot waterFigure 7. Adding water continuouslyIn most cases, people are used to have a bath in an hour. Thus we consumed that deadline of the bath: 3600final t =. Then we can find the best strategy in Figure 5 which is listed in Table 2.T able 3Strategy of adding water continuouslystart t final tt ∆ vr T varianceWater flow 4 min 1 hour56 min537.410m s -⨯45℃31.8410⨯0.2455 3mB . Adding water intermittentlyMaintain the values of 0T ,d T ,r T ,v , we change the form of adding water, and get another graph.5001000150020002500300035003737.53838.53939.540TimeT e m p e r a t u r et1=283(turn on)t3=2107(turn on)t2=1828(turn off)Figure 8. Adding water intermittentlyT able 4.Strategy of adding water intermittently()1t on ()2t off 3()t on vr T varianceWater flow 5 min 30 min35min537.410m s -⨯45℃33.610⨯0.2248 3mConclusionDifferent methods of adding water can influence the variance, water flow and the times of switching. Therefore, we give heights to evaluate comprehensively the methods of adding hot water on the basis of different hobbies of people. Then we build the following model:()()()2213600210213i i n t t i F T t T dtF v t dtF n -=⎧=-⎪⎪⎪=⎨⎪⎪=⎪⎩⎰∑⎰ (13) ()112233min F w F w F w F =++ (14)12123min ..510mini i t s t t t +>⎧⎨≤-≤⎩Evaluation on StrategiesFor example: Given a set of parameters, we choose different values of v and d T , and gain the results as follows.Method 1- AHPStep 1:Establish hierarchy modelFigure 9. Establish hierarchy modelStep 2: Structure judgment matrix153113511133A ⎡⎤⎢⎥⎢⎥=⎢⎥⎢⎥⎢⎥⎣⎦Step 3: Assign weight1w 2w3w 0.650.220.13Method 2-TopsisStep1 :Create an evaluation matrix consisting of m alternatives and n criteria, with the intersection of each alternative and criteria given as ij x we therefore have a matrixStep2:The matrix ij m n x ⨯()is then normalised to form the matrix ij m n R r ⨯=(), using thenormalisation method21r ,1,2,,;1,2,ijij mij i x i n j m x====∑…………,Step3:Calculate the weighted normalised decision matrix()(),1,2,,ij j ij m n m nT t w r i m ⨯⨯===⋅⋅⋅where 1,1,2,,nj j jj w W Wj n ===⋅⋅⋅∑so that11njj w==∑, and j w is the original weight given to the indicator,1,2,,j v j n =⋅⋅⋅.Step 4: Determine the worst alternative ()w A and the best alternative ()b A()(){}{}()(){}{}max 1,2,,,min 1,2,,1,2,,n ,min 1,2,,,max 1,2,,1,2,,n ,w ij ij wjbijij bjA t i m j J t i m j J t j A t i m j J t i m j J tj -+-+==∈=∈====∈=∈==where, {}1,2,,J j n j +==⋅⋅⋅ associated with the criteria having a positive impact, and {}1,2,,J j n j -==⋅⋅⋅associated with the criteria having a negative impact. Step 5: Calculate the L2-distance between the target alternative i and the worst condition w A()21,1,2,,m niw ij wj j d tt i ==-=⋅⋅⋅∑and the distance between the alternative i and the best condition b A()21,1,2,,m nib ij bj j d t t i ==-=⋅⋅⋅∑where iw d and ib d are L2-norm distances from the target alternative i to the worst and best conditions, respectively .Step 6 :Calculate the similarity to the worst condition Step 7 : Rank the alternatives according to ()1,2,,iw s i m =⋅⋅⋅ Step 8 : Assign weight1w2w 3w 0.55 0.170.23ConclusionAHP gives height subjectively while TOPSIS gives height objectively. And the heights are decided by the hobbies of people. However, different people has different hobbies, we choose AHP to solve the following situations.Impact of parametersDifferent customers have their own hobbies. Some customers prefer enjoying in the bath, so the .2O is more important . While other customers prefer saving water, the .3O is more important. Therefore, we can solve the problem on basis of APH . 1. Customers who prefer enjoying: 20.83w =,30.17w =According to the actual situation, we give initial values as follows:13S =,11V =,2 1.4631S =,20.05V =,33p T =,110μ=Ensure other parameters unchanged, then change the values of these parameters including 1S ,1V ,2S ,2V ,d T ,1μ. So we can obtain the optimal strategies under different conditions in Table 4.T able 5.Optimal strategies under different conditions2.Customers who prefer saving: 20.17w =,30.83w =Just as the former, we give the initial values of these parameters including1S ,1V ,2S ,2V ,d T ,1μ, then change these values in turn with other parameters unchanged. So we can obtain the optimal strategies as well in these conditions.T able 6.Optimal strategies under different conditionsInfluence of bubbleUsing the bubble bath additives is equivalent to forming a barrier between the bath water and air, thereby slowing the falling velocity of water temperature. According to the reality, we give the values of some parameters and gain the results as follows:5001000150020002500300035003334353637383940TimeT e m p e r a t u r eWithour bubbleWith bubbleFigure 10. Influence of bubbleT able 7.Strategies (influence of bubble)Situation Dropping rate of temperature (the larger the number, the slower)Disparity to theinitial temperatureWater flow Times of switchingWithout bubble 802 1.4419 0.1477 4 With bubble 34499.85530.01122The Figure 10 and the Table 7 indicates that adding bubble can slow down the dropping rate of temperature effectively . It can decrease the disparity to the initial temperature and times of switching, as well as the water flow.Improved ModelIn reality , human ’s motivation in the bathtub is flexible, which means that the parameter 1μis a changeable measure. Therefore, the parameter can be regarded as a random variable, written as ()[]110,50t random μ=. Meanwhile, the surface of water will come into being ripples when people moves in the tub, which will influence the parameters like 1S and 2S . So, combining with reality , we give the range of values as follows:()[]()[]111222,1.1,1.1S t random S S S t random S S ⎧=⎪⎨=⎪⎩Combined with the above model, the improved model is given here:()[]()[]()[]11221121111222()()()/()10,50,1.1,1.1a H S dT H S T T c v T T c V V dt D t random S t random S S S t random S S μρρμ∞⎧⎡⎤=++-+--⎪⎢⎥⎣⎦⎨⎪===⎩(15)Given the values, we can get simulation diagram:050010001500200025003000350039.954040.0540.140.15TimeT e m p e r a t u r eFigure 11. Improved modelThe figure shows that the variance is small while the water flow is large, especially the variance do not equals to zero. This indicates that keeping the temperature of water is difficult though we regard .2O as the secondary objective.Sensitivity AnalysisSome parameters have a fixed value throughout our work. By varying their values, we can see their impacts.Impact of the shape of the tub0.70.80.91 1.1 1.2 1.3 1.433.23.43.63.84Superficial areaT h e t i m e sFigure 12a. Times of switching0.70.80.91 1.11.21.31.43890390039103920393039403950Superficial areaV a r i a n c eFigure 12b. V ariance of temperature0.70.80.91 1.1 1.2 1.3 1.40.190.1950.20.2050.21Superficial areaW a t e r f l o wFigure 12c. Water flowBy varying the value of some parameters, we can get the relationships between the shape of tub and the times of switching, variance of temperature, and water flow et. It is significant that the three indexes will change as the shape of the tub changes. Therefore the shape of the tub makes an obvious effect on the strategies. It is a sensitive parameter.Impact of the volume of the tub0.70.80.91 1.1 1.2 1.3 1.4 1.533.544.55VolumeT h e t i m e sFigure 13a. Times of switching。
美国大学生数学建模竞赛美赛--论文
Each team member must sign the statement below: (Failure to obtain signatures from each team member will result in disqualification of the entire team.)
2015 Mathematical Contest in Modeling (MCM/ICM) Control Sheet Please review this page before submitting your solution to ensure that all of the information is correct Do not make changes by hand to the information on this control sheet. If you need to change any of the information on this sheet, login via the Advisor Login link on the MCM web site, make the changes online, and print a new sheet. You may NOT photocopy this control sheet to give to a new team, nor may you assign any team a control number. Each team must have its own control number, obtained by registering via the MCM web site. Advisor Jinpeng Yu Name: Department: Control Engineering Institution: Qingdao University Address: 308 Ningxia Road,Shinan District,Qingdao,Shandong,China Qingdao, Shandong 266000 Phone: 18653250086 Fax: 053285953064 Email: zhanghaoran06@ Home Phone: 053285953064 The names of the team members will appear on your team's certificate exactly as they appear on this page, including all capitalization and punctuation, if any. Gender data is optional and will be used for statistical purposes only; it will not appear on the certificate. Team Member Haoran Zhang Yu Ma Guiying Dong Gender M M F Your team's control number is: 40906 (Place this control number on all pages of your solution paper and on any support material.) Problem Chosen: B
美赛数学建模比赛论文实用模板

The Keep-Right-Except-To-Pass RuleSummaryAs for the first question, it provides a traffic rule of keep right except to pass, requiring us to verify its effectiveness. Firstly, we define one kind of traffic rule different from the rule of the keep right in order to solve the problem clearly; then, we build a Cellular automaton model and a Nasch model by collecting massive data; next, we make full use of the numerical simulation according to several influence factors of traffic flow; At last, by lots of analysis of graph we obtain, we indicate a conclusion as follow: when vehicle density is lower than 0.15, the rule of lane speed control is more effective in terms of the factor of safe in the light traffic; when vehicle density is greater than 0.15, so the rule of keep right except passing is more effective In the heavy traffic.As for the second question, it requires us to testify that whether the conclusion we obtain in the first question is the same apply to the keep left rule. First of all, we build a stochastic multi-lane traffic model; from the view of the vehicle flow stress, we propose that the probability of moving to the right is 0.7and to the left otherwise by making full use of the Bernoulli process from the view of the ping-pong effect, the conclusion is that the choice of the changing lane is random. On the whole, the fundamental reason is the formation of the driving habit, so the conclusion is effective under the rule of keep left.As for the third question, it requires us to demonstrate the effectiveness of the result advised in the first question under the intelligent vehicle control system. Firstly, taking the speed limits into consideration, we build a microscopic traffic simulator model for traffic simulation purposes. Then, we implement a METANET model for prediction state with the use of the MPC traffic controller. Afterwards, we certify that the dynamic speed control measure can improve the traffic flow .Lastly neglecting the safe factor, combining the rule of keep right with the rule of dynamical speed control is the best solution to accelerate the traffic flow overall.Key words:Cellular automaton model Bernoulli process Microscopic traffic simulator model The MPC traffic controlContentContent (2)1. Introduction (3)2. Analysis of the problem (3)3. Assumption (3)4. Symbol Definition (3)5. Models (4)5.1 Building of the Cellular automaton model (4)5.1.1 Verify the effectiveness of the keep right except to pass rule (4)5.1.2 Numerical simulation results and discussion (5)5.1.3 Conclusion (8)5.2 The solving of second question (8)5.2.1 The building of the stochastic multi-lane traffic model (9)5.2.2 Conclusion (9)5.3 Taking the an intelligent vehicle system into a account (9)5.3.1 Introduction of the Intelligent Vehicle Highway Systems (9)5.3.2 Control problem (9)5.3.3 Results and analysis (9)5.3.4 The comprehensive analysis of the result (10)6. Improvement of the model (11)6.1 strength and weakness (11)6.1.1 Strength (11)6.1.2 Weakness (11)6.2 Improvement of the model (11)7. Reference (13)1. IntroductionAs is known to all, it’s essential for us to drive automobiles, thus the driving rules is crucial important. In many countries like USA, China, drivers obey the rules which called “The Keep-Right-Except-To-Pass (that is, when driving automobiles, the rule requires drivers to drive in the right-most unless theyare passing another vehicle)”.2. Analysis of the problemFor the first question, we decide to use the Cellular automaton to build models,then analyze the performance of this rule in light and heavy traffic. Firstly,we mainly use the vehicle density to distinguish the light and heavy traffic; secondly, we consider the traffic flow and safe as the represent variable which denotes the light or heavy traffic; thirdly, we build and analyze a Cellular automaton model; finally, we judge the rule through two different driving rules,and then draw conclusions.3. AssumptionIn order to streamline our model we have made several key assumptions●The highway of double row three lanes that we study can representmulti-lane freeways.●The data that we refer to has certain representativeness and descriptive●Operation condition of the highway not be influenced by blizzard oraccidental factors●Ignore the driver's own abnormal factors, such as drunk driving andfatigue driving●The operation form of highway intelligent system that our analysis canreflect intelligent system●In the intelligent vehicle system, the result of the sampling data hashigh accuracy.4. Symbol Definitioni The number of vehiclest The time5. ModelsBy analyzing the problem, we decided to propose a solution with building a cellular automaton model.5.1 Building of the Cellular automaton modelThanks to its simple rules and convenience for computer simulation, cellular automaton model has been widely used in the study of traffic flow in recent years. Let )(t x i be the position of vehicle i at time t , )(t v i be the speed of vehicle i at time t , p be the random slowing down probability, and R be the proportion of trucks and buses, the distance between vehicle i and the front vehicle at time t is:1)()(1--=-t x t x gap i i i , if the front vehicle is a small vehicle.3)()(1--=-t x t x gap i i i , if the front vehicle is a truck or bus.5.1.1 Verify the effectiveness of the keep right except to pass ruleIn addition, according to the keep right except to pass rule, we define a new rule called: Control rules based on lane speed. The concrete explanation of the new rule as follow:There is no special passing lane under this rule. The speed of the first lane (the far left lane) is 120–100km/h (including 100 km/h);the speed of the second lane (the middle lane) is 100–80km8/h (including80km/h);the speed of the third lane (the far right lane) is below 80km/ h. The speeds of lanes decrease from left to right.● Lane changing rules based lane speed controlIf vehicle on the high-speed lane meets control v v <, ),1)(min()(max v t v t gap i f i +≥, safe b i gap t gap ≥)(, the vehicle will turn into the adjacent right lane, and the speed of the vehicle after lane changing remains unchanged, where control v is the minimum speed of the corresponding lane.● The application of the Nasch model evolutionLet d P be the lane changing probability (taking into account the actual situation that some drivers like driving in a certain lane, and will not takethe initiative to change lanes), )(t gap f i indicates the distance between the vehicle and the nearest front vehicle, )(t gap b i indicates the distance between the vehicle and the nearest following vehicle. In this article, we assume that the minimum safe distance gap safe of lane changing equals to the maximum speed of the following vehicle in the adjacent lanes.Lane changing rules based on keeping right except to passIn general, traffic flow going through a passing zone (Fig. 5.1.1) involves three processes: the diverging process (one traffic flow diverging into two flows), interacting process (interacting between the two flows), and merging process (the two flows merging into one) [4].Fig.5.1.1 Control plan of overtaking process(1) If vehicle on the first lane (passing lane) meets ),1)(min()(max v t v t gap i f i +≥ and safe b i gap t gap ≥)(, the vehicle will turn into the second lane, the speed of the vehicle after lane changing remains unchanged.5.1.2 Numerical simulation results and discussionIn order to facilitate the subsequent discussions, we define the space occupation rate as L N N p truck CAR ⨯⨯+=3/)3(, where CAR N indicates the number ofsmall vehicles on the driveway,truck N indicates the number of trucks and buses on the driveway, and L indicates the total length of the road. The vehicle flow volume Q is the number of vehicles passing a fixed point per unit time,T N Q T /=, where T N is the number of vehicles observed in time duration T .The average speed ∑∑⨯=T it i a v T N V 11)/1(, t i v is the speed of vehicle i at time t . Take overtaking ratio f p as the evaluation indicator of the safety of traffic flow, which is the ratio of the total number of overtaking and the number of vehicles observed. After 20,000 evolution steps, and averaging the last 2000 steps based on time, we have obtained the following experimental results. In order to eliminate the effect of randomicity, we take the systemic average of 20 samples [5].Overtaking ratio of different control rule conditionsBecause different control conditions of road will produce different overtaking ratio, so we first observe relationships among vehicle density, proportion of large vehicles and overtaking ratio under different control conditions.(a) Based on passing lane control (b) Based on speed control Fig.5.1.3Fig.5.1.3 Relationships among vehicle density, proportion of large vehicles and overtaking ratio under different control conditions.It can be seen from Fig. 5.1.3:(1) when the vehicle density is less than 0.05, the overtaking ratio will continue to rise with the increase of vehicle density; when the vehicle density is larger than 0.05, the overtaking ratio will decrease with the increase of vehicle density; when density is greater than 0.12, due to the crowding, it willbecome difficult to overtake, so the overtaking ratio is almost 0.(2) when the proportion of large vehicles is less than 0.5, the overtaking ratio will rise with the increase of large vehicles; when the proportion of large vehicles is about 0.5, the overtaking ratio will reach its peak value; when the proportion of large vehicles is larger than 0.5, the overtaking ratio will decrease with the increase of large vehicles, especially under lane-based control condition s the decline is very clear.● Concrete impact of under different control rules on overtaking ratioFig.5.1.4Fig.5.1.4 Relationships among vehicle density, proportion of large vehicles and overtaking ratio under different control conditions. (Figures in left-hand indicate the passing lane control, figures in right-hand indicate the speed control. 1f P is the overtaking ratio of small vehicles over large vehicles, 2f P is the overtaking ratio of small vehicles over small vehicles, 3f P is the overtaking ratio of large vehicles over small vehicles, 4f P is the overtaking ratio of large vehicles over large vehicles.). It can be seen from Fig. 5.1.4:(1) The overtaking ratio of small vehicles over large vehicles under passing lane control is much higher than that under speed control condition, which is because, under passing lane control condition, high-speed small vehicles have to surpass low-speed large vehicles by the passing lane, while under speed control condition, small vehicles are designed to travel on the high-speed lane, there is no low- speed vehicle in front, thus there is no need to overtake.● Impact of different control rules on vehicle speedFig. 5.1.5 Relationships among vehicle density, proportion of large vehicles and average speed under different control conditions. (Figures in left-hand indicates passing lane control, figures in right-hand indicates speed control.a X is the average speed of all the vehicles, 1a X is the average speed of all the small vehicles, 2a X is the average speed of all the buses and trucks.).It can be seen from Fig. 5.1.5:(1) The average speed will reduce with the increase of vehicle density and proportion of large vehicles.(2) When vehicle density is less than 0.15,a X ,1a X and 2a X are almost the same under both control conditions.Effect of different control conditions on traffic flowFig.5.1.6Fig. 5.1.6 Relationships among vehicle density, proportion of large vehicles and traffic flow under different control conditions. (Figure a1 indicates passing lane control, figure a2 indicates speed control, and figure b indicates the traffic flow difference between the two conditions.It can be seen from Fig. 5.1.6:(1) When vehicle density is lower than 0.15 and the proportion of large vehicles is from 0.4 to 1, the traffic flow of the two control conditions are basically the same.(2) Except that, the traffic flow under passing lane control condition is slightly larger than that of speed control condition.5.1.3 ConclusionIn this paper, we have established three-lane model of different control conditions, studied the overtaking ratio, speed and traffic flow under different control conditions, vehicle density and proportion of large vehicles.5.2 The solving of second question5.2.1 The building of the stochastic multi-lane traffic model5.2.2 ConclusionOn one hand, from the analysis of the model, in the case the stress is positive, we also consider the jam situation while making the decision. More specifically, if a driver is in a jam situation, applying ))(,2(x P B R results with a tendency of moving to the right lane for this driver. However in reality, drivers tend to find an emptier lane in a jam situation. For this reason, we apply a Bernoulli process )7.0,2(B where the probability of moving to the right is 0.7and to the left otherwise, and the conclusion is under the rule of keep left except to pass, So, the fundamental reason is the formation of the driving habit.5.3 Taking the an intelligent vehicle system into a accountFor the third question, if vehicle transportation on the same roadway was fully under the control of an intelligent system, we make some improvements for the solution proposed by us to perfect the performance of the freeway by lots of analysis.5.3.1 Introduction of the Intelligent Vehicle Highway SystemsWe will use the microscopic traffic simulator model for traffic simulation purposes. The MPC traffic controller that is implemented in the Matlab needs a traffic model to predict the states when the speed limits are applied in Fig.5.3.1. We implement a METANET model for prediction purpose[14].5.3.2 Control problemAs a constraint, the dynamic speed limits are given a maximum and minimum allowed value. The upper bound for the speed limits is 120 km/h, and the lower bound value is 40 km/h. For the calculation of the optimal control values, all speed limits are constrained to this range. When the optimal values are found, they are rounded to a multiplicity of 10 km/h, since this is more clear for human drivers, and also technically feasible without large investments.5.3.3 Results and analysisWhen the density is high, it is more difficult to control the traffic, since the mean speed might already be below the control speed. Therefore, simulations are done using densities at which the shock wave can dissolve without using control, and at densities where the shock wave remains. For each scenario, five simulations for three different cases are done, each with a duration of one hour. The results of the simulations are reported in Table 5.1, 5.2, 5.3. Table.5.1 measured results for the unenforced speed limit scenariodem q case#1 #2 #3 #4 #5 TTS:mean(std ) TPN 4700no shock 494.7452.1435.9414.8428.3445.21(6.9%) 5:4wave 3 5 8 8 0 14700nocontrolled520.42517.48536.13475.98539.58517.92(4.9%)6:364700 controlled 513.45488.43521.35479.75-486.5500.75(4.0%)6:244700 no shockwave493.9472.6492.78521.1489.43493.96(3.5%)6:034700 uncontrolled635.1584.92643.72571.85588.63604.84(5.3%)7:244700 controlled 575.3654.12589.77572.15586.46597.84(6.4%)7:19●Enforced speed limits●Intelligent speed adaptationFor the ISA scenario, the desired free-flow speed is about 100% of the speed limit. The desired free-flow speed is modeled as a Gaussian distribution, with a mean value of 100% of the speed limit, and a standard deviation of 5% of the speed limit. Based on this percentage, the influence of the dynamic speed limits is expected to be good[19].5.3.4 The comprehensive analysis of the resultFrom the analysis above, we indicate that adopting the intelligent speed control system can effectively decrease the travel times under the control of an intelligent system, in other words, the measures of dynamic speed control can improve the traffic flow.Evidently, under the intelligent speed control system, the effect of the dynamic speed control measure is better than that under the lane speed control mentioned in the first problem. Because of the application of the intelligent speed control system, it can provide the optimal speed limit in time. In addition, it can guarantee the safe condition with all kinds of detection device and the sensor under the intelligent speed system.On the whole, taking all the analysis from the first problem to the end into a account, when it is in light traffic, we can neglect the factor of safe with the help of the intelligent speed control system.Thus, under the state of the light traffic, we propose a new conclusion different from that in the first problem: the rule of keep right except to pass is more effective than that of lane speed control.And when it is in the heavy traffic, for sparing no effort to improve the operation efficiency of the freeway, we combine the dynamical speed control measure with the rule of keep right except to pass, drawing a conclusion that the application of the dynamical speed control can improve the performance ofthe freeway.What we should highlight is that we can make some different speed limit as for different section of road or different size of vehicle with the application of the Intelligent Vehicle Highway Systems.In fact, that how the freeway traffic operate is extremely complex, thereby, with the application of the Intelligent Vehicle Highway Systems, by adjusting our solution originally, we make it still effective to freeway traffic.6. Improvement of the model6.1 strength and weakness6.1.1 Strength●it is easy for computer simulating and can be modified flexibly to consideractual traffic conditions ,moreover a large number of images make the model more visual.●The result is effectively achieved all of the goals we set initially, meantimethe conclusion is more persuasive because of we used the Bernoulli equation.●We can get more accurate result as we apply Matlab.6.1.2 Weakness●The relationship between traffic flow and safety is not comprehensivelyanalysis.●Due to there are many traffic factors, we are only studied some of the factors,thus our model need further improved.6.2 Improvement of the modelWhile we compare models under two kinds of traffic rules, thereby we come to the efficiency of driving on the right to improve traffic flow in some circumstance. Due to the rules of comparing is too less, the conclusion is inadequate. In order to improve the accuracy, We further put forward a kinds of traffic rules: speed limit on different type of cars.The possibility of happening traffic accident for some vehicles is larger, and it also brings hidden safe troubles. So we need to consider separately about different or specific vehicle types from the angle of the speed limiting in order to reduce the occurrence of traffic accidents, the highway speed limit signs is in Fig.6.1.Fig .6.1Advantages of the improving model are that it is useful to improve the running condition safety of specific type of vehicle while considering the difference of different types of vehicles. However, we found that the rules may be reduce the road traffic flow through the analysis. In the implementation it should be at the 85V speed of each model as the main reference basis. In recent years, the 85V of some researchers for the typical countries from Table 6.1[ 21]: Table 6.1 Operating speed prediction modeAuthorCountry Model Ottesen andKrammes2000America LC DC L DC V C ⨯---=01.0012.057.144.10285Andueza2000Venezuel a ].[308.9486.7)/894()/2795(25.9885curve horizontal L DC Ra R V T ++--= ].[tan 819.27)/3032(69.10085gent L R V T +-= Jessen2001 America ][00239.0614.0279.080.86185LSD ADT G V V P --+=][00212.0432.010.7285NLSD ADT V V P -+=Donnell2001 America 22)2(8500724.040.10140.04.78T L G R V --+=22)3(85008369.048.10176.01.75T L G R V --+= 22)4(8500810.069.10176.05.74T L G R V --+=22)5(8500934.008.21.83T L G V --=BucchiA.BiasuzziK.And SimoneA.2005Italy DC V 124.0164.6685-= DC E V 4.046.3366.5585--= 2855.035.1119.0745.65DC E DC V ---= Fitzpatrick America KV 98.17507.11185-= Meanwhile, there are other vehicles driving rules such as speed limit in adverseweather conditions. This rule can improve the safety factor of the vehicle to some extent. At the same time, it limits the speed at the different levels.7. Reference[1] M. Rickert, K. Nagel, M. Schreckenberg, A. Latour, Two lane traffi csimulations using cellular automata, Physica A 231 (1996) 534–550.[20] J.T. Fokkema, Lakshmi Dhevi, Tamil Nadu Traffi c Management and Control inIntelligent Vehicle Highway Systems,18(2009).[21] Yang Li, New Variable Speed Control Approach for Freeway. (2011) 1-66。
美赛论文模板(超实用)
TitileSummaryDuring cell division, mitotic spindles are assembled by microtubule-based motor proteins1, 2. The bipolar organization of spindles is essential for proper segregation of chromosomes, and requires plus-end-directed homotetrameric motor proteins of the widely conserved kinesin-5 (BimC) family3. Hypotheses for bipolar spindle formation include the 'push−pull mitotic muscle' model, in which kinesin-5 and opposing motor proteins act between overlapping microtubules2, 4, 5. However, the precise roles of kinesin-5 during this process are unknown. Here we show that the vertebrate kinesin-5 Eg5 drives the sliding of microtubules depending on their relative orientation. We found in controlled in vitro assays that Eg5 has the remarkable capability of simultaneously moving at 20 nm s-1 towards the plus-ends of each of the two microtubules it crosslinks. For anti-parallel microtubules, this results in relative sliding at 40 nm s-1, comparable to spindle pole separation rates in vivo6. Furthermore, we found that Eg5 can tether microtubule plus-ends, suggesting an additional microtubule-binding mode for Eg5. Our results demonstrate how members of the kinesin-5 family are likely to function in mitosis, pushing apart interpolar microtubules as well as recruiting microtubules into bundles that are subsequently polarized by relative sliding. We anticipate our assay to be a starting point for more sophisticated in vitro models of mitotic spindles. For example, the individual and combined action of multiple mitotic motors could be tested, including minus-end-directed motors opposing Eg5 motility. Furthermore, Eg5 inhibition is a major target of anti-cancer drug development, and a well-defined and quantitative assay for motor function will be relevant for such developmentsContentTitile (1)Summary (1)1Introduction (1)1.1Restatement of the Problem (1)1.2Background (1)1.1.1Common Solving Technique (1)1.1.2Previous Works (1)1.3Example (1)2Analysis of the Problem (1)2.1Outline of the Approach (1)2.2Basic Assumptions (2)2.3Definitions and Key Terms (2)3Calculating and Simplifying the Model (2)4The Model Results (3)5Validating the Model (3)6Strengths and Weaknesses (3)6.1Strengths (3)6.2Weaknesses (3)7Food for Thought (3)8Conclusion (3)References (4)Appendices (4)Appendix A Source Code (4)Appendix B (4)1Introduction1.1Restatement of the Problem …1.2Background…1.1.1Common Solving Technique…1.1.2Previous Works…1.3Example…2Analysis of the Problem …2.1Outline of the Approach…2.2Basic Assumptions●●●●●2.3Definitions and Key Terms●●●●Table 1.…Symbol Meaning Unit3Calculating and Simplifying the Model …4The Model Results……5Validating the Model…6Strengths and Weaknesses6.1S trengths●●●●6.2W eaknesses●●●●7Food for Thought…8Conclusion….References…AppendicesAppendix A Source CodeHere are the simulation programmes we used in our model as follow. Input matlab source:……….Appendix B…….Input C++ source:…………..…………..。
美赛数学建模比赛论文资料材料模板
The Keep-Right-Except-To-Pass RuleSummaryAs for the first question, it provides a traffic rule of keep right except to pass, requiring us to verify its effectiveness. Firstly, we define one kind of traffic rule different from the rule of the keep right in order to solve the problem clearly; then, we build a Cellular automaton model and a Nasch model by collecting massive data; next, we make full use of the numerical simulation according to several influence factors of traffic flow; At last, by lots of analysis of graph we obtain, we indicate a conclusion as follow: when vehicle density is lower than 0.15, the rule of lane speed control is more effective in terms of the factor of safe in the light traffic; when vehicle density is greater than 0.15, so the rule of keep right except passing is more effective In the heavy traffic.As for the second question, it requires us to testify that whether the conclusion we obtain in the first question is the same apply to the keep left rule. First of all, we build a stochastic multi-lane traffic model; from the view of the vehicle flow stress, we propose that the probability of moving to the right is 0.7and to the left otherwise by making full use of the Bernoulli process from the view of the ping-pong effect, the conclusion is that the choice of the changing lane is random. On the whole, the fundamental reason is the formation of the driving habit, so the conclusion is effective under the rule of keep left.As for the third question, it requires us to demonstrate the effectiveness of the result advised in the first question under the intelligent vehicle control system. Firstly, taking the speed limits into consideration, we build a microscopic traffic simulator model for traffic simulation purposes. Then, we implement a METANET model for prediction state with the use of the MPC traffic controller. Afterwards, we certify that the dynamic speed control measure can improve the traffic flow .Lastly neglecting the safe factor, combining the rule of keep right with the rule of dynamical speed control is the best solution to accelerate the traffic flow overall.Key words:Cellular automaton model Bernoulli process Microscopic traffic simulator model The MPC traffic controlContentContent (2)1. Introduction (3)2. Analysis of the problem (3)3. Assumption (3)4. Symbol Definition (3)5. Models (3)5.1 Building of the Cellular automaton model (3)5.1.1 Verify the effectiveness of the keep right except to pass rule (4)5.1.2 Numerical simulation results and discussion (5)5.1.3 Conclusion (8)5.2 The solving of second question (8)5.2.1 The building of the stochastic multi-lane traffic model (8)5.2.2 Conclusion (8)5.3 Taking the an intelligent vehicle system into a account (8)5.3.1 Introduction of the Intelligent Vehicle Highway Systems (9)5.3.2 Control problem (9)5.3.3 Results and analysis (9)5.3.4 The comprehensive analysis of the result (9)6. Improvement of the model (10)6.1 strength and weakness (10)6.1.1 Strength (10)6.1.2 Weakness (10)6.2 Improvement of the model (10)7. Reference (12)1. IntroductionAs is known to all, it ’s essential for us to drive automobiles, thus the driving rules is crucial important. In many countries like USA, China, drivers obey the rules which called “The Keep-Right-Except-To-Pass (that is, when driving automobiles, the rule requires drivers to drive in the right-most unless they are passing another vehicle)”.2. Analysis of the problemFor the first question, we decide to use the Cellular automaton to build models, then analyze the performance of this rule in light and heavy traffic. Firstly, we mainly use the vehicle density to distinguish the light and heavy traffic; secondly, we consider the traffic flow and safe as the represent variable which denotes the light or heavy traffic; thirdly, we build and analyze a Cellular automaton model; finally, we judge the rule through two different driving rules, and then draw conclusions.3. AssumptionIn order to streamline our model we have made several key assumptions● The highway of double row three lanes that we study can representmulti-lane freeways.● The data that we refer to has certain representativeness and descriptive● Operation condition of the highway not be influenced by blizzard or accidental factors ● Ignore the driver's own abnormal factors, such as drunk driving and fatigue driving ● The operation form of highway intelligent system that our analysis can reflectintelligent system● In the intelligent vehicle system, the result of the sampling data has high accuracy.4. Symbol Definitioni The number of vehiclest The time5. ModelsBy analyzing the problem, we decided to propose a solution with building a cellular automaton model.5.1 Building of the Cellular automaton modelThanks to its simple rules and convenience for computer simulation, cellular automaton model has been widely used in the study of traffic flow in recent years.Let )(t x i be the position of vehicle i at time t , )(t v i be the speed of vehicle i at time t ,p be the random slowing down probability, and R be the proportion of trucks and buses, the distance between vehicle i and the front vehicle at time t is:1)()(1--=-t x t x gap i i i , if the front vehicle is a small vehicle.3)()(1--=-t x t x gap i i i , if the front vehicle is a truck or bus.5.1.1 Verify the effectiveness of the keep right except to pass ruleIn addition, according to the keep right except to pass rule, we define a new rule called: Control rules based on lane speed. The concrete explanation of the new rule as follow:There is no special passing lane under this rule. The speed of the first lane (the far left lane) is 120–100km/h (including 100 km/h);the speed of the second lane (the middle lane) is 100–80km8/h (including80km/h);the speed of the third lane (the far right lane) is below 80km/ h. The speeds of lanes decrease from left to right.● Lane changing rules based lane speed controlIf vehicle on the high-speed lane meets control v v <, ),1)(min()(max v t v t gap i f i +≥, safe b i gap t gap ≥)(, the vehicle will turn into the adjacent right lane, and the speed of the vehicle after lane changing remains unchanged, where control v is the minimum speed of the corresponding lane.● The application of the Nasch model evolutionLet d P be the lane changing probability (taking into account the actual situation that some drivers like driving in a certain lane, and will not take the initiative to change lanes), )(t gap f i indicates the distance between the vehicle and the nearest front vehicle, )(t gap b i indicates the distance between the vehicle and the nearest following vehicle. In this article, we assume that the minimum safe distance gap safe of lane changing equals to the maximum speed of the following vehicle in the adjacent lanes.● Lane changing rules based on keeping right except to passIn general, traffic flow going through a passing zone (Fig. 5.1.1) involves three processes: the diverging process (one traffic flow diverging into two flows), interacting process (interacting between the two flows), and merging process (the two flows merging into one)[4].Fig.5.1.1 Control plan of overtaking process(1) If vehicle on the first lane (passing lane) meets ),1)(min()(max v t v t gap i f i +≥ and safe b i gap t gap ≥)(, the vehicle will turn into the second lane, the speed of the vehicle after lane changing remains unchanged.5.1.2 Numerical simulation results and discussionIn order to facilitate the subsequent discussions, we define the space occupation rate as L N N p truck CAR ⨯⨯+=3/)3(, where CAR N indicates the number of small vehicles on the driveway,truck N indicates the number of trucks and buses on the driveway, and L indicates the total length of the road. The vehicle flow volume Q is the number of vehicles passing a fixed point per unit time,T N Q T /=, where T N is the number of vehicles observed in time duration T .The average speed ∑∑⨯=T it i a v T N V 11)/1(, t i v is the speed of vehicle i at time t . Take overtaking ratio f p as the evaluation indicator of the safety of traffic flow, which is the ratio of the total number of overtaking and the number of vehicles observed. After 20,000 evolution steps, and averaging the last 2000 steps based on time, we have obtained the following experimental results. In order to eliminate the effect of randomicity, we take the systemic average of 20 samples [5].Overtaking ratio of different control rule conditionsBecause different control conditions of road will produce different overtaking ratio, so we first observe relationships among vehicle density, proportion of large vehicles and overtaking ratio under different control conditions.(a) Based on passing lane control (b) Based on speed controlFig.5.1.3Fig.5.1.3Relationships among vehicle density, proportion of large vehicles and overtaking ratio under different control conditions.It can be seen from Fig. 5.1.3:(1) when the vehicle density is less than 0.05, the overtaking ratio will continue to rise with the increase of vehicle density; when the vehicle density is larger than 0.05, the overtaking ratio will decrease with the increase of vehicle density; when density is greater than 0.12, due to the crowding, it will become difficult to overtake, so the overtaking ratio is almost 0.(2) when the proportion of large vehicles is less than 0.5, the overtaking ratio will rise with the increase of large vehicles; when the proportion of large vehicles is about 0.5, the overtaking ratio will reach its peak value; when the proportion of large vehicles is larger than 0.5, the overtaking ratio will decrease with the increase of large vehicles, especially under lane-based control condition s the decline is very clear.Concrete impact of under different control rules on overtaking ratioFig.5.1.4Fig.5.1.4 Relationships among vehicle density, proportion of large vehicles and overtaking ratio under different control conditions. (Figures in left-hand indicate the passing lane control, figures in right-hand indicate thespeed control. 1f P is the overtaking ratio of small vehicles over large vehicles, 2f P is the overtaking ratio ofsmall vehicles over small vehicles, 3f P is the overtaking ratio of large vehicles over small vehicles, 4f P is the overtaking ratio of large vehicles over large vehicles.).It can be seen from Fig. 5.1.4:(1) The overtaking ratio of small vehicles over large vehicles under passing lane control is much higher than that under speed control condition, which is because, under passing lane control condition, high-speed small vehicles have to surpass low-speed large vehicles by the passing lane, while under speed control condition, small vehicles are designed to travel on the high-speed lane, there is no low- speed vehicle in front, thus there is no need to overtake. ● Impact of different control rules on vehicle speedFig. 5.1.5 Relationships among vehicle density, proportion of large vehicles and average speed under different control conditions. (Figures in left-hand indicates passing lane control, figures in right-hand indicates speed control. a X is the average speed of all the vehicles, 1a X is the average speed of all the small vehicles, 2a X is the average speed of all the buses and trucks.).It can be seen from Fig. 5.1.5:(1) The average speed will reduce with the increase of vehicle density and proportion of large vehicles.(2) When vehicle density is less than 0.15,a X ,1a X and 2a X are almost the same under both control conditions.● Effect of different control conditions on traffic flowFig.5.1.6Fig. 5.1.6Relationships among vehicle density, proportion of large vehicles and traffic flow under different control conditions. (Figure a1 indicates passing lane control, figure a2 indicates speed control, and figure b indicates the traffic flow difference between the two conditions.It can be seen from Fig. 5.1.6:(1) When vehicle density is lower than 0.15 and the proportion of large vehicles is from 0.4 to 1, the traffic flow of the two control conditions are basically the same.(2) Except that, the traffic flow under passing lane control condition is slightly larger than that of speed control condition.5.1.3 ConclusionIn this paper, we have established three-lane model of different control conditions, studied the overtaking ratio, speed and traffic flow under different control conditions, vehicle density and proportion of large vehicles.5.2 The solving of second question5.2.1 The building of the stochastic multi-lane traffic model5.2.2 ConclusionOn one hand, from the analysis of the model, in the case the stress is positive, we also consider the jam situation while making the decision. More specifically, if a driver is in a jam BP(situation, applying ))results with a tendency of moving to the right lane for this,2(xRdriver. However in reality, drivers tend to find an emptier lane in a jam situation. For this reason, we apply a Bernoulli process )7.0,2(B where the probability of moving to the right is 0.7and to the left otherwise, and the conclusion is under the rule of keep left except to pass, So, the fundamental reason is the formation of the driving habit.5.3 Taking the an intelligent vehicle system into a accountFor the third question, if vehicle transportation on the same roadway was fully under the control of an intelligent system, we make some improvements for the solution proposed by usto perfect the performance of the freeway by lots of analysis.5.3.1 Introduction of the Intelligent Vehicle Highway SystemsWe will use the microscopic traffic simulator model for traffic simulation purposes. The MPC traffic controller that is implemented in the Matlab needs a traffic model to predict the states when the speed limits are applied in Fig.5.3.1. We implement a METANET model for prediction purpose[14].5.3.2 Control problemAs a constraint, the dynamic speed limits are given a maximum and minimum allowed value. The upper bound for the speed limits is 120 km/h, and the lower bound value is 40 km/h. For the calculation of the optimal control values, all speed limits are constrained to this range. When the optimal values are found, they are rounded to a multiplicity of 10 km/h, since this is more clear for human drivers, and also technically feasible without large investments.5.3.3 Results and analysisWhen the density is high, it is more difficult to control the traffic, since the mean speed might already be below the control speed. Therefore, simulations are done using densities at which the shock wave can dissolve without using control, and at densities where the shock wave remains. For each scenario, five simulations for three different cases are done, each with a duration of one hour. The results of the simulations are reported in Table5.1, 5.2, 5.3.●Enforced speed limits●Intelligent speed adaptationFor the ISA scenario, the desired free-flow speed is about 100% of the speed limit. The desired free-flow speed is modeled as a Gaussian distribution, with a mean value of 100% of the speed limit, and a standard deviation of 5% of the speed limit. Based on this percentage, the influence of the dynamic speed limits is expected to be good[19].5.3.4 The comprehensive analysis of the resultFrom the analysis above, we indicate that adopting the intelligent speed control system can effectively decrease the travel times under the control of an intelligent system, in other words, the measures of dynamic speed control can improve the traffic flow.Evidently, under the intelligent speed control system, the effect of the dynamic speed control measure is better than that under the lane speed control mentioned in the first problem. Becauseof the application of the intelligent speed control system, it can provide the optimal speed limit in time. In addition, it can guarantee the safe condition with all kinds of detection device and the sensor under the intelligent speed system.On the whole, taking all the analysis from the first problem to the end into a account, when it is in light traffic, we can neglect the factor of safe with the help of the intelligent speed control system.Thus, under the state of the light traffic, we propose a new conclusion different from that in the first problem: the rule of keep right except to pass is more effective than that of lane speed control.And when it is in the heavy traffic, for sparing no effort to improve the operation efficiency of the freeway, we combine the dynamical speed control measure with the rule of keep right except to pass, drawing a conclusion that the application of the dynamical speed control can improve the performance of the freeway.What we should highlight is that we can make some different speed limit as for different section of road or different size of vehicle with the application of the Intelligent Vehicle Highway Systems.In fact, that how the freeway traffic operate is extremely complex, thereby, with the application of the Intelligent Vehicle Highway Systems, by adjusting our solution originally, we make it still effective to freeway traffic.6. Improvement of the model6.1 strength and weakness6.1.1 Strength●it is easy for computer simulating and can be modified flexibly to consider actual trafficconditions ,moreover a large number of images make the model more visual.●The result is effectively achieved all of the goals we set initially, meantime the conclusion ismore persuasive because of we used the Bernoulli equation.●We can get more accurate result as we apply Matlab.6.1.2 Weakness●The relationship between traffic flow and safety is not comprehensively analysis.●Due to there are many traffic factors, we are only studied some of the factors, thus ourmodel need further improved.6.2 Improvement of the modelWhile we compare models under two kinds of traffic rules, thereby we come to the efficiency of driving on the right to improve traffic flow in some circumstance. Due to the rules of comparing is too less, the conclusion is inadequate. In order to improve the accuracy, Wefurther put forward a kinds of traffic rules: speed limit on different type of cars.The possibility of happening traffic accident for some vehicles is larger, and it also brings hidden safe troubles. So we need to consider separately about different or specific vehicle types from the angle of the speed limiting in order to reduce the occurrence of traffic accidents, the highway speed limit signs is in Fig.6.1.Fig.6.1Advantages of the improving model are that it is useful to improve the running condition safety of specific type of vehicle while considering the difference of different types of vehicles. However, we found that the rules may be reduce the road traffic flow through the analysis. In the implementation it should be at the85V speed of each model as the main reference basis. Inrecent years, the85V of some researchers for the typical countries from Table 6.1[ 21]:Author Country ModelOttesen andKrammes2000America LCDCLDCVC⨯---=01.0012.057.144.10285Andueza2000 Venezuela].[308.9486.7)/894()/2795(25.9885curvehorizontalLDCRaRVT++--=].[tan819.27)/3032(69.10085gentLRVT+-=Jessen2001 America][00239.0614.0279.080.86185LSDADTGVVP--+=][00212.0432.010.7285NLSDADTVVP-+=Donnell2001 America22)2(8500724.040.10140.04.78TLGRV--+=22)3(85008369.048.10176.01.75TLGRV--+=22)4(8500810.069.10176.05.74TLGRV--+=22)5(8500934.008.21.83TLGV--=BucchiA.BiasuzziK.And SimoneA.2005 ItalyDCV124.0164.6685-=DCEV4.046.3366.5585--=Meanwhile, there are other vehicles driving rules such as speed limit in adverse weather conditions. This rule can improve the safety factor of the vehicle to some extent. At the same time, it limits the speed at the different levels.7. Reference[1] M. Rickert, K. Nagel, M. Schreckenberg, A. Latour, Two lane traffic simulations usingcellular automata, Physica A 231 (1996) 534–550.[20] J.T. Fokkema, Lakshmi Dhevi, Tamil Nadu Traffic Management and Control inIntelligent Vehicle Highway Systems,18(2009).[21] Yang Li, New Variable Speed Control Approach for Freeway. (2011) 1-66。
美赛论文模板
T eam Control NumberFor office use only0000For office use onlyT1 F1T2 F2T3 Problem Chosen F3T4 A F42014 Mathematical Contest in Modeling (MCM) Summary Sheet(Attach a copy of this page to each copy of your solution paper.)Repeaters Coordination And DistributionFebruary 6,2015AbstractIn this paper, it aims to computing problem on Relay Strategy (repeaters coordination and distribution). According to advanced radio cellular coverage technology, usage of frequency attenuation and geometric mapping methods, Hata model, cellular coverage solution and FDM (Frequency Division Multiplexing) model were established. The algorithms used MATLAB to simulate, with the final modeling results of sensitivity analysis and improvement & promotion on models.Question one : For a circular flat area of radius 40 miles radius, determine the minimum number of repeaters necessary to accommodate 1,000 simultaneous users. Assume that the spectrum available is 145 to 148 MHz, the transmitter frequency in a repeater is either 600 kHz above or 600 kHz below the receiver frequency, and there are 54 different PL tones available.Answer:1. Based on Frequency attenuation expression and calculation with MATLAB, it figuredout the eligible coverage radiuses, which are 30km for BS (base station), and 14.9km for repeater.2. Assuming the users in a given area under uniform distribution, using advancedcellular coverage solution, we can calculate that minimum number of required repeater is 36 under cellular features.3. Based on the US VHF spectrum allocation standard, the minimum spacing for adjacentchannels is 30kHz. And with up to 54 different PL tones, maximum 4320 channels can be allocated to provide 1000 simultaneous users to use at the same time. Conclusion:The minimum number of repeaters necessary to accommodate 1,000 simultaneous users is 36.Question Two : How does your solution change if there are 10,000 users?Answer:1. Since the given spectrum is in a fixed range, even if 54 different PL tones can not be allocated enough channels for 10,000 simultaneous users. So the number of repeaters will be increased, meanwhile, the given area will be divided into different parts.2. On the assumption that uniform distribution of the population in the given area, it will be divided into 3 sub-regions equally by analyzing the binding domain, frequency spectrum and PL tones three independent factors. And then the number of repeaters within each sub-region will be classified discussion.3. The FDM (Frequency Division Multiplexing) model is established here to improve channel efficiency to accommodate up to 10,000 simultaneous users Conclusion:The minimum number of repeaters necessary to accommodate 10,000 simultaneous users is 126.Question Three : Discuss the case where there might be defects in line-of-sight propagation caused by mountainous areas. Answer:Basically, under the same condition for question 1&2, the mountainous area will be analyzed as following:1. The function for relationship between radio attenuation x caused by obstacles and the eligible coverage radius d for repeater is 2249.354371.4110x d -=, which is to analyze the impact on the number of repeaters under full signal coverage. 2. For the mountain barrier, based on the different situation of mountains, the addition of repeaters on the suitable location will be discussed to achieve full coverage. This paper describes model established by using of cellular coverage technology and frequency attenuation expression, to achieve simple, fast, accurate algorithm. And also illustrated the effect takes the entire article. In the end, the sensitivity analysis and error calculation are applied for modeling, making the model practically.Key words: Cellular Coverage technology, frequency attenuation expression, channel allocation, MatlabRepeaters coordination and distributionContent1 Restatement of the Problem (1)1.1 Introduction (1)1.2 The Problem (1)2 Simplifying Assumption (1)3 Phrase explain (1)4 Model (2)4.1 Model I (2)4.1.1 Analysis of the Problem (2)4.1.2 Model Design (2)5 Sensitivity analysis (2)6 Model extension (2)7 Evaluating our model (2)7.1 The strengths of model (2)7.2 The weaknesses of model (2)References (3)1 Restatement of the Problem1.1 IntroductionThe VHF radio spectrum involves line-of-sight transmission and reception. This limitation can be overcome by “repeaters,” which pick up weak signals, amplify them, and retransmit them on a different frequency. Thus, using a repeater, low-power users (such as mobile stations) can communicate with one another in situations where direct user-to-user contact would not be possible. However, repeaters can interfere with one another unless they are far enough apart or transmit on sufficiently separated frequencies.1.2 The ProblemYour job is to:◆Design a scheme that determines the minimum number of repeaters necessaryto accommodate 1,000 simultaneous users in a circular flat area of radius40 miles radius.And assume that the spectrum available is 145 to 148 MHz,the transmitter frequency in a repeater is either 600 kHz above or 600 kHz below the receiver frequency, and there are 54 different PL tones available.◆Change your scheme to accommodate 1,0000 simultaneous users base on yourmodel.◆Discuss the case where there might be defects in line-of-sight propagationcaused by mountainous areas.2 Simplifying Assumption3 Phrase explain4 Model4.1 Model I4.1.1 Analysis of the Problem4.1.2 Model Design5 Sensitivity analysisSymbol◆N: the number of total repeaters in the circle area ◆Q: the number of the users in the circle area◆k: the number of the red circle in figure 2最前面最好有一个Symbol List6 Model extension7 Evaluating our model7.1 The strengths of model7.2 The weaknesses of modelReferences参考文献不要引用非常差的期刊的论文,要引用比较厉害的英文期刊,证明你有足够的阅读文献量。
美国大学生数学建模竞赛 二等奖论文
The P roblem of R epeater C oordination SummaryThis paper mainly focuses on exploring an optimization scheme to serve all the users in a certain area with the least repeaters.The model is optimized better through changing the power of a repeater and distributing PL tones,frequency pairs ing symmetry principle of Graph Theory and maximum coverage principle,we get the most reasonable scheme.This scheme can help us solve the problem that where we should put the repeaters in general cases.It can be suitable for the problem of irrigation,the location of lights in a square and so on.We construct two mathematical models(a basic model and an improve model)to get the scheme based on the relationship between variables.In the basic model,we set a function model to solve the problem under a condition that assumed.There are two variables:‘p’(standing for the power of the signals that a repeater transmits)and‘μ’(standing for the density of users of the area)in the function model.Assume‘p’fixed in the basic one.And in this situation,we change the function model to a geometric one to solve this problem.Based on the basic model,considering the two variables in the improve model is more reasonable to most situations.Then the conclusion can be drawn through calculation and MATLAB programming.We analysis and discuss what we can do if we build repeaters in mountainous areas further.Finally,we discuss strengths and weaknesses of our models and make necessary recommendations.Key words:repeater maximum coverage density PL tones MATLABContents1.Introduction (3)2.The Description of the Problem (3)2.1What problems we are confronting (3)2.2What we do to solve these problems (3)3.Models (4)3.1Basic model (4)3.1.1Terms,Definitions,and Symbols (4)3.1.2Assumptions (4)3.1.3The Foundation of Model (4)3.1.4Solution and Result (5)3.1.5Analysis of the Result (8)3.1.6Strength and Weakness (8)3.1.7Some Improvement (9)3.2Improve Model (9)3.2.1Extra Symbols (10)Assumptions (10)3.2.2AdditionalAdditionalAssumptions3.2.3The Foundation of Model (10)3.2.4Solution and Result (10)3.2.5Analysis of the Result (13)3.2.6Strength and Weakness (14)4.Conclusions (14)4.1Conclusions of the problem (14)4.2Methods used in our models (14)4.3Application of our models (14)5.Future Work (14)6.References (17)7.Appendix (17)Ⅰ.IntroductionIn order to indicate the origin of the repeater coordination problem,the following background is worth mentioning.With the development of technology and society,communications technology has become much more important,more and more people are involved in this.In order to ensure the quality of the signals of communication,we need to build repeaters which pick up weak signals,amplify them,and retransmit them on a different frequency.But the price of a repeater is very high.And the unnecessary repeaters will cause not only the waste of money and resources,but also the difficulty of maintenance.So there comes a problem that how to reduce the number of unnecessary repeaters in a region.We try to explore an optimized model in this paper.Ⅱ.The Description of the Problem2.1What problems we are confrontingThe signals transmit in the way of line-of-sight as a result of reducing the loss of the energy. As a result of the obstacles they meet and the natural attenuation itself,the signals will become unavailable.So a repeater which just picks up weak signals,amplifies them,and retransmits them on a different frequency is needed.However,repeaters can interfere with one another unless they are far enough apart or transmit on sufficiently separated frequencies.In addition to geographical separation,the“continuous tone-coded squelch system”(CTCSS),sometimes nicknamed“private line”(PL),technology can be used to mitigate interference.This system associates to each repeater a separate PL tone that is transmitted by all users who wish to communicate through that repeater. The PL tone is like a kind of password.Then determine a user according to the so called password and the specific frequency,in other words a user corresponds a PL tone(password)and a specific frequency.Defects in line-of-sight propagation caused by mountainous areas can also influence the radius.2.2What we do to solve these problemsConsidering the problem we are confronting,the spectrum available is145to148MHz,the transmitter frequency in a repeater is either600kHz above or600kHz below the receiver frequency.That is only5users can communicate with others without interferences when there’s noPL.The situation will be much better once we have PL.However the number of users that a repeater can serve is limited.In addition,in a flat area ,the obstacles such as mountains ,buildings don’t need to be taken into account.Taking the natural attenuation itself is reasonable.Now the most important is the radius that the signals transmit.Reducing the radius is a good way once there are more users.With MATLAB and the method of the coverage in Graph Theory,we solve this problem as follows in this paper.Ⅲ.Models3.1Basic model3.1.1Terms,Definitions,and Symbols3.1.2Assumptions●A user corresponds a PLz tone (password)and a specific frequency.●The users in the area are fixed and they are uniform distribution.●The area that a repeater covers is a regular hexagon.The repeater is in the center of the regular hexagon.●In a flat area ,the obstacles such as mountains ,buildings don’t need to be taken into account.We just take the natural attenuation itself into account.●The power of a repeater is fixed.3.1.3The Foundation of ModelAs the number of PLz tones (password)and frequencies is fixed,and a user corresponds a PLz tone (password)and a specific frequency,we can draw the conclusion that a repeater can serve the limited number of users.Thus it is clear that the number of repeaters we need relates to the density symboldescriptionLfsdfminrpμloss of transmission the distance of transmission operating frequency the number of repeaters that we need the power of the signals that a repeater transmits the density of users of the areaof users of the area.The radius of the area that a repeater covers is also related to the ratio of d and the radius of the circular area.And d is related to the power of a repeater.So we get the model of function()min ,r f p µ=If we ignore the density of users,we can get a Geometric model as follows:In a plane which is extended by regular hexagons whose side length are determined,we move a circle until it covers the least regular hexagons.3.1.4Solution and ResultCalculating the relationship between the radius of the circle and the side length of the regular hexagon.[]()()32.4420lg ()20lg Lfs dB d km f MHz =++In the above formula the unit of ’’is .Lfs dB The unit of ’’is .d Km The unit of ‘‘is .f MHz We can conclude that the loss of transmission of radio is decided by operating frequency and the distance of transmission.When or is as times as its former data,will increase f d 2[]Lfs .6dB Then we will solve the problem by using the formula mentioned above.We have already known the operating frequency is to .According to the 145MHz 148MHz actual situation and some authority material ,we assume a system whose transmit power is and receiver sensitivity is .Thus we can conclude that ()1010dBm mW +106.85dBm −=.Substituting and to the above formula,we can get the Lfs 106.85dBm −145MHz 148MHz average distance of transmission .()6.4d km =4mile We can learn the radius of the circle is 40mile .So we can conclude the relationship between the circle and the side length of regular hexagon isR=10d.1)The solution of the modelIn order to cover a certain plane with the least regular hexagons,we connect each regular hexagon as the honeycomb.We use A(standing for a figure)covers B(standing for another figure), only when As don’t overlap each other,the number of As we use is the smallest.Figure1According to the Principle of maximum flow of Graph Theory,the better of the symmetry ofthe honeycomb,the bigger area that it covers(Fig1).When the geometric centers of the circle andthe honeycomb which can extend are at one point,extend the honeycomb.Then we can get Fig2,Fig4:Figure2Fig3demos the evenly distribution of users.Figure4Now prove the circle covers the least regular hexagons.Look at Fig5.If we move the circle slightly as the picture,you can see three more regularhexagons are needed.Figure 52)ResultsThe average distance of transmission of the signals that a repeater transmit is 4miles.1000users can be satisfied with 37repeaters founded.3.1.5Analysis of the Result1)The largest number of users that a repeater can serveA user corresponds a PL and a specific frequency.There are 5wave bands and 54different PL tones available.If we call a code include a PL and a specific frequency,there are 54*5=270codes.However each code in two adjacent regular hexagons shouldn’t be the same in case of interfering with each other.In order to have more code available ,we can distribute every 3adjacent regular hexagons 90codes each.And that’s the most optimized,because once any of the three regular hexagons have more codes,it will interfere another one in other regular hexagon.2)Identify the rationality of the basic modelNow we considering the influence of the density of users,according to 1),90*37=3330>1000,so here the number of users have no influence on our model.Our model is rationality.3.1.6Strength and Weakness●Strength:In this paper,we use the model of honeycomb-hexagon structure can maximize the use of resources,avoiding some unnecessary interference effectively.It is much more intuitive once we change the function model to the geometric model.●Weakness:Since each hexagon get too close to another one.Once there are somebuildingsor terrain fluctuations between two repeaters,it can lead to the phenomenon that certain areas will have no signals.In addition,users are distributed evenly is not reasonable.The users are moving,for example some people may get a party.3.1.7Some ImprovementAs we all know,the absolute evenly distribution is not exist.So it is necessary to say something about the normal distribution model.The maximum accommodate number of a repeater is 5*54=270.As for the first model,it is impossible that 270users are communicating in a same repeater.Look at Fig 6.If there are N people in the area 1,the maximum number of the area 2to area 7is 3*(270-N).As 37*90=3330is much larger than 1000,our solution is still reasonable to this model.Figure 63.2Improve Model3.2.1Extra SymbolsSigns and definitions indicated above are still valid.Here are some extra signs and definitions.symboldescription Ra the radius of the circular flat area the side length of a regular hexagon3.2.2Additional AdditionalAssumptionsAssumptions ●The radius that of a repeater covers is adjustable here.●In some limited situations,curved shape is equal to straight line.●Assumptions concerning the anterior process are the same as the Basic Model3.2.3The Foundation of ModelThe same as the Basic Model except that:We only consider one variable(p)in the function model of the basic model ;In this model,we consider two varibles(p and μ)of the function model.3.2.4Solution and Result1)SolutionIf there are 10,000users,the number of regular hexagons that we need is at least ,thus according to the the Principle of maximum flow of Graph Theory,the 10000111.1190=result that we draw needed to be extended further.When the side length of the figure is equal to 7Figure 7regular hexagons,there are 127regular hexagons (Fig 7).Assuming the side length of a regular hexagon is ,then the area of a regular hexagon is a .The area of regular hexagons is equal to a circlewhose radiusis 22a =1000090R.Then according to the formula below:.221000090a R π=We can get.9.5858R a =Mapping with MATLAB as below (Fig 8):Figure 82)Improve the model appropriatelyEnlarge two part of the figure above,we can get two figures below (Fig 9and Fig 10):Figure 9AREAFigure 10Look at the figure above,approximatingAREA a rectangle,then obtaining its area to getthe number of users..The length of the rectangle is approximately equal to the side length of the regular hexagon ,athe width of the rectangle is ,thus the area of AREA is ,then R −*R a ⎛⎞−⎜⎟⎜⎟⎝⎠we can get the number of users in AREA is(),2**10000 2.06R a R π⎡⎤⎛⎞−⎢⎥⎜⎟⎢⎥⎝⎠=⎢⎥⎢⎥⎢⎥⎣⎦9.5858R a =As 2.06<<10,000,2.06can be ignored ,so there is no need to set up a repeater in.There are 6such areas(92,98,104,110,116,122)that can be ignored.At last,the number of repeaters we should set up is,1276121−=2)Get the side length of the regular hexagon of the improved modelThus we can getmile=km 40 4.1729.5858a == 1.6* 6.675a =3)Calculate the power of a repeaterAccording to the formula[]()()32.4420lg ()20lg Lfs dB d km f MHz =++We get32.4420lg 6.67520lg14592.156Los =++=32.4420lg 6.67520lg14892.334Los =++=So we get106.85-92.156=14.694106.85-92.334=14.516As the result in the basic model,we can get the conclusion the power of a repeater is from 14.694mW to 14.516mW.3.2.5Analysis of the ResultAs 10,000users are much more than 1000users,the distribution of the users is more close toevenly distribution.Thus the model is more reasonable than the basic one.More repeaters are built,the utilization of the outside regular hexagon are higher than the former one.3.2.6Strength and Weakness●Strength:The model is more reasonable than the basic one.●Weakness:Repeaters don’t cover all the area,some places may not receive signals.And thefoundation of this model is based on the evenly distribution of the users in the area,if the situation couldn’t be satisfied,the interference of signals will come out.Ⅳ.Conclusions4.1Conclusions of the problem●Generally speaking,the radius of the area that a repeater covers is4miles in our basic model.●Using the model of honeycomb-hexagon structure can maximize the use of resources,avoiding some unnecessary interference effectively.●The minimum number of repeaters necessary to accommodate1,000simultaneous users is37.The minimum number of repeaters necessary to accommodate10,000simultaneoususers is121.●A repeater's coverage radius relates to external environment such as the density of users andobstacles,and it is also determined by the power of the repeater.4.2Methods used in our models●Analysis the problem with MATLAB●the method of the coverage in Graph Theory4.3Application of our models●Choose the ideal address where we set repeater of the mobile phones.●How to irrigate reasonably in agriculture.●How to distribute the lights and the speakers in squares more reasonably.Ⅴ.Future WorkHow we will do if the area is mountainous?5.1The best position of a repeater is the top of the mountain.As the signals are line-of-sight transmission and reception.We must find a place where the signals can transmit from the repeater to users directly.So the top of the mountain is a good place.5.2In mountainous areas,we must increase the number of repeaters.There are three reasons for this problem.One reason is that there will be more obstacles in the mountainous areas. The signals will be attenuated much more quickly than they transmit in flat area.Another reason is that the signals are line-of-sight transmission and reception,we need more repeaters to satisfy this condition.Then look at Fig11and Fig12,and you will know the third reason.It can be clearly seen that hypotenuse is larger than right-angleFig11edge(R>r).Thus the radius will become smaller.In this case more repeaters are needed.Fig125.3In mountainous areas,people may mainly settle in the flat area,so the distribution of users isn’t uniform.5.4There are different altitudes in the mountainous areas.So in order to increase the rate of resources utilization,we can set up the repeaters in different altitudes.5.5However,if there are more repeaters,and some of them are on mountains,more money will be munication companies will need a lot of money to build them,repair them when they don’t work well and so on.As a result,the communication costs will be high.What’s worse,there are places where there are many mountains but few persons. Communication companies reluctant to build repeaters there.But unexpected things often happen in these places.When people are in trouble,they couldn’t communicate well with the outside.So in my opinion,the government should take some measures to solve this problem.5.6Another new method is described as follows(Fig13):since the repeater on high mountains can beFig13Seen easily by people,so the tower which used to transmit and receive signals can be shorter.That is to say,the tower on flat areas can be a little taller..Ⅵ.References[1]YU Fei,YANG Lv-xi,"Effective cooperative scheme based on relay selection",SoutheastUniversity,Nanjing,210096,China[2]YANG Ming,ZHAO Xiao-bo,DI Wei-guo,NAN Bing-xin,"Call Admission Control Policy based on Microcellular",College of Electical and Electronic Engineering,Shijiazhuang Railway Institute,Shijiazhuang Heibei050043,China[3]TIAN Zhisheng,"Analysis of Mechanism of CTCSS Modulation",Shenzhen HYT Co,Shenzhen,518057,China[4]SHANGGUAN Shi-qing,XIN Hao-ran,"Mathematical Modeling in Bass Station Site Selectionwith Lingo Software",China University of Mining And Technology SRES,Xuzhou;Shandong Finance Institute,Jinan Shandon,250014[5]Leif J.Harcke,Kenneth S.Dueker,and David B.Leeson,"Frequency Coordination in the AmateurRadio Emergency ServiceⅦ.AppendixWe use MATLAB to get these pictures,the code is as follows:1-clc;clear all;2-r=1;3-rc=0.7;4-figure;5-axis square6-hold on;7-A=pi/3*[0:6];8-aa=linspace(0,pi*2,80);9-plot(r*exp(i*A),'k','linewidth',2);10-g1=fill(real(r*exp(i*A)),imag(r*exp(i*A)),'k');11-set(g1,'FaceColor',[1,0.5,0])12-g2=fill(real(rc*exp(i*aa)),imag(rc*exp(i*aa)),'k');13-set(g2,'FaceColor',[1,0.5,0],'edgecolor',[1,0.5,0],'EraseMode','x0r')14-text(0,0,'1','fontsize',10);15-Z=0;16-At=pi/6;17-RA=-pi/2;18-N=1;At=-pi/2-pi/3*[0:6];19-for k=1:2;20-Z=Z+sqrt(3)*r*exp(i*pi/6);21-for pp=1:6;22-for p=1:k;23-N=N+1;24-zp=Z+r*exp(i*A);25-zr=Z+rc*exp(i*aa);26-g1=fill(real(zp),imag(zp),'k');27-set(g1,'FaceColor',[1,0.5,0],'edgecolor',[1,0,0]);28-g2=fill(real(zr),imag(zr),'k');29-set(g2,'FaceColor',[1,0.5,0],'edgecolor',[1,0.5,0],'EraseMode',xor';30-text(real(Z),imag(Z),num2str(N),'fontsize',10);31-Z=Z+sqrt(3)*r*exp(i*At(pp));32-end33-end34-end35-ezplot('x^2+y^2=25',[-5,5]);%This is the circular flat area of radius40miles radius 36-xlim([-6,6]*r)37-ylim([-6.1,6.1]*r)38-axis off;Then change number19”for k=1:2;”to“for k=1:3;”,then we get another picture:Change the original programme number19“for k=1:2;”to“for k=1:4;”,then we get another picture:Change the original programme number19“for k=1:2;”to“for k=1:1;”,and delete number 35“ezplot('x^2+y^2=25',[-5,5]);”then we get another picture:Change the original programme number19“for k=1:2;”to“for k=1:6;”,and change number 35“ezplot('x^2+y^2=25',[-5,5]);”to”ezplot('x^2+y^2=6*sqrt(3)*10000/360/pi',[-20,20]);”Change number36,37“36-xlim([-6,6]*r)37-ylim([-6.1,6.1]*r)”To“xlim([-20,20]*r)ylim([-20.1,20.1]*r)”,then we getTeam#8921Page21of21Delete“36-xlim([-6,6]*r)37-ylim([-6.1,6.1]*r)”We get。
美国大学生数学建模大赛模拟1论文
生猪年末存栏量及猪肉价格 周期性波动研究
摘要
本文是关于时间序列数据的预测探究的,我们利用灰色系统理论和自己建立 的模拟函数对生猪的年末存栏量和 36 个大中城市的猪肉价格进行了模拟和预 测。 在对第一问生猪年末存栏量的预测中,由于 1997 年以前的统计数据不真实, 从而导致可用信息贫乏,据此特点我们采用了灰色系统理论中的 GM(1,1)模型。 通过对已知数据和生猪养殖业的分析我们发现生猪养殖随供求关系的变化呈周 期性的波动, 波动周期为 3 至 4 年,又鉴于我国经济社会和人民生活水平的不断 发展,生猪养殖业总体上呈现上升趋势。GM(1,1)并无对周期性变化数据的预测 能力, 但对单调趋势的小信息量数据有较好的预测能力,据此我们剔除数据中的 波动成分,即选取原始序列时每隔 3 年取一点,得出 2010 的生猪存栏量为 44770.6 (万头) 。 最后对预测结果的检验发现其与原数据的偏差不会超过 3.03%, 从而保证了预测结果的可靠性。 利用生猪年末存栏量随时间增长但呈现周期性波 动的特性, 我们还建立了与之适应的模拟函数模型,模拟函数包括由一次函数表 征的增长部分、由正弦函数表征的波动部分和由正态函数表征的冲击部分(如 03 年和 06 年生猪养殖业遭到了重大变故,反应在存栏量上有很大波动) 。以最 小二乘法确定此模拟函数的各项参数,进而预测出 2010 年末的生猪存栏量为 46813 万头。由于模拟函数是在机理分析的基础上建立的,所以很好的吻合了已 知数据, 从而对未来数据的预测也就有了保证。两种预测模型预测结果还是有较 大差异的,但我们认为机理分析在预测中是更有效的方式,所以更倾向于把 46813 万头作为最终预测结果。 第二问要求对 36 个大中城市的猪肉价格做出预测。通过对猪肉市场和已有 数据的分析研究, 我们发现猪肉价格在总体上仍然呈现 3 到 4 年为一个周期的波 动,而在每一年中,猪肉价格受节假日、经济波动和病疫等诸多因素的影响,呈 现小幅度短周期的波动情况。 鉴于此变化规律,我们构造的模拟函数包括表示初 始价格的常数、 表示总体波动的周期为 4 年的正弦函数和表示众多繁杂因素影响 的傅里叶级数(出于计算考虑取级数前 50 项) 。通过最小二乘法确定各参数,得 出的模拟函数对已知数据完全贴合。在模型检验中,我们只用部分已知数据来确 定模拟函数, 发现模拟结果与未使用的数据也有很好的吻合程度。 为了进一步检 验模型我们查阅了新的猪肉价格信息发现其与预测价格有相近的走势。 这些都验 证了模拟方法的正确性和模拟函数的有效性。
- 1、下载文档前请自行甄别文档内容的完整性,平台不提供额外的编辑、内容补充、找答案等附加服务。
- 2、"仅部分预览"的文档,不可在线预览部分如存在完整性等问题,可反馈申请退款(可完整预览的文档不适用该条件!)。
- 3、如文档侵犯您的权益,请联系客服反馈,我们会尽快为您处理(人工客服工作时间:9:00-18:30)。
Titile
Summary
During cell division, mitotic spindles are assembled by microtubule-based motor proteins1, 2. The bipolar organization of spindles is essential for proper segregation of chromosomes, and requires plus-end-directed homotetrameric motor proteins of the widely conserved kinesin-5 (BimC) family3. Hypotheses for bipolar spindle formation include the 'push−pull mitotic muscle' model, in which kinesin-5 and opposing motor proteins act between overlapping microtubules2, 4, 5. However, the precise roles of kinesin-5 during this process are unknown. Here we show that the vertebrate kinesin-5 Eg5 drives the sliding of microtubules depending on their relative orientation. We found in controlled in vitro assays that Eg5 has the remarkable capability of simultaneously moving at 20 nm s-1 towards the plus-ends of each of the two microtubules it crosslinks. For anti-parallel microtubules, this results in relative sliding at 40 nm s-1, comparable to spindle pole separation rates in vivo6. Furthermore, we found that Eg5 can tether microtubule plus-ends, suggesting an additional microtubule-binding mode for Eg5. Our results demonstrate how members of the kinesin-5 family are likely to function in mitosis, pushing apart interpolar microtubules as well as recruiting microtubules into bundles that are subsequently polarized by relative sliding. We anticipate our assay to be a starting point for more sophisticated in vitro models of mitotic spindles. For example, the individual and combined action of multiple mitotic motors could be tested, including minus-end-directed motors opposing Eg5 motility. Furthermore, Eg5 inhibition is a major target of anti-cancer drug development, and a well-defined and quantitative assay for motor function will be relevant for such developments
Content
Titile (1)
Summary (1)
1Introduction (1)
1.1Restatement of the Problem (1)
1.2Background (1)
1.1.1Common Solving Technique (1)
1.1.2Previous Works (1)
1.3Example (1)
2Analysis of the Problem (1)
2.1Outline of the Approach (1)
2.2Basic Assumptions (2)
2.3Definitions and Key Terms (2)
3Calculating and Simplifying the Model (2)
4The Model Results (3)
5Validating the Model (3)
6Strengths and Weaknesses (3)
6.1Strengths (3)
6.2Weaknesses (3)
7Food for Thought (3)
8Conclusion (3)
References (4)
Appendices (4)
Appendix A Source Code (4)
Appendix B (4)
1Introduction
1.1Restatement of the Problem …
1.2Background
…
1.1.1Common Solving Technique
…
1.1.2Previous Works
…
1.3Example
…
2Analysis of the Problem …
2.1Outline of the Approach
…
2.2Basic Assumptions
●
●
●
●
●
2.3Definitions and Key Terms
●
●
●
●
Table 1.
…
Symbol Meaning Unit
3Calculating and Simplifying the Model …
4The Model Results
……
5Validating the Model
…
6Strengths and Weaknesses
6.1S trengths
●
●
●
●
6.2W eaknesses
●
●
●
●
7Food for Thought
…
8Conclusion
….
References
…
Appendices
Appendix A Source Code
Here are the simulation programmes we used in our model as follow. Input matlab source:
……
….
Appendix B
…….
Input C++ source:
…………..
…………..。