USA Observation of Spectral and Timing Evolution During the 2000 Outburst of XTE J1550-564
“高分五号”卫星大气主要温室气体监测仪(特邀)
第48卷第3期Vol.48No.3红外与激光工程Infrared and Laser Engineering2019年3月Mar.2019“高分五号”卫星大气主要温室气体监测仪(特邀)熊伟12(1.中国科学院安徽光学精密机械研究所,安徽合肥230031:2.中国科学院通用光学定标与表征技术重点实验,安徽合肥230031)摘要:“高分五号”卫星于2018年5月9日成功发射,是我国第一颗高光谱观测卫星,大气主要温室气体监测仪是其中一台有效载荷,采用空间外差光谱技术进行高光谱分光,是国际上首台基于该体制的星载温室气体遥感设备。
阐述了载荷的基本工作原理,包括分光原理、工作模式及通道设置等内容。
载荷的光学系统主要由五部分组成,核心单元为一体化胶合干涉仪,为避免光谱混叠对窄带滤光片的指标参数要求较高。
为提高在轨数据定量化水平,载荷设计了基于漫反射板系统的定标装置,可满足光谱及辐射定标要求。
最后,梳理了载荷数据处理的基本流程,并对首批观测数据进行了光谱复原,成功获取了1级数据产品,为下一步温室气体反演应用奠定了基础。
关键词:高分五号;温室气体;高光谱;空间外差光谱技术;傅里叶变换中图分类号:0434.3文献标志码:A DOI:10.3788/IRLA201948.0303002Greenhouse gases Monitoring Instrument(GMI)on GF-5satellite(invited)Xiong Wei1,2(1.Anhui Institute of Optics and Fine Mechanics,Chinese Academy of Sciences,Hefei230031,China;2.Key Laboratory of Optical Calibration and Characterization of Chinese Academy of Sciences,Hefei230031,China)Abstract:GF-5satellite was successfully launched on May9,2018.It is the first hyperspectral observation satellite in China.The Greenhouse gas Monitoring Instrument is one of the pay l oads.It is the first satellite-borne greenhouse gas remote sensing equipment in the world to use spatial heterodyne spectroscopy technology for hyperspectral spectroscopy.The basic working principle of the payload was described,including the principle of light splitting,working mode and band setting.The optical system of the payload consisted of five parts.The core unit was a bonded interferometer.In order to avoid spectral aliasing,the parameters of narrowband filters were required to be high.In order to improve the on-orbit data quantification level,a calibration device based on diffuse reflector system was designed,which can meet the requirements of spectral and radiation calibration.Finally,the basic process of payload data processing was sorted out,and the first batch of observed data was restored by spectrum.The first-level data products are successfully obtained,which lays a foundation for the next application of greenhouse gas inversion.Key words:GF-5satellite;greenhouse gases;hyperspectral;spatial heterodyne spectroscopy technology;Fourier transform收稿日期:2019-02-10;修订日期:2019-02-20基金项目:国家高分重大科技专项;民用航天预研项目(D040102)作者简介:熊伟(1975-),男,研究员,博士,主要从事超光谱遥感探测技术方面的研究。
深入理解高斯白噪声(AWGN)信道

高斯信道百科名片高斯信道(Gaussian channel,通信专业术语)是一个射频通信信道,其包含了各种频率的特定噪声频谱密度的的特征,从而导致了信道中错误的任意分布。
目录信道与高斯信道1.信道(information channels,通信专业术语)是信号的传输媒质,可分为有线信道和无线信道两类。
有线信道包括明线、对称电缆、同轴电缆及光缆等。
无线信道有地波传播、短波电离层反射、超短波或微波视距中继、人造卫星中继以及各种散射信道等。
如果我们把信道的范围扩大,它还可以包括有关的变换装置,比如:发送设备、接收设备、馈线与天线、调制器、解调器等,我们称这种扩大的信道为广义信道,而称前者为狭义信道。
2.信道:信息传输的媒质或渠道。
在电信或光通信(光也是一种电磁波)场合,信道可以分为两大类:一类是电磁波的空间传播渠道,如短波信道、超短波信道、微波信道、光波信道等;另一类是电磁波的导引传播渠道。
如明线信道、电缆信道、波导信道、光纤信道等。
前一类信道是具有各种传播特性的自由空间,所以习惯上称为无线信道;后一类信道是具有各种传输能力的导引体,习惯上就称为有线信道。
信道的作用是把携有信息的信号(电的或光的)从它的输入端传递到输出端,因此,它的最重要特征参数是信息传递能力(也叫信息通过能力)。
在典型的情况(即所谓高斯信道)下,信道的信息通过能力与信道的通过频带宽度、信道的工作时间、信道的噪声功率密度(或信道中的信号功率与噪声功率之比)有关:频带越宽,工作时间越长,信号与噪声功率比越大,则信道的通过能力越强移动通信高斯信道理论模型高期信道,最简单的信道,常指加权高斯白噪声(AWGN)信道。
这种噪声假设为在整个信道带宽下功率谱密度(PDF)为常数,并且振幅符合高斯概率分布。
高期信道对于评价系统性能的上界具有重要意义,对于实验中定量或定性地评价某种调制方案、误码率(BER)性能等有重要作用。
加性高斯白噪声(Additive White Gaussian Noise,AWGN)在通信领域中指的是一种幅度服从高斯分布,各频谱分量在频谱域上服从均匀分布(即白噪声)的噪声信号。
(整理)光电名词中英索引

光电名词中英索引光电名词中英索引-AA M light振幅调制光,调幅光A-frameA形架a.c. circuit交流电路a.c. discharge交流放电a.f. oscillator声频振荡器A/D conversion仿真-数字转换A/D Converter模拟数字讯号转换器abac算图,列线图abampere电磁系电流单位abaxial轴外的,离轴的Abb'e Condenser阿贝聚光器Abb'e constant阿贝常数Abb'e Illumination阿贝照明Abb'e Porro阿贝坡若Abb'e Prism阿贝棱镜Abb'e Refractometer阿贝折射计Abb'e Sine Condition阿贝正弦条件Abbe apertometer阿贝〔数值〕孔径计Abbe condenser阿贝聚光镜Abbe constant阿贝常数Abbe double-diffractionprinciple阿贝双衍射原理Abbe eyepiece阿贝目镜Abbe illuminator阿贝照明器Abbe invariant阿贝不变量Abbe number阿贝数,色散系数Abbe photometric law阿贝光度定律Abbe prism阿贝棱镜Abbe refractometer阿贝折射计Abbe resolution criterion阿贝分办率判断Abbe treatment阿贝处理Abbe's formula阿贝公式Abbe's number阿贝数Abbe's principle阿贝原理Abbe's sine condition阿贝正弦条件Abbe's sine rule阿贝正弦定则Abbe's theory of image formation阿贝成像理论Abbe-Konig prism阿贝-柯尼希棱镜Abbe-type vertical metroscope 阿贝型立式测长义aberrated lens system有像差透镜系统aberrated optics有像差光学系统aberrating medium致〔像〕差媒质Aberration像差aberration balancing像差平衡aberration blur circle像差模糊图aberration constant光行差常数,光行差恒量aberration correction像差校正aberration curve像差曲线aberration figure像差斑,像差图形aberration function像差函数aberration haze像差光雾aberration ofreconstructed wave重建波〔的〕像差aberration residuals残余像差Aberration Sensor像差感应器aberration-free system无像差系统aberrationless无像差的ablation(1)冲蚀,烧蚀,消融(2)切除ablative flashlamp消融闪光灯,烧蚀闪光灯ablative recording〔光〕冲蚀记录Ablative Wall Flashlamp闪光壁灯,剥壁闪光灯Abney level阿布尼水平器Abney mounting for concave grating阿布饰凹面光栅装置abnormal反常,异常abnormal dispersion glass反常色散玻离abnormal glow discharge 反常辉光放电abnormal refraction反常折射above-critical state超临界〔状〕态above-threshold operation method超阈值运转法(激光器)abradant磨料abrade磨蚀,擦伤abrased glass磨砂玻离,毛玻璃abrasion磨蚀Abrasion Maarks磨耗纹abrasion resistance磨蚀阻力Abrasive磨料abrasive disk(1)研磨盘(2)砂轮abrasive fog磨擦灰雾abrasive grit磨料粒度abrasive hardness研磨硬度,耐磨硬度abrasive material研磨材料abrasive powder研磨粉abrasive slurry of corundum金钢砂磨剂abrasive wear磨蚀,磨损abrideged monochromator 滤色单色仪AbridgedSpectrophotometer筒缩分光光度计abrupt突变、陡变abrupt contrast border突变衬比界,陡变友差界abrupt junction突变结,阶跃结abruption(1)隔断(2)断裂abscissa横坐标absentee layer虚设层absest(=asbestos或asbestus)石棉absolute atmosphere绝对大气压absolute black body绝对黑体absolute brightness绝对亮度absolute calibration绝对校准Absolute Coordinate绝对坐标absolute detector response检测器绝对响应〔值〕absolute deviation绝对偏差absolute error绝对误差absolute index ofrefraction绝对折射率absolute luminance threshold(1)绝对〔光〕亮度阈(2)绝对发光率阈Absolute LuminanceThresshold绝对照明底限absolute measurement绝对测量absolute optical frequency绝对光频测量absolute optimal function绝对最佳函数absolute parallax绝对相位Absolute Purity Thresshold 绝对纯度底限Absolute RefractiveIndex绝对折射率absolute sensitivity绝对灵敏度Absolute Signal Delay绝对信号延时absolute stability(1)绝对稳定性(2)绝对稳定度absolute temperature绝对温度Absolute Temperature Scale 绝对温标Absolute Threshold绝对界限absolute unite绝对单位absolute value绝对值Absolute Vector绝对矢量absolute zero绝对零度absorb(1)吸收(2)减震absorbability可吸收性absorbable可吸收〔的〕Absorbable implant (scleral buckling method)可吸收之植入物(巩膜扣环法) Absorbance吸收率absorbance index(1)吸收性(2)吸收率吸光率,吸光本领absorbed layer被吸收层absorbed power被吸收率absorbent(1)吸收质(2)吸收体absorber(1)吸收器(2)吸收体(3)减震器absorbing apodisation screen吸收切趾屏absorbing crystal吸收晶体absorbing inclusion吸收掺杂absorbing medium吸收媒质absorbing phase strip吸收相位遮板absorbing power吸收本领absorbing sheet吸收片absorbing unidimensional apodisator吸收单维切趾器Absorbing Wedge吸收光劈Absorptance吸收比absorptiometer(1)液体吸收气计(2)吸收比色计absorptiometry吸收测量学Absorption吸收absorption hologram吸收全息图Absorption Attenuator选择性吸收Absorption Band吸收光带absorption capacity吸收本领Absorption Cell吸收匣absorption characteristic 吸收特性Absorption Ciefficient吸收系数absorption coefficient吸收系数absorption colour吸收色absorption control吸收控制Absorption Curve吸收曲线Absorption Discontinuity 间歇吸收absorption dynamometer 吸收功率计absorption edge吸收限absorption effect吸收效应absorption factor吸收因子Absorption Frequency Meter吸收性频率计Absorption Index吸收指数Absorption Indication吸收指示剂Absorption Lens吸收透镜absorption level(1)吸收能级(2)吸收率absorption limit吸收限Absorption Line吸收谱线Absorption Loss吸收损失absorption mean free path吸引平均自由〔路〕程absorption notch吸收凹陷Absorption of Radiation吸收调制Absorption Peak辐射吸收absorption rate吸收率Absorption Selective吸收光谱学Absorption Spectroscopy吸收锋absorption spectrum吸收〔光〕谱absorption wave-meter吸收式波长计absorption-dip(1)吸收〔引起的〕倾斜(2)吸收〔引起的〕凹陷absorption-free materiall无吸收材料absorptive吸收的absorptive lens吸收透镜absorptive power吸收本领absorptive-type modulator吸收型调制器Absorptivety吸收率Absorptivie Attenuator吸收衰减器absorptivity(1)吸收性,吸收能力(2)吸收率abstract code抽像代码abundance(1)丰度(2)分布量abunits(e.m.u.)〔c.g.s〕电磁系单位abut (abutment)(1)支座,支架(2)邻接abvolt〔c.g.s〕电磁系电势单位,绝对伏特(108伏特) AC-powered magnet交流电力式磁铁AC-powered photostimulator交流式光刺激器AC-powered slitlamp biomicroscope交流电力式细隙灯acceleratedphosphorescence加速发磷光accelerating electrode加速电极accelerating lens加速〔电子〕透镜accelerating potential加速〔电〕势差,加速〔电〕位差Accelerating Voltage加速电压Acceleration Space加速空间accelerator(1)加速器(2)〔显影〕促进剂accelerograph自动加速度记录仪Accentuated Contrast加动对反差accentuation(1)加重(2)频率校正(3)对比accentuator(1)加重器(2)频率效正电路Acceptance Angle接受角Acceptance Angle Plotter接受角绘图器Acceptance Cone接受锥体acceptance gauge验收规Acceptance Pattern接受图Acceptor受体acceptor density受主浓度acceptor impurity受主杂质acceptor impurity level受主杂质能级acceptor level受主〔能〕级acceptor site受主〔能〕级access(1)入口通路(2)取数(3)存取(泛指取数或存数) Access Coupler出入偶合器access time存取时间,取数时间access width存取位数accessory零任,附件,附属设备accidental degeneracy随机简并度accidental error偶然误差Accommodation调节,适应Accommodation Limits调节极限accommodometer眼调节计Accomulator蓄信器accumulation(1)累积,积蓄(2)存储accumulation point聚集点accumulative error累积误差accumulator(1)存储器(2)蓄电池(3)累积器accumulator register累加寄存器accuracy(1)准确(2)准确度accuracy grade准确度等级accuracy of test glass玻璃样板准确度acetate base醋纤片基acetate cellulose butyrate 醋酸纤维丁酯Acetate Film醋酸膜acetic醋的acetic acid醋酸acetone丙酮acetonitrile乙青acetophenone photoreduction乙洗苯苯光致还原acetyl cellulose乙洗纤维素acetylene(1)乙炔,电石气(2)双亚乙基achloropsia绿色盲achromat消色差透镜,消色差镜头achromate色盲Achromatic消色差的achromatic coating消色差镀膜Achromatic Color消色色彩achromatic colour无彩色achromatic condenser消色差聚光镜achromatic coronagraph消色差日冕仪achromatic doublet消色差双合透镜achromatic fringe消色差条纹achromatic image消色差块achromatic lens消色差透镜Achromatic Lens, Achromat消色差透镜achromatic light白光,消色差光,无彩〔色〕光achromatic microobjective消色差显微物镜achromatic objective消色差物镜Achromatic Point消色点achromatic prism消色差棱镜achromatic quarter waveplate 消色差四分之一波片achromatic telescope消色差望远镜achromatic triplet消色差三合〔透〕镜achromatic wedge消色差光劈,消色差光楔Achromatism消色差性achromatizarion消色差achromatized〔已〕消色差〔的〕achromatopsia全色盲acicular针状的acicular crystal针状晶体acid酸、酸性的acid developmentacid proof耐酸的acid wash酸洗的acid-free无酸的acidic solution酸溶液acidity(1)酸性(2)酸度acme thread梯型螺纹Acolight音灯acoustic beam deflector 声束偏转器acoustic branch声频支acoustic coupler声音藕合器;音效藕合器Acoustic Delay Line声延迟线acoustic diffraction grating声衍射栅acoustic dispersion声频散acoustic emission wave 声发射波acoustic field声场acoustic hologram声全息图acoustic holographic system声全息系统acoustic holography声全息术acoustic image声像acoustic imaging声成像Acoustic ImpedanceAcoustic Interferometer 声干涉仪acoustic microscopy声显微术Acoustic Radiation Pressure声发射压力acoustic signal声频信号Acoustic Surface Wave 声表面波acoustic surfacewave(ASW)声面波acoustic to optical image converter声光像转换器Acoustic Wave Filter声波滤器acoustic wave propagation声波传播Acoustical Conduction 声导acoustical hologram声波全像体Acoustical Holography 声波全像术Acoustical Units声学单位acoustics(1)声学(2)音质Acousto Photorefractive Effect声光折射效应acousto-optic声光的acousto-optic beam positioning声光束定位acousto-opticBragg-diffraction声光布喇格衍射acousto-optic cavity声光腔acousto-optic cell声光调制器,声光盒Acousto-Optic Deflection声光偏转,声光偏差Acousto-Optic Deflector声光致偏器Acousto-OpticDiffraction声光绕射acousto-optic effect声光效应acousto-optic filter声光滤波器acousto-optic interaction声光相互作用acousto-optic laser声光激光器acousto-optic light deflector 声光偏转器acousto-optic materiall声光材料acousto-opticmode-locker frequency doubler声光锁模倍频器Acousto-Optic Modulation声光调制acousto-optic modulator声光调制器acousto-optic Q-switching声光Q开关acousto-optic scanner声光扫瞄器Acousto-Optic Shutters声光快门acousto-optically tunedlaser声光调谐激光器acousto-photorefractive effect 声光折射效应Acoustooptic Effect声光效应acoustooptics声光学acquiring(1)探测(2)照准(3)瞄准acquisition(1)探测,发现(2)捕获、拦截(3)目标显示acquisition equipment捕获装置actice illumination(1)有源照明(2)主动照明Actinic光化(性)的actinic absorption光化吸收actinic achromatism光化消色差〔性〕Actinic Focus光化焦点Actinic Glass光化玻璃Actinic Radiation光化辐射actinicity(1)光化性(2)光化度actinides铜类元素Actinism光化学actinium(Ac)锕actinochemistry露光化学actinography(1)光能测定仪(2)辐射仪actinology(1)光化学(2)射线化学Actinometer露光计actinometry光能测定术,曝光测定术、光作用测定术actinomorphic辐射对称的actinotherapy射线疗法,放射疗法action(1)作用(2)主动力(3)作用量action photography动态摄影action radius作用半径,有效距离action spectrum作用光谱activate(1)激活、活化(2)起动,触发activated carbon活性碳activated carrier(1)激活载流子(2)激活载体activated silicate glass激活的硅酸盐玻璃activated state激活态,活化态activated switch起动开关activating agent激化剂,活化剂activation(1)激活、活化(2)激发activation center激活中心activation energy激活能activation fiber(1)激栝纤维(2)主动纤维activation of filament灯丝的激活activation of homing进入自动寻的制导状态,接通归航装置Activator活化计activator atom激活原子active(1)主动(2)有效的(3)有源的(4)激活的active area有效面积;有效显示区域active atom激活原子active autofocusing有效自聚集active caity激活腔active carbon活性碳active current有功电流Active Device有源器件active element有源组件active fibre激活〔光学〕纤维active figure control有效图像控制active imaging system主动成像系统active impurity活性杂质Active Infrared System活动红外线系统active infrared tracking system 主动式红外跟踪系统active interferometer有源干涉仪active ion激活离子Active Layer放射层active level激活能级active material激活材料,放射材料Active Medium活性介质active mode-locking主动锁模active network有源网络Active Optical Fiber激活光纤Active Optics主动光件active oxygen活性氧active power有功功率active pulse interferometer主动脉冲干涉仪Active Region放射区active resonator有源共振器active-device有源器件actively mode-locked Nd glass laser主动锁模钕玻离激光器Activity放射性活度,活性activity coefficient激活系数acton(An)锕射气actual image point实际像点actual temperature真实温度actuate作用,开动actuating motor伺服电动机actuating signal作用信号actuation(1)激励(2)起动,传动actuator(1)执行机构、执行组件(2)传运机构(3)激励器acuity锐度,敏度acuity for defocus散焦锐度Acuity, Visual视觉敏锐度Acutance锐度acute angle锐角Acute Bisectrix敏锐二等分角acute exposure短时间强照射acute irradiation急性辐射acuteness锐度adamantine spar刚玉adaptability适应性,适用性Adaptation视觉调整adapter(1)转接器(2)接合器(3)适配器adapter lens接合器透镜adapter sleeve紧定套,接头套〔筒〕,连接套管adaption自适应,配合,匹配adaption brightness自适应亮度adaption level自适应能级adaptive control自适应控制adaptive filter自适应滤光片adaptive laser resonator自适应激光共振器adaptive optical system自适应光学系统Adaptive Optics调适形光件Adaptometer视觉调整计Adaptometer (biophotometer)眼适应时间计adaxial向轴的,近轴的add加,附加addend(1)加数(2)附加物addendum(1)齿顶,齿顶高(2)附录addendum angle(1)齿顶角(伞齿轮的) addendum circle齿顶圆adder(1)加法器,相加器(2)加法电路adder-subtractor加减器addition(1)加,加法(2)附加,补充addition of diffraction patterns衍射图形迭加addition of modes模迭加addition of optical fields光学场迭加addition of wavefronts波阵面迭加,波前迭加additional mirror附加镜additional wave相加波,附加波additive添加物添加剂additive channel可加信道Additive Color Mixing光彩混合Additive Color Process增色处理additive colour加色additive complementary colors〔加色混色的〕补色additive filter附加滤光片additive mixture of colours加色混合additive noise相加噪声additive primaries加色混合的原色additive process加色法additivity相加性,迭加性Additivity of Luminance亮度迭加Address资料储位address hologram地址全息图address read wire地址读出线address write wire地址写入线Addressability安排数据储位的能力Addressability Measure可寻址量度addressable可寻址的addressable memory可寻址存储器Addressable Point可寻址点addressable register可寻址寄存器,可编址寄存器addressing寻址adele赋值矢量adherenceadhesion(1)附着,粘附(2)附着力,粘附力adhesive(1)附着的(2)粘附度adhesive power附着力Adhesives附着剂adiabatic绝热的adiabatic approximation绝热近似〔法〕adiabatic demagnetization 绝热热磁adiabatic ionizationenergy绝热电离能量Adiabatic Laser Colorimetry 绝对雷射色度学adiabatic polarization procedure绝热极化处理Adiabatic Process绝热过程adiabatics绝热曲线adiactinic绝射的,不透光的adiathermanous绝热的,不透红外线的adjacency邻接adjacency effect邻〔接〕效应adjacent agle邻角adjacent resonance相邻信道共振adjacent wave邻波adjoint伴〔随〕可调节的,可调整的,可校准的adjustable angle square活动角尺adjustable bearing可调轴承adjustable bench level可调台式水平仪adjustable cup mount可调杯形座adjustable guide bar可调导杆adjustable lever调节杆adjustable micrometer可调千分尺adjustable slit可调〔狭〕缝adjustable wrench活络板头adjuster(1)调节器(2)调准装置adjusting bracket调节架adjusting screw调节螺丝adjustment调准,配准adjustment range调整范围Adjustment, Interpupillary目眼中心距调整admeasure测量,测定admeasuring apparatus测像仪admission放入,接纳,进气admittance(1)光纳(2)导纳admittance matching(1)光纳匹配(2)导纳匹配admixture(1)掺质,混合(2)混合物ADP二氢磷酸氨adsorbability吸附能力adsorbed film吸附膜adsorbed layer吸附层adsorbent吸附剂adsorption吸附〔作用〕,表面吸收adsorption chromatography吸附色谱〔法〕adsorption effect吸附效应adsorption isotherm吸附等温线adsorption spectrometer 吸附分光计adulterated(1)掺杂的,掺假的(2)低劣的advance in path光程提前量advanced camera高级照相机Advanced Research Projects Agency远景研究计划局部(美国) advancer〔相位〕超前补偿器advancing front前沿advancing wave前进波advertiser信号装置,信号器Advisory Committee of the Radioactivity放射性咨询委员会AE camera自动曝光照相机aeolight〔充气冷阴极〕辉光管aeolotropic crystal各向异性晶体aeolotropism各向异性aeration充气,吹风aerial(1)空气的,气体的(2)空中的,航空的aerial array天线阵Aerial Camera航空照相机Aerial Film航空照相胶卷Aerial Mapping航空写像aerial object航空目标,空中物体Aerial Photogrammetry航空照相测量术aerial photographic survey航空照相测量Aerial Photography航空照相Aerial Photoreconnaissance航空照相勘察aerial radioactivity measurement航空放射性测量Aerial Reconnaissance航空勘察Aerial Survey航空测量aerial tuning天线调谐aeriscope超电摄像管,超光电移像管aero-camera航空照相机航空测量图,航空测图仪Aerocartography航测地图aerochronometer航空精密计时仪aerodynamic flow气动流aerodynamic heat transfer 气动热传递aerodynamic〔al〕气体动力〔学〕的,气动的aerograph(1)无线电报机(2)航空气像仪aerographic film航空摄影胶片aerohypsometer高空测高计aeromagnetic survey航空磁测量aeronautics航空学aeronomy高层大气物理学aerophotogrammetric mapping instrument航测制图仪器aerophotogrammetric survey 航空摄影测量aerophotogrammetry航摄测量术aerophotograph航空摄影aerophotographic camera航空摄影机aerophotography航〔空〕摄〔影〕学,航空照相术aerophysical survey航空物理测量aeroplane飞机航测制图仪aeroscope尘埃计,空中观测〔细菌灰尘收检〕器aerosimplex简单投影测图仪Aerosol气悬体,液悬胶体aerosol droplet悬浮微粒aerosol inhomogeneity 气悬体不均匀性aerosol measurement 气悬体测量aerosol particle analysis 气悬微粒分析aerosol scattering气悬散射aerosol single scattering 气悬体单散射aerosol size distribution 气悬体大小分布aerospace航空空间,宇宙空间aerospace industry航空空间工业,航天工业aerosphere〔生理〕大气层aerosurvey航空测量aerosurveying航〔空〕摄〔影〕测量术aerotar航摄镜头aerothermodynamics空气热力学aerothermoelasticity空气热弹性理论Aerotriangulation航空三角测量aerotron三极管aerovelox小型投影测图仪aeschynite易解石aether(1)以太(2)醚aether drift以太漂移AFC system自动频率控制系统affine collineation仿射共线affine transformation仿射变换affinity(1)类似(2)亲合势(3)仿射性affix(1)添加(2)添加物(3)附标Afocal无焦点竹afocal attachment lens附加望远镜头afocal doublet无焦双透镜afocal imaging system无焦成像系统afocal lens无焦透镜afocal zoom telescope连续变倍望远镜after-current余电流after-effect后效After-Image留像after-schock余震afterburner后然室,补燃器Afterglow余辉afterglow period余辉期afterimage余留成像Afterimage flasher影像后闪光器afterpulsing跟随脉冲aftertreatment后处理against moisture防潮against vibration防震against-the-rule astigmatism反常像散agar琼脂agate玛瑙age-hardening时效硬化ageing时效,老化、陈化ageing oven老化炉agent济Agfacolor阿克发彩色(商名) agglomerating烧结aggregate(1)组合〔的〕,集合〔的〕(2)机组aggregate polarization集合偏振,集偏振化agile missile灵巧导弹aging时效,老化,陈化aging of electroluminescence 电致发光老化aging rate老化率(1)搅拌,搅动(2)激发,激励(3)骚动agitator搅拌器aglow灼热〔的〕,发红〔的〕Ahrens polarizing prism阿伦斯偏振棱镜aid设备,仪器aiming瞄准Aiming Circle方位标定仪aiming device瞄准装置aiming point〔测量〕觇点,瞄准点aiming telescope瞄准望远镜air admittance valve进气阀air agitation空气扰动Air Bearing空气承轴air blast(1)气喷净法(2)喷气(3)喷气器air breathing laser (ABL)吸气式激光器,气动光器air bubble气泡air chuck气动卡盘air cleaner空气调节器air damping空气阻尼Air Dose辐射剂量air filter空过滤器air gapair gauge气动量规air knife coating气刀涂胶法air level〔气泡〕水平仪air light(1)〔空气中〕散射光(2)航空信号埃air micrometer气动测微计air photogrammetricsurvey航〔空〕摄〔影〕测量air pollution measurement with lidar 激光〔雷达〕测大气污染air pollution monitoring空气污染临测air pressure gauge气压计air purge空气纯化air reconnaissance camera航空侦察照相机air seal气封air support bag空气承囊(气胎)air transportable sonar机械声纳air vent通风管,通风孔,排气口air 〔borne〕surveying航空测量,航测air-bag support system空气囊支撑系统air-conditioning system空〔气〕调〔节〕装置air-cored空心的,无铁心的air-defence sightingtelescope防空观测望远镜air-filled thermocouple充气温差电偶air-glass reflection空-玻璃界面反射air-glass surface空气-玻璃界面air-in送气,充气air-locked不透气的,气密的air-map航空图,空中摄影地图air-operated controller气动控制气air-out出气,排气air-pad bag空气垫囊air-proof不透气的,密封的air-pump气泵air-scattered空气散射air-spaced double anastigmat (Celor)双分离对称消像散镜头(赛罗镜头)Air-Spaced Doublet中空双合透镜air-survey camera航测照相机air-to-air identification空对空识别air-to-air intercept空对空拦截air-to-air laser ranging空对空激光测距air-to-ground laser rangefinder空对地激光测距离air-to-ground laser ranging 空对地激光测距Air-to-Ground Phototransmission空对地照片传递系统airborne机载的,航空的airborne electromagnetic survey 航空电磁勘探airborne gaseous laser机载气体激光器airborne gravity survey航空重力测量airborne ir imaging机载红外成像airborne irtransmissometer机载红外透射仪airborne laser radar机载激光雷达airborne laser rangefinder机载激光测距仪airborne laser ranger机载激光测距仪airborne laser tracker(ALT)机载激光跟踪器airborne oceanographic lidar system机载海洋激光雷达系统airborne radioactivitysurvey航空放射性测量airborne remote sensing system机载遥感系统airborne television system机载电影系统airbrake空气制动器,减速板airbrush气笔,喷枪aircraft landing lamp飞机着落信标灯Airglow夜光,气辉airglow emissionairglow intensity大气辉光强度airing(1)通气(2)充气(3)起泡沫airload气动负载airphoto(1)航空摄影(2)航摄相片airscoop进气口,进气道airspace(1)空城(2)空隙airtightness气密〔封〕性airway(1)航路(2)通气孔airy(1)空气的(2)通风的Airy Differential Equation 爱礼微分方程式Airy diffraction disc爱里衍射斑Airy diffraction integral 爱里衍射积分Airy diffraction pattern爱里衍射图样Airy disc爱里〔衍射〕Airy Disk爱礼圆盘图Airy disk radius爱里斑半径Airy point爱里〔支援〕点Airy system爱里系统Airy type objective爱里型物镜aisle通道,走廊Al-clad用铝作覆盖层的alabamine (At)艾alarm(1)警报(2)警报器alarm lamp信号灯Albada finder阿尔巴达寻像器,阿尔巴达瞄准器Albedo反照率albedo radiation(1)反照率辐射(2)辐射反射率albedometer反照率计alcohol酒精,乙醇aldehyde乙醛alexanderson altimeter反射高度计,回波测高计Alexandrite翠绿宝石algebra of matrices〔矩〕阵代数algebraic complement代数余子式algebraic expression代数〔表达〕式Algerithm演算algorithm算法algorithmic language算法语言aliaing version重迭变形alias-type transformation图像固定坐标移动之变换Aliasing假像aliasing error(1)混淆误差(2)重迭误差alibi-type transformation坐标固定图像移动之变换旋标装置,准照仪alidade protractor照准仪量角器alienation coefficient不相关系数,相疏系数align(1)列成一行(2)瞄准目标(3)对准,校直(4)定位,定中心Aligned-Cup Method钟罩互夹定心法aligner准直器,校准器Aligning较轴作业Aligning Chuck镜片对心座Aligning Components of PrismAssemblies棱镜定位法aligning interferometer校直干涉仪alignment(1)校直(2)对准(3)排列alignment axicon校直轴锥镜alignment bracket校直轴支架Alignment Bundle校准纤维束alignment by sight目测准直法alignment chart列线图alignment diagram列线图,算图alignment dock校直坞alignment error校直误差,调准误差Alignment Laser校直雷射,校准用雷射alignment of crystal晶体排列alignment spherealignment target对准目标Alignment Telescope校直望远镜,校准用望远镜alignment-telescope bracket校直望远镜托架alive(1)活的(2)通电流的,加电压的alive circuit带电线路alkali〔强〕咸alkali earth metal咸土金属alkali halide卤化咸alkali metal咸金属alkali-antimonides咸金属锑化物alkali-containing glass含咸玻璃alkali-dimer咸二聚物alkali-halide crystal卤化咸晶体alkali-rich glass (crown)纯咸玻璃(冕牌玻璃) alkaline(1)咸性(2)咸的alkaline earth fluoride咸土氟化物alkaline earth metal咸土金属alkaline high energy battery咸性高能电池组alkaline metal咸金属alkaline treatment咸产处理(1)咸性(2)咸度alkyl iodide烷基碘All Optical Communication全光通信all-dielectric multilayers多层全介电膜all-metal全金属all-pass filter全通滤波器all-purpose computer通用计算器all-purpose instrument通用仪器all-purpose telescope通用望远镜all-supersonic纯超声速的all-transistor camera全晶体管照相机all-weather(1)全天候的(2)耐风雨的allegiance(1)结合,耦合(2)通信,联系(3)键allied Fourier integral同源传里叶积分alligation合法,混合法allochroic变色的,非本色的allochromatic义质色的allochromatic colour义质色allochromatic crystal(1)义质光导性晶体(2)义质色晶体allochromaticphotoconductor义质色光电导体allochromatism掺质色性Allochrometic杂质色的Allogyric Birefringence 异旋双折射allomorph同质异晶allomorphism同质异晶体allotment配置,分配、分配额allotriomorphic crystal 不整形晶体allotrope同素异形性allotropic transformation 同素异形变化allotropism同素异形性allotropy同素异形allotter分配器allowable deviation容许偏差,许用偏差allowable error容许误差allowable exposure容许照射,容许曝光allowable stress容许胁强,容许应力allowable transition容许跃迁allowance(1)容限,公差(2)加工余量allowed band容许带,公差带allowed spectrum容许谱allowed spectrum shape 容许能谱形状alloy合金alloy steel合金钢,特殊钢alloy-junction合金结Alloy-Junction Photocell具合金接头之光电池alloy-junction transistor合金结晶体管allyl diglycol carbonate烯丙基双甘油碳酸盐alnico铝镍钴aloxite (Al2O3)(1)熔融氧化铝(人造刚玉磨料)(2)铝砂alpax铝硅合金alpha meterα射线〔强度〕测量计alpha rayα射线alpha-crystalα晶体alpha-ray spectrographα射线摄谱仪alpha-ray spectrometerα射线光谱仪alpha-ray spectrumα射线谱alphabet laser多掺激光器alphanumeric字母体字的Alphanumeric Reader文数字阅读机alphatronα电离真空计,α粒子电离压力计alsimag铝硅镁合金(一种高频绝缘材料)alt-alt telescope mounting卧轴–卧轴型望远镜安装结构alt-azimuth(1)地平经纬仪(2)地平〔式〕装置alt-azimuth telescopemounting卧轴–竖轴型望远镜安装结构Altazimuth望远镜头调整器alternate matrix交错〔矩〕阵alternate partial polarizerfilter交变部分偏振滤光器alternate-line scanning隔行扫瞄alternately dark and bright rings 明暗相间的环alternating current (a.c.)交流电alternating currentamplifier交流放大器alternating current generator交流发电机alternating currentmachine交流机alternating current motor交流发电机alternating current transformer 交流变压器alternating current tube交流〔电子〕管alternating displacement交变位移alternating electromotive force 交变电动势alternating light method两光交换法alternating motion往复运动alternating quantity(1)变量,交变量(2)交错量alternating voltage交流电压alternating-gradientfocusing principle交变陡度聚焦原理alternating-gradient lens交变陡度透镜alternating-gradient magnetic focusing交变陡度磁聚焦alternation交替,变换,交流alternator交流发电机altimeter高度计,测高仪altitude(1)地平纬度(2)高度,海拔altitude circle(1)竖直度盘(2)地平经圈altitude gauge测高计Altman modification阿特曼改进型〔目录〕altrashort pulse超短脉冲alum明矾alum glass明矾晶alumel镍铝锰合金(高温热电偶材料) alumina铝土,矾土alumina borosilicate glass硼硅酸铝玻璃aluminium (AL)铝aluminium alloy铝合金aluminium antimonide锑化铝aluminium arsenide砷化铝aluminium backing铝垫片,铝底座aluminium coating铝膜aluminium foil lamp铝箔灯aluminium mirror coating铝反射膜aluminium oxide氧化铝(Al2O3)aluminium oxide crucible氧化铝坩埚aluminium paint铝涂料,铝涂层,铝〔银灰〕漆aluminium-coated Pyrex镀铝荧光屏aluminium-oxygen group铝氧族Aluminized Cathode-RayTube镀铝阴极射线管aluminized mirror镀铝镜Aluminizing铝化alundum三氧化二铝(Al2O3),刚铝砂(磨料),铝氧粉Alzac method电解光辉法(制造铝反射镜的)Alzac reflector铝制金属反射镜Alzak aluminium铝制金属友射镜AM Dector调富检波Am-cw laser ranging连续波调幅激光测距Am-Pm conversion调幅–调相变换Am-Pm discriminator调幅–调相鉴频器amagat阿马伽(0℃,1大气压下的气体的密度单位。
数字无线通信系统中的调制(英文)

AgilentDigital Modulation in Communications Systems—An IntroductionApplication Note 1298This application note introduces the concepts of digital modulation used in many communications systems today. Emphasis is placed on explaining the tradeoffs that are made to optimize efficiencies in system design.Most communications systems fall into one of three categories: bandwidth efficient, power efficient, or cost efficient. Bandwidth efficiency describes the ability of a modulation scheme to accommodate data within a limited bandwidth. Power efficiency describes the ability of the system to reliably send information at the lowest practical power level.In most systems, there is a high priority on band-width efficiency. The parameter to be optimized depends on the demands of the particular system, as can be seen in the following two examples.For designers of digital terrestrial microwave radios, their highest priority is good bandwidth efficiency with low bit-error-rate. They have plenty of power available and are not concerned with power efficiency. They are not especially con-cerned with receiver cost or complexity because they do not have to build large numbers of them. On the other hand, designers of hand-held cellular phones put a high priority on power efficiency because these phones need to run on a battery. Cost is also a high priority because cellular phones must be low-cost to encourage more users. Accord-ingly, these systems sacrifice some bandwidth efficiency to get power and cost efficiency. Every time one of these efficiency parameters (bandwidth, power, or cost) is increased, another one decreases, becomes more complex, or does not perform well in a poor environment. Cost is a dom-inant system priority. Low-cost radios will always be in demand. In the past, it was possible to make a radio low-cost by sacrificing power and band-width efficiency. This is no longer possible. The radio spectrum is very valuable and operators who do not use the spectrum efficiently could lose their existing licenses or lose out in the competition for new ones. These are the tradeoffs that must be considered in digital RF communications design. This application note covers•the reasons for the move to digital modulation;•how information is modulated onto in-phase (I) and quadrature (Q) signals;•different types of digital modulation;•filtering techniques to conserve bandwidth; •ways of looking at digitally modulated signals;•multiplexing techniques used to share the transmission channel;•how a digital transmitter and receiver work;•measurements on digital RF communications systems;•an overview table with key specifications for the major digital communications systems; and •a glossary of terms used in digital RF communi-cations.These concepts form the building blocks of any communications system. If you understand the building blocks, then you will be able to under-stand how any communications system, present or future, works.Introduction25 5 677 7 8 8 9 10 10 1112 12 12 13 14 14 15 15 16 17 18 19 20 21 22 22 23 23 24 25 26 27 28 29 29 30 311. Why Digital Modulation?1.1 Trading off simplicity and bandwidth1.2 Industry trends2. Using I/Q Modulation (Amplitude and Phase Control) to Convey Information2.1 Transmitting information2.2 Signal characteristics that can be modified2.3 Polar display—magnitude and phase representedtogether2.4 Signal changes or modifications in polar form2.5 I/Q formats2.6 I and Q in a radio transmitter2.7 I and Q in a radio receiver2.8 Why use I and Q?3. Digital Modulation Types and Relative Efficiencies3.1 Applications3.1.1 Bit rate and symbol rate3.1.2 Spectrum (bandwidth) requirements3.1.3 Symbol clock3.2 Phase Shift Keying (PSK)3.3 Frequency Shift Keying3.4 Minimum Shift Keying (MSK)3.5 Quadrature Amplitude Modulation (QAM)3.6 Theoretical bandwidth efficiency limits3.7 Spectral efficiency examples in practical radios3.8 I/Q offset modulation3.9 Differential modulation3.10 Constant amplitude modulation4. Filtering4.1 Nyquist or raised cosine filter4.2 Transmitter-receiver matched filters4.3 Gaussian filter4.4 Filter bandwidth parameter alpha4.5 Filter bandwidth effects4.6 Chebyshev equiripple FIR (finite impulse response) filter4.7 Spectral efficiency versus power consumption5. Different Ways of Looking at a Digitally Modulated Signal Time and Frequency Domain View5.1 Power and frequency view5.2 Constellation diagrams5.3 Eye diagrams5.4 Trellis diagramsTable of Contents332 32 32 33 33 34 3435 35 3637 37 37 38 38 39 39 39 40 41 41 42 434344466. Sharing the Channel6.1 Multiplexing—frequency6.2 Multiplexing—time6.3 Multiplexing—code6.4 Multiplexing—geography6.5 Combining multiplexing modes6.6 Penetration versus efficiency7. How Digital Transmitters and Receivers Work7.1 A digital communications transmitter7.2 A digital communications receiver8. Measurements on Digital RF Communications Systems 8.1 Power measurements8.1.1 Adjacent Channel Power8.2 Frequency measurements8.2.1 Occupied bandwidth8.3 Timing measurements8.4 Modulation accuracy8.5 Understanding Error Vector Magnitude (EVM)8.6 Troubleshooting with error vector measurements8.7 Magnitude versus phase error8.8 I/Q phase error versus time8.9 Error Vector Magnitude versus time8.10 Error spectrum (EVM versus frequency)9. Summary10. Overview of Communications Systems11. Glossary of TermsTable of Contents (continued)4The move to digital modulation provides more information capacity, compatibility with digital data services, higher data security, better quality communications, and quicker system availability. Developers of communications systems face these constraints:•available bandwidth•permissible power•inherent noise level of the systemThe RF spectrum must be shared, yet every day there are more users for that spectrum as demand for communications services increases. Digital modulation schemes have greater capacity to con-vey large amounts of information than analog mod-ulation schemes. 1.1 Trading off simplicity and bandwidthThere is a fundamental tradeoff in communication systems. Simple hardware can be used in transmit-ters and receivers to communicate information. However, this uses a lot of spectrum which limits the number of users. Alternatively, more complex transmitters and receivers can be used to transmit the same information over less bandwidth. The transition to more and more spectrally efficient transmission techniques requires more and more complex hardware. Complex hardware is difficult to design, test, and build. This tradeoff exists whether communication is over air or wire, analog or digital.Figure 1. The Fundamental Tradeoff1. Why Digital Modulation?51.2 Industry trendsOver the past few years a major transition has occurred from simple analog Amplitude Mod-ulation (AM) and Frequency/Phase Modulation (FM/PM) to new digital modulation techniques. Examples of digital modulation include•QPSK (Quadrature Phase Shift Keying)•FSK (Frequency Shift Keying)•MSK (Minimum Shift Keying)•QAM (Quadrature Amplitude Modulation) Another layer of complexity in many new systems is multiplexing. Two principal types of multiplex-ing (or “multiple access”) are TDMA (Time Division Multiple Access) and CDMA (Code Division Multiple Access). These are two different ways to add diversity to signals allowing different signals to be separated from one another.Figure 2. Trends in the Industry62.1 Transmitting informationTo transmit a signal over the air, there are three main steps:1.A pure carrier is generated at the transmitter.2.The carrier is modulated with the informationto be transmitted. Any reliably detectablechange in signal characteristics can carryinformation.3.At the receiver the signal modifications orchanges are detected and demodulated.2.2 Signal characteristics that can be modified There are only three characteristics of a signal that can be changed over time: amplitude, phase, or fre-quency. However, phase and frequency are just dif-ferent ways to view or measure the same signal change. In AM, the amplitude of a high-frequency carrier signal is varied in proportion to the instantaneous amplitude of the modulating message signal.Frequency Modulation (FM) is the most popular analog modulation technique used in mobile com-munications systems. In FM, the amplitude of the modulating carrier is kept constant while its fre-quency is varied by the modulating message signal.Amplitude and phase can be modulated simultane-ously and separately, but this is difficult to gener-ate, and especially difficult to detect. Instead, in practical systems the signal is separated into another set of independent components: I(In-phase) and Q(Quadrature). These components are orthogonal and do not interfere with each other.Figure 3. Transmitting Information (Analog or Digital)Figure 4. Signal Characteristics to Modify2. Using I/Q Modulation to Convey Information72.3 Polar display—magnitude and phase repre-sented togetherA simple way to view amplitude and phase is with the polar diagram. The carrier becomes a frequency and phase reference and the signal is interpreted relative to the carrier. The signal can be expressed in polar form as a magnitude and a phase. The phase is relative to a reference signal, the carrier in most communication systems. The magnitude is either an absolute or relative value. Both are used in digital communication systems. Polar diagrams are the basis of many displays used in digital com-munications, although it is common to describe the signal vector by its rectangular coordinates of I (In-phase) and Q(Quadrature).2.4 Signal changes or modifications inpolar formFigure 6 shows different forms of modulation in polar form. Magnitude is represented as the dis-tance from the center and phase is represented as the angle.Amplitude modulation (AM) changes only the magnitude of the signal. Phase modulation (PM) changes only the phase of the signal. Amplitude and phase modulation can be used together. Frequency modulation (FM) looks similar to phase modulation, though frequency is the controlled parameter, rather than relative phase.Figure 6. Signal Changes or Modifications8One example of the difficulties in RF design can be illustrated with simple amplitude modulation. Generating AM with no associated angular modula-tion should result in a straight line on a polar display. This line should run from the origin to some peak radius or amplitude value. In practice, however, the line is not straight. The amplitude modulation itself often can cause a small amount of unwanted phase modulation. The result is a curved line. It could also be a loop if there is any hysteresis in the system transfer function. Some amount of this distortion is inevitable in any sys-tem where modulation causes amplitude changes. Therefore, the degree of effective amplitude modu-lation in a system will affect some distortion parameters.2.5 I/Q formatsIn digital communications, modulation is often expressed in terms of I and Q. This is a rectangular representation of the polar diagram. On a polar diagram, the I axis lies on the zero degree phase reference, and the Q axis is rotated by 90 degrees. The signal vector’s projection onto the I axis is its “I” component and the projection onto the Q axisis its “Q” component.Figure 7. “I-Q” Format92.6 I and Q in a radio transmitterI/Q diagrams are particularly useful because they mirror the way most digital communications sig-nals are created using an I/Q modulator. In the transmitter, I and Q signals are mixed with the same local oscillator (LO). A 90 degree phase shifter is placed in one of the LO paths. Signals that are separated by 90 degrees are also known as being orthogonal to each other or in quadrature. Signals that are in quadrature do not interfere with each other. They are two independent compo-nents of the signal. When recombined, they are summed to a composite output signal. There are two independent signals in I and Q that can be sent and received with simple circuits. This simpli-fies the design of digital radios. The main advan-tage of I/Q modulation is the symmetric ease of combining independent signal components into a single composite signal and later splitting such a composite signal into its independent component parts. 2.7 I and Q in a radio receiverThe composite signal with magnitude and phase (or I and Q) information arrives at the receiver input. The input signal is mixed with the local oscillator signal at the carrier frequency in two forms. One is at an arbitrary zero phase. The other has a 90 degree phase shift. The composite input signal (in terms of magnitude and phase) is thus broken into an in-phase, I, and a quadrature, Q, component. These two components of the signal are independent and orthogonal. One can be changed without affecting the other. Normally, information cannot be plotted in a polar format and reinterpreted as rectangular values without doing a polar-to-rectangular conversion. This con-version is exactly what is done by the in-phase and quadrature mixing processes in a digital radio. A local oscillator, phase shifter, and two mixers can perform the conversion accurately and efficiently.Figure 8. I and Q in a Practical Radio Transmitter Figure 9. I and Q in a Radio Receiver102.8 Why use I and Q?Digital modulation is easy to accomplish with I/Q modulators. Most digital modulation maps the data to a number of discrete points on the I/Q plane. These are known as constellation points. As the sig-nal moves from one point to another, simultaneous amplitude and phase modulation usually results. To accomplish this with an amplitude modulator and a phase modulator is difficult and complex. It is also impossible with a conventional phase modu-lator. The signal may, in principle, circle the origin in one direction forever, necessitating infinite phase shifting capability. Alternatively, simultaneous AM and Phase Modulation is easy with an I/Q modulator. The I and Q control signals are bounded, but infi-nite phase wrap is possible by properly phasing the I and Q signals.This section covers the main digital modulation formats, their main applications, relative spectral efficiencies, and some variations of the main modulation types as used in practical systems. Fortunately, there are a limited number of modula-tion types which form the building blocks of any system.3.1 ApplicationsThe table below covers the applications for differ-ent modulation formats in both wireless communi-cations and video. Although this note focuses on wireless communica-tions, video applications have also been included in the table for completeness and because of their similarity to other wireless communications.3.1.1 Bit rate and symbol rateTo understand and compare different modulation format efficiencies, it is important to first under-stand the difference between bit rate and symbol rate. The signal bandwidth for the communications channel needed depends on the symbol rate, not on the bit rate.Symbol rate =bit ratethe number of bits transmitted with each symbol 3. Digital Modulation Types and Relative EfficienciesBit rate is the frequency of a system bit stream. Take, for example, a radio with an 8 bit sampler, sampling at 10 kHz for voice. The bit rate, the basic bit stream rate in the radio, would be eight bits multiplied by 10K samples per second, or 80 Kbits per second. (For the moment we will ignore the extra bits required for synchronization, error correction, etc.)Figure 10 is an example of a state diagram of a Quadrature Phase Shift Keying (QPSK) signal. The states can be mapped to zeros and ones. This is a common mapping, but it is not the only one. Any mapping can be used.The symbol rate is the bit rate divided by the num-ber of bits that can be transmitted with each sym-bol. If one bit is transmitted per symbol, as with BPSK, then the symbol rate would be the same as the bit rate of 80 Kbits per second. If two bits are transmitted per symbol, as in QPSK, then the sym-bol rate would be half of the bit rate or 40 Kbits per second. Symbol rate is sometimes called baud rate. Note that baud rate is not the same as bit rate. These terms are often confused. If more bits can be sent with each symbol, then the same amount of data can be sent in a narrower spec-trum. This is why modulation formats that are more complex and use a higher number of states can send the same information over a narrower piece of the RF spectrum.3.1.2 Spectrum (bandwidth) requirementsAn example of how symbol rate influences spec-trum requirements can be seen in eight-state Phase Shift Keying (8PSK). It is a variation of PSK. There are eight possible states that the signal can transi-tion to at any time. The phase of the signal can take any of eight values at any symbol time. Since 23= 8, there are three bits per symbol. This means the symbol rate is one third of the bit rate. This is relatively easy to decode.Figure 10. Bit Rate and Symbol Rate Figure 11. Spectrum Requirements3.1.3 Symbol ClockThe symbol clock represents the frequency and exact timing of the transmission of the individual symbols. At the symbol clock transitions, the trans-mitted carrier is at the correct I/Q(or magnitude/ phase) value to represent a specific symbol (a specific point in the constellation).3.2 Phase Shift KeyingOne of the simplest forms of digital modulation is binary or Bi-Phase Shift Keying (BPSK). One appli-cation where this is used is for deep space teleme-try. The phase of a constant amplitude carrier sig-nal moves between zero and 180 degrees. On an I and Q diagram, the I state has two different values. There are two possible locations in the state dia-gram, so a binary one or zero can be sent. The symbol rate is one bit per symbol.A more common type of phase modulation is Quadrature Phase Shift Keying (QPSK). It is used extensively in applications including CDMA (Code Division Multiple Access) cellular service, wireless local loop, Iridium (a voice/data satellite system) and DVB-S (Digital Video Broadcasting — Satellite). Quadrature means that the signal shifts between phase states which are separated by 90 degrees. The signal shifts in increments of 90 degrees from 45 to 135, –45, or –135 degrees. These points are chosen as they can be easily implemented using an I/Q modulator. Only two I values and two Q values are needed and this gives two bits per symbol. There are four states because 22= 4. It is therefore a more bandwidth-efficient type of modulation than BPSK, potentially twice as efficient.Figure 12. Phase Shift Keying3.3 Frequency Shift KeyingFrequency modulation and phase modulation are closely related. A static frequency shift of +1 Hz means that the phase is constantly advancing at the rate of 360 degrees per second (2 πrad/sec), relative to the phase of the unshifted signal.FSK (Frequency Shift Keying) is used in many applications including cordless and paging sys-tems. Some of the cordless systems include DECT (Digital Enhanced Cordless Telephone) and CT2 (Cordless Telephone 2).In FSK, the frequency of the carrier is changed as a function of the modulating signal (data) being transmitted. Amplitude remains unchanged. In binary FSK (BFSK or 2FSK), a “1” is represented by one frequency and a “0” is represented by another frequency.3.4 Minimum Shift KeyingSince a frequency shift produces an advancing or retarding phase, frequency shifts can be detected by sampling phase at each symbol period. Phase shifts of (2N + 1) π/2radians are easily detected with an I/Q demodulator. At even numbered sym-bols, the polarity of the I channel conveys the transmitted data, while at odd numbered symbols the polarity of the Q channel conveys the data. This orthogonality between I and Q simplifies detection algorithms and hence reduces power con-sumption in a mobile receiver. The minimum fre-quency shift which yields orthogonality of I and Q is that which results in a phase shift of ±π/2radi-ans per symbol (90 degrees per symbol). FSK with this deviation is called MSK (Minimum Shift Keying). The deviation must be accurate in order to generate repeatable 90 degree phase shifts. MSK is used in the GSM (Global System for Mobile Communications) cellular standard. A phase shift of +90 degrees represents a data bit equal to “1,”while –90 degrees represents a “0.” The peak-to-peak frequency shift of an MSK signal is equal to one-half of the bit rate.FSK and MSK produce constant envelope carrier signals, which have no amplitude variations. This is a desirable characteristic for improving the power efficiency of transmitters. Amplitude varia-tions can exercise nonlinearities in an amplifier’s amplitude-transfer function, generating spectral regrowth, a component of adjacent channel power. Therefore, more efficient amplifiers (which tend to be less linear) can be used with constant-envelope signals, reducing power consumption.Figure 13. Frequency Shift KeyingMSK has a narrower spectrum than wider devia-tion forms of FSK. The width of the spectrum is also influenced by the waveforms causing the fre-quency shift. If those waveforms have fast transi-tions or a high slew rate, then the spectrumof the transmitter will be broad. In practice, the waveforms are filtered with a Gaussian filter, resulting in a narrow spectrum. In addition, the Gaussian filter has no time-domain overshoot, which would broaden the spectrum by increasing the peak deviation. MSK with a Gaussian filter is termed GMSK (Gaussian MSK).3.5 Quadrature Amplitude ModulationAnother member of the digital modulation family is Quadrature Amplitude Modulation (QAM). QAM is used in applications including microwave digital radio, DVB-C (Digital Video Broadcasting—Cable), and modems.In 16-state Quadrature Amplitude Modulation (16QAM), there are four I values and four Q values. This results in a total of 16 possible states for the signal. It can transition from any state to any other state at every symbol time. Since 16 = 24, four bits per symbol can be sent. This consists of two bits for I and two bits for Q. The symbol rate is one fourth of the bit rate. So this modulation format produces a more spectrally efficient transmission. It is more efficient than BPSK, QPSK, or 8PSK. Note that QPSK is the same as 4QAM.Another variation is 32QAM. In this case there are six I values and six Q values resulting in a total of 36 possible states (6x6=36). This is too many states for a power of two (the closest power of two is 32). So the four corner symbol states, which take the most power to transmit, are omitted. This reduces the amount of peak power the transmitter has to generate. Since 25= 32, there are five bits per sym-bol and the symbol rate is one fifth of the bit rate. The current practical limits are approximately256QAM, though work is underway to extend the limits to 512 or 1024 QAM. A 256QAM system uses 16 I-values and 16 Q-values, giving 256 possible states. Since 28= 256, each symbol can represent eight bits. A 256QAM signal that can send eight bits per symbol is very spectrally efficient. However, the symbols are very close together and are thus more subject to errors due to noise and distortion. Such a signal may have to be transmit-ted with extra power (to effectively spread the symbols out more) and this reduces power efficiency as compared to simpler schemes.Figure 14. Quadrature Amplitude ModulationCompare the bandwidth efficiency when using256QAM versus BPSK modulation in the radio example in section 3.1.1 (which uses an eight-bit sampler sampling at 10 kHz for voice). BPSK uses80 Ksymbols-per-second sending 1 bit per symbol.A system using 256QAM sends eight bits per sym-bol so the symbol rate would be 10 Ksymbols per second. A 256QAM system enables the same amount of information to be sent as BPSK using only one eighth of the bandwidth. It is eight times more bandwidth efficient. However, there is a tradeoff. The radio becomes more complex and is more susceptible to errors caused by noise and dis-tortion. Error rates of higher-order QAM systems such as this degrade more rapidly than QPSK as noise or interference is introduced. A measureof this degradation would be a higher Bit Error Rate (BER).In any digital modulation system, if the input sig-nal is distorted or severely attenuated the receiver will eventually lose symbol lock completely. If the receiver can no longer recover the symbol clock, it cannot demodulate the signal or recover any infor-mation. With less degradation, the symbol clock can be recovered, but it is noisy, and the symbol locations themselves are noisy. In some cases, a symbol will fall far enough away from its intended position that it will cross over to an adjacent posi-tion. The I and Q level detectors used in the demodulator would misinterpret such a symbol as being in the wrong location, causing bit errors. QPSK is not as efficient, but the states are much farther apart and the system can tolerate a lot more noise before suffering symbol errors. QPSK has no intermediate states between the four corner-symbol locations, so there is less opportunity for the demodulator to misinterpret symbols. QPSK requires less transmitter power than QAM to achieve the same bit error rate.3.6 Theoretical bandwidth efficiency limits Bandwidth efficiency describes how efficiently the allocated bandwidth is utilized or the ability of a modulation scheme to accommodate data, within a limited bandwidth. The table below shows the theoretical bandwidth efficiency limits for the main modulation types. Note that these figures cannot actually be achieved in practical radios since they require perfect modulators, demodula-tors, filter, and transmission paths.If the radio had a perfect (rectangular in the fre-quency domain) filter, then the occupied band-width could be made equal to the symbol rate.Techniques for maximizing spectral efficiency include the following:•Relate the data rate to the frequency shift (as in GSM).•Use premodulation filtering to reduce the occupied bandwidth. Raised cosine filters,as used in NADC, PDC, and PHS, give thebest spectral efficiency.•Restrict the types of transitions.Modulation Theoretical bandwidthformat efficiencylimitsMSK 1bit/second/HzBPSK 1bit/second/HzQPSK 2bits/second/Hz8PSK 3bits/second/Hz16 QAM 4 bits/second/Hz32 QAM 5 bits/second/Hz64 QAM 6 bits/second/Hz256 QAM 8 bits/second/HzEffects of going through the originTake, for example, a QPSK signal where the normalized value changes from 1, 1 to –1, –1. When changing simulta-neously from I and Q values of +1 to I and Q values of –1, the signal trajectory goes through the origin (the I/Q value of 0,0). The origin represents 0 carrier magnitude. A value of 0 magnitude indicates that the carrier amplitude is 0 for a moment.Not all transitions in QPSK result in a trajectory that goes through the origin. If I changes value but Q does not (or vice-versa) the carrier amplitude changes a little, but it does not go through zero. Therefore some symbol transi-tions will result in a small amplitude variation, while others will result in a very large amplitude variation. The clock-recovery circuit in the receiver must deal with this ampli-tude variation uncertainty if it uses amplitude variations to align the receiver clock with the transmitter clock. Spectral regrowth does not automatically result from these trajectories that pass through or near the origin. If the amplifier and associated circuits are perfectly linear, the spectrum (spectral occupancy or occupied bandwidth) will be unchanged. The problem lies in nonlinearities in the circuits.A signal which changes amplitude over a very large range will exercise these nonlinearities to the fullest extent. These nonlinearities will cause distortion products. In con-tinuously modulated systems they will cause “spectral regrowth” or wider modulation sidebands (a phenomenon related to intermodulation distortion). Another term which is sometimes used in this context is “spectral splatter.”However this is a term that is more correctly used in asso-ciation with the increase in the bandwidth of a signal caused by pulsing on and off.3.7 Spectral efficiency examples inpractical radiosThe following examples indicate spectral efficien-cies that are achieved in some practical radio systems.The TDMA version of the North American Digital Cellular (NADC) system, achieves a 48 Kbits-per-second data rate over a 30 kHz bandwidth or 1.6 bits per second per Hz. It is a π/4 DQPSK based system and transmits two bits per symbol. The theoretical efficiency would be two bits per second per Hz and in practice it is 1.6 bits per second per Hz.Another example is a microwave digital radio using 16QAM. This kind of signal is more susceptible to noise and distortion than something simpler such as QPSK. This type of signal is usually sent over a direct line-of-sight microwave link or over a wire where there is very little noise and interference. In this microwave-digital-radio example the bit rate is 140 Mbits per second over a very wide bandwidth of 52.5 MHz. The spectral efficiency is 2.7 bits per second per Hz. To implement this, it takes a very clear line-of-sight transmission path and a precise and optimized high-power transceiver.。
天文学专业词汇英汉对照
absolute energy distribution 绝对能量分布abundance effect 丰度效应angular diameter—redshift relation 角径—红移关系asteroid astrometry 小行星天体测量bursting pulsar (GRO J1744-28 )暴态脉冲星Caliban 天卫十七canonical Big Bang 典型大爆炸Cepheid binary 造父双星CH anomaly CH 反常chromospheric plage 色球谱斑circumnuclear star-forming ring 核周产星环circumstellar astrophysics 星周天体物理CN anomaly CN 反常colliding-wind binary 星风互撞双星collisional de-excitation 碰撞去激发collisional ionization 碰撞电离collision line broadening 碰撞谱线致宽Compton loss 康普顿耗损continuous opacity 连续不透明度coronagraphic camera 日冕照相机coronal active region 日冕活动区cosmic-ray exposure age 宇宙线曝射法年龄count—magnitude relation 计数—星等关系Cousins color system 卡曾斯颜色系统dating method 纪年法DDO color system DDO 颜色系统deep sky object 深空天体deep sky phenomena 深空天象dense star cluster 稠密星团diagnostics 诊断法dissociative recombination 离解复合Doppler line broadening 多普勒谱线致宽epicyclic orbit 本轮轨道extragalactic background 河外背景extragalactic background radiation 河外背景辐射flare particle emission 耀斑粒子发射flare physics 耀斑物理Fm star Fm 星focal plane spectrometer 焦面分光计focusing X-ray telescope 聚焦X 射线望远镜Friedmann time 弗里德曼时间galactic chimney 星系通道Galactic chimney 银河系通道gas relention age 气体变异法年龄Gauss line profile 高斯谱线轮廓GCR (Galactic cosmic rays )银河系宇宙线Geneva color system 日内瓦颜色系统global oscilletion 全球振荡GW-Vir instability strip 室女GW 不稳定带Highly Advanced Laboratory for 〈HALCA〉通讯和天文高新空间Communications and Astronomy 实验室(HALCA )Hipparcos catalogue 依巴谷星表Hobby-Eberly Telescope (HET )〈HET〉大型拼镶镜面望远镜Hoyle—Narlikar cosmology 霍伊尔—纳里卡宇宙学Hubble Deep Field (HDF )哈勃深空区human space flight 载人空间飞行、人上天imaging spectrograph 成象摄谱仪infrared camera 红外照相机infrared luminosity 红外光度infrared polarimetry 红外偏振测量in-situ acceleration 原位加速intercept age 截距法年龄inverse Compton limit 逆康普顿极限isochron age 等龄线法年龄Johnson color system 约翰逊颜色系统K giant variable (KGV )K 型巨变星kinetic equilibrium 运动学平衡large-scale beam 大尺度射束large-scale jet 大尺度喷流limb polarization 临边偏振line-profile variable 谱线轮廓变星long term fluctuation 长期起伏Lorentz line profile 洛伦兹谱线轮廓magnetic arm 磁臂Mars globe 火星仪massive black hole 大质量黑洞mean extinction coefficient 平均消光系数mean luminosity density 平均光度密度microwave storm 微波噪暴Milli-Meter Array (MMA )〈MMA〉毫米波射电望远镜阵molecular maser 分子微波激射、分子脉泽moving atmosphere 动态大气neutrino loss rate 中微子耗损率non-linear astronomy 非线性天文non-standard model 非标准模型passband width 带宽P Cygni type star 天鹅P 型星Perseus chimney 英仙通道planetary companion 似行星伴天体plateau phase 平台阶段primordial abundance 原始丰度protobinary system 原双星proto-brown dwarf 原褐矮星quiescent galaxy 宁静星系radiation transport 辐射转移radio-intermediate quasar 中介射电类星体random peculiar motion 随机本动relative energy distribution 相对能量分布RGU color system RGU 颜色系统ringed barred galaxy 有环棒旋星系ringed barred spiral galaxy 有环棒旋星系rise phase 上升阶段Rossi X-ray Timing Explorer (RXTE )〈RXTE〉X 射线时变探测器RQPNMLK color system RQPNMLK 颜色系统Scheuer—Readhead hypothesis 朔伊尔—里德黑德假说Serpens molecular cloud 巨蛇分子云soft X-ray transient (SXT )软X 射线暂现源solar dynamo 太阳发电机solar global parameter 太阳整体参数solar neighbourhood 太阳附近空间spectral catalogue 光谱表spectral duplicity 光谱成双性star-formation process 产星过程star-forming phase 产星阶段Stroemgren color system 颜色系统Sub-Millimeter Array (SMA )〈SMA〉亚毫米波射电望远镜阵superassociation 超级星协supermassive black hole 特大质量黑洞supersoft X-ray source 超软X 射线源super-star cluster 超级星团Sycorax 天卫十七symbiotic recurrent nova 共生再发新星synchrotron loss 同步加速耗损time dilation 时间扩展tired-light model 光线老化宇宙模型tremendous outburst amplitude 巨爆幅tremendous outburst amplitude dwarf 巨爆幅矮新星nova (TOAD )Tycho catalogue 第谷星表UBV color system UBV 颜色系统UBVRI color system UBVRI 颜色系统ultraviolet luminosity 紫外光度unrestricted orbit 无限制性轨道uvby color system uvby 颜色系统VBLUW color system VBLUW 颜色系统V enus globe 金星仪Vilnius color system 维尔纽斯颜色系统Virgo galaxy cluster 室女星系团VLBA (Very Long Baseline Array )〈VLBA〉甚长基线射电望远镜阵V oigt line profile 佛克特谱线轮廓VRI color system VRI 颜色系统Walraven color system 沃尔拉文颜色系统waning crescent 残月waning gibbous 亏凸月waxing crescent 娥眉月waxing gibbous 盈凸月WBVR color system WBVR 颜色系统Wood color system 伍德颜色系统zodiacal light photometry 黄道光测光11-year solar cycle 11 年太阳周αCygni variable 天津四型变星δDoradus variable 剑鱼δ型变星Vainu Bappu Observatory 巴普天文台variable-velocity star 视向速度变星vectorial astrometry 矢量天体测量vector-point diagram 矢点图V ega 〈维佳〉行星际探测器V ega phenomenon 织女星现象velocity variable 视向速度变星V enera 〈金星〉号行星际探测器very strong-lined giant, VSL giant 甚强线巨星very strong-lined star, VSL star 甚强线星video astronomy 录象天文viewfinder 寻星镜Viking 〈海盗〉号火星探测器virial coefficient 位力系数virial equilibrium 位力平衡virial radius 位力半径virial temperature 位力温度virtual phase CCD 虚相CCDvisible arm 可见臂visible component 可见子星visual star 光学星VLT, Very Large Telescope 甚大望远镜void 巨洞V ondrak method 冯德拉克方法V oyager 〈旅行者〉号行星际探测器VSOP, VLBI Space Observatory 空间甚长基线干涉测量Programme 天文台计划wave-front sensor 波前传感器weak-line T Tauri star 弱线金牛T 型星Wesselink mass 韦塞林克质量WET, Whole Earth Telescope 全球望远镜WHT, William Herschel Telescope 〈赫歇尔〉望远镜wide-angle eyepiece 广角目镜wide binary galaxy 远距双重星系wide visual binary 远距目视双星Wild Duck cluster (M 11 )野鸭星团Wind 〈风〉太阳风和地球外空磁层探测器WIRE, Wide-field Infrared Explorer 〈WIRE〉广角红外探测器WIYN Telescope, Wisconsin-Indiana- 〈WIYN〉望远镜Yale-NOAO TelescopeWR nebula, Wolf-Rayet nebula WR 星云Wyoming Infrared Telescope 怀俄明红外望远镜xenobiology 外空生物学XMM, X-ray Mirror Mission X 射线成象望远镜X-ray corona X 射线冕X-ray eclipse X 射线食X-ray halo X 射线晕XTE, X-ray Timing Explorer X 射线计时探测器yellow straggler 黄离散星Yohkoh 〈阳光〉太阳探测器young stellar object (YSO )年轻恒星体ZAHB, zero-age horizontal branch 零龄水平支Zanstra temperature 赞斯特拉温度ZZ Ceti star 鲸鱼ZZ 型星γ-ray burster (GRB )γ射线暴源γ-ray line γ谱线γ-ray line astronomy γ谱线天文γ-ray line emission γ谱线发射ζAurigae binary 御夫ζ型双星ζAurigae variable 御夫ζ型变星TAMS, terminal-age main sequence 终龄主序Taurus molecular cloud (TMC )金牛分子云TDT, terrestrial dynamical time 地球力学时television guider 电视导星器television-type detector 电视型探测器Tenma 〈天马〉X 射线天文卫星terrestrial reference system 地球参考系tetrad 四元基thermal background 热背景辐射thermal background radiation 热背景辐射thermal pulse 热脉冲thermonuclear runaway 热核暴涨thick-disk population 厚盘族thinned CCD 薄型CCDthird light 第三光源time-signal station 时号台timing age 计时年龄tomograph 三维结构图toner 调色剂torquetum 赤基黄道仪TRACE, Transition Region and Coronal 〈TRACE〉太阳过渡区和日冕Explorer 探测器tracker 跟踪器transfer efficiency 转移效率transition region line 过渡区谱线trans-Nepturnian object 海外天体Trapezium cluster 猎户四边形星团triad 三元基tri-dimensional spectroscopy 三维分光triquetum 三角仪tuning-fork diagram 音叉图turnoff age 拐点年龄turnoff mass 拐点质量two-dimensional photometry 二维测光two-dimensional spectroscopy 二维分光UKIRT, UK Infrared Telescope Facility 联合王国红外望远镜UKST, UK Schmidt Telescope 联合王国施密特望远镜ultracompact H Ⅱregion 超致密电离氢区ultradeep-field observation 特深天区观测ultraluminous galaxy 超高光度星系ultrametal-poor star 特贫金属星Ulysses 〈尤利西斯〉太阳探测器unseen component 未见子星upper tangent arc 上正切晕弧unnumbered asteroid 未编号小行星Uranian ring 天王星环Ursa Major group 大熊星群Ursa Minorids 小熊流星群Sagittarius dwarf 人马矮星系Sagittarius dwarf galaxy 人马矮星系Sagittarius galaxy 人马星系Saha equation 沙哈方程Sakigake 〈先驱〉空间探测器Saturn-crossing asteroid 越土小行星Saturnian ringlet 土星细环Saturnshine 土星反照scroll 卷滚Sculptor group 玉夫星系群Sculptor Supercluster 玉夫超星系团Sculptor void 玉夫巨洞secondary crater 次级陨击坑secondary resonance 次共振secular evolution 长期演化secular resonance 长期共振seeing management 视宁度控管segregation 层化selenogony 月球起源学separatrice 分界sequential estimation 序贯估计sequential processing 序贯处理serendipitous X-ray source 偶遇X 射线源serendipitous γ-ray source 偶遇γ射线源Serrurier truss 赛路里桁架shell galaxy 壳星系shepherd satellite 牧羊犬卫星shock temperature 激波温度silicon target vidicon 硅靶光导摄象管single-arc method 单弧法SIRTF, Space Infrared Telescope 空间红外望远镜Facilityslitless spectroscopy 无缝分光slit spectroscopy 有缝分光slow pulsar 慢转脉冲星SMM, Solar Maximum MIssion 太阳极大使者SMT, Submillimeter Telescope 亚毫米波望远镜SOFIA, Stratospheric Observatory for 〈索菲雅〉机载红外望远镜Infrared Astronomysoft γ-ray burst repeater 软γ暴复现源soft γrepeater (SGR )软γ射线复现源SOHO, Solar and Heliospheric 〈索贺〉太阳和太阳风层探测器Observatorysolar circle 太阳圈solar oscillation 太阳振荡solar pulsation 太阳脉动solar-radiation pressure 太阳辐射压solar-terrestrial environment 日地环境solitary 孤子性soliton star 孤子星South Galactic Cap 南银冠South Galactic Pole 南银极space density profile 空间密度轮廓space geodesy 空间大地测量space geodynamics 空间地球动力学Spacelab 空间实验室spatial mass segregation 空间质量分层speckle masking 斑点掩模speckle photometry 斑点测光speckle spectroscopy 斑点分光spectral comparator 比长仪spectrophotometric distance 分光光度距离spectrophotometric standard 分光光度标准星spectroscopic period 分光周期specular density 定向密度spherical dwarf 椭球矮星系spin evolution 自旋演化spin period 自旋周期spin phase 自旋相位spiral 旋涡星系spiral arm tracer 示臂天体Spoerer minimum 斯珀勒极小spotted star 富黑子恒星SST, Spectroscopic Survey Telescope 分光巡天望远镜standard radial-velocity star 视向速度标准星standard rotational-velocity star 自转速度标准星standard velocity star 视向速度标准星starburst 星暴starburst galaxy 星暴星系starburst nucleus 星暴star complex 恒星复合体star-formation activity 产星活动star-formation burst 产星暴star-formation efficiency (SFE )产星效率star-formation rate 产星率star-formation region 产星区star-forming region 产星区starpatch 星斑static property 静态特性statistical orbit-determination 统计定轨理论theorysteep-spectrum radio quasar 陡谱射电类星体stellar environment 恒星环境stellar halo 恒星晕stellar jet 恒星喷流stellar speedometer 恒星视向速度仪stellar seismology 星震学Stokes polarimetry 斯托克斯偏振测量strange attractor 奇异吸引体strange star 奇异星sub-arcsec radio astronomy 亚角秒射电天文学Subaru Telescope 昴星望远镜subcluster 次团subclustering 次成团subdwarf B star B 型亚矮星subdwarf O star O 型亚矮星subgiant branch 亚巨星支submilliarcsecond optical astrometry 亚毫角秒光波天体测量submillimeter astronomy 亚毫米波天文submillimeter observatory 亚毫米波天文台submillimeter photometry 亚毫米波测光submillimeter space astronomy 亚毫米波空间天文submillimeter telescope 亚毫米波望远镜submillisecond optical pulsar 亚毫秒光学脉冲星submillisecond pulsar 亚毫秒脉冲星submillisecond radio pulsar 亚毫秒射电脉冲星substellar object 亚恒星天体subsynchronism 亚同步subsynchronous rotation 亚同步自转Sunflower galaxy (M 63 )葵花星系sungrazer comet 掠日彗星supercluster 超星团; 超星系团supergalactic streamer 超星系流状结构supergiant molecular cloud (SGMC )超巨分子云superhump 长驼峰superhumper 长驼峰星supermaximum 长极大supernova rate 超新星频数、超新星出现率supernova shock 超新星激波superoutburst 长爆发superwind galaxy 超级风星系supporting system 支承系统surface activity 表面活动surface-brightness profile 面亮度轮廓surface-channel CCD 表面型CCDSU Ursae Majoris star 大熊SU 型星SW AS, Submillimeter Wave Astronomy 亚毫米波天文卫星Satallitesymbiotic binary 共生双星symbiotic Mira 共生刍藁symbiotic nova 共生新星synthetic-aperture radar 综合孔径雷达systemic velocity 质心速度radial pulsator 径向脉动星radial-velocity orbit 分光解radial-velocity reference star 视向速度参考星radial-velocity standard star 视向速度标准星radial-velocity survey 视向速度巡天radio arm 射电臂radio counterpart 射电对应体radio loud quasar 强射电类星体radio observation 射电观测radio picture 射电图radio pollution 射电污染radio supernova 射电超新星rapid burster 快暴源rapidly oscillating Ap star 快速振荡Ap 星readout 读出readout noise 读出噪声recycled pulsar 再生脉冲星reddened galaxy 红化星系reddened object 红化天体reddened quasar 红化类星体red horizontal branch (RHB )红水平分支red nebulous object (RNO )红色云状体Red Rectangle nebula 红矩形星云redshift survey 红移巡天red straggler 红离散星reflex motion 反映运动regression period 退行周期regular cluster 规则星团; 规则星系团relaxation effect 弛豫效应reset 清零resonance overlap theory 共振重叠理论return-beam tube 回束摄象管richness parameter 富度参数Ring nebula (M 57、NGC 6720 )环状星云ring-plane crossing 环面穿越Rosalind 天卫十三ROSAT, Roentgensatellit 〈ROSAT〉天文卫星Rosette Molecular Cloud (RMC )玫瑰分子云Rossby number 罗斯贝数rotating variable 自转变星rotational evolution 自转演化rotational inclination 自转轴倾角rotational modulation 自转调制rotational period 自转周期rotational phase 自转相位rotational pole 自转极rotational velocity 自转速度rotation frequency 自转频率rotation phase 自转相位rotation rate 自转速率rubber second 负闰秒rubidium-strontium dating 铷锶计年pan 摇镜头parry arc 彩晕弧partial-eclipse solution 偏食解particle astrophysics 粒子天体物理path of annularity 环食带path of totality 全食带PDS, photo-digitizing system、PDS、数字图象仪、photometric data system 测光数据仪penetrative convection 贯穿对流pentaprism test 五棱镜检验percolation 渗流periapse 近质心点periapse distance 近质心距periapsis distance 近拱距perigalactic distance 近银心距perigalacticon 近银心点perimartian 近火点period gap 周期空隙period-luminosity-colour relation 周光色关系PG 1159 star PG 1159 恒星photoflo 去渍剂photographic spectroscopy 照相分光photometric accuracy 测光精度photometric error 测光误差photometric night 测光夜photometric standard star 测光标准星photospheric abundance 光球丰度photospheric activity 光球活动photospheric line 光球谱线planetary biology 行星生物学planetary geology 行星地质学Pleiad 昴团星plerion 类蟹遗迹plerionic remnant 类蟹遗迹plerionic supernova remnant 类蟹超新星遗迹plumbicon 氧化铅光导摄象管pluton 类冥行星p-mode p 模、压力模pointimg accuracy 指向精度point spread function 点扩散函数polarimetric standard star 偏振标准星polarization standard star 偏振标准星polar-ring galaxy 极环星系Portia 天卫十二post AGB star AGB 后恒星post-core-collapse cluster 核心坍缩后星团post-coronal region 冕外区post-main-sequence star 主序后星post red-supergiant 红超巨后星post starburst galaxy 星暴后星系post T Tauri star 金牛T 后星potassium-argon dating 钾氩计年precataclysmic binary 激变前双星precataclysmic variable 激变前变星preceding limb 西边缘、前导边缘precessing-disk model 进动盘模型precession globe 岁差仪precession period 进动周期preflash 预照光pre-main-sequence spectroscopic 主序前分光双星binarypre-planetary disk 前行星盘pre-white dwarf 白矮前身星primary crater 初级陨击坑primordial binary 原始双星principle of mediocrity 折衷原则progenitor 前身星; 前身天体progenitor star 前身星projected density profile 投影密度轮廓proper-motion membership 自行成员星proper reference frame 固有参考架proper reference system 固有参考系proplyd 原行星盘proto-binary 原双星proto-cluster 原星团proto-cluster of galaxies 原星系团proto-earth 原地球proto-galactic cloud 原星系云proto-galactic object 原星系天体proto-Galaxy 原银河系proto-globular cluster 原球状星团proto-Jupiter 原木星proto-planet 原行星proto-planetary disk 原行星盘proto-planetary system 原行星系proto-shell star 原气壳星proto-sun 原太阳pseudo body-fixed system 准地固坐标系Puck 天卫十五pulsar time scale 脉冲星时标pulsation axis 脉动对称轴pulsation equation 脉动方程pulsation frequency 脉动频率pulsation phase 脉动阶段pulsation pole 脉动极pulse light curve 脉冲光变曲线pyrometry 高温测量QPO, quasi-periodic oscillation 似周期振荡quantum cosmology 量子宇宙学quantum universe 量子宇宙quasar astronomy 类星体天文quiescence 宁静态naked-eye variable star 肉眼变星naked T Tauri star 显露金牛T 型星narrow-line radio galaxy (NLRG )窄线射电星系Nasmyth spectrograph 内氏焦点摄谱仪natural reference frame 自然参考架natural refenence system 自然参考系natural seeing 自然视宁度near-contact binary 接近相接双星near-earth asteroid 近地小行星near-earth asteroid belt 近地小行星带near-earth comet 近地彗星NEO, near-earth object 近地天体neon nova 氖新星Nepturian ring 海王星环neutrino astrophysics 中微子天文NNTT, National New Technology Telescope国立新技术望远镜NOAO, National Optical Astronomical 国立光学天文台Observatoriesnocturnal 夜间定时仪nodal precession 交点进动nodal regression 交点退行non-destroy readout (NDRO )无破坏读出nonlinear infall mode 非线性下落模型nonlinear stability 非线性稳定性nonnucleated dwarf elliptical 无核矮椭圆星系nonnucleated dwarf galaxy 无核矮星系nonpotentiality 非势场性nonredundant masking 非过剩遮幅成象nonthermal radio halo 非热射电晕normal tail 正常彗尾North Galactic Cap 北银冠NOT, Nordic Optical Telescope 北欧光学望远镜nova rate 新星频数、新星出现率NTT, New Technology Telescope 新技术望远镜nucleated dwarf elliptical 有核矮椭圆星系nucleated dwarf galaxy 有核矮星系number density profile 数密度轮廓numbered asteroid 编号小行星oblique pulsator 斜脉动星observational cosmology 观测宇宙学observational dispersion 观测弥散度observational material 观测资料observing season 观测季occultation band 掩带O-Ne-Mg white dwarf 氧氖镁白矮星one-parameter method 单参数法on-line data handling 联机数据处理on-line filtering 联机滤波open cluster of galaxies 疏散星系团Ophelia 天卫七optical aperture-synthesis imaging 光波综合孔径成象optical arm 光学臂optical disk 光学盘optical light 可见光optical luminosity function 光学光度函数optically visible object 光学可见天体optical picture 光学图optical spectroscopy 光波分光orbital circularization 轨道圆化orbital eccentricity 轨道偏心率orbital evolution 轨道演化orbital frequency 轨道频率orbital inclination 轨道倾角orbit plane 轨道面order region 有序区organon parallacticon 星位尺Orion association 猎户星协orrery 太阳系仪orthogonal transformation 正交变换oscillation phase 振动相位outer asteroid belt 外小行星带outer-belt asteroid 外带小行星outer halo cluster 外晕族星团outside-eclipse variation 食外变光overshoot 超射OVV quasar, optically violently OVV 类星体variable quasar、optically violent variablevquasaroxygen sequence 氧序Kalman filter 卡尔曼滤波器KAO, Kuiper Air-borne Observatory 〈柯伊伯〉机载望远镜Keck ⅠTelescope 凯克Ⅰ望远镜Keck ⅡTelescope 凯克Ⅱ望远镜Kuiper belt 柯伊伯带Kuiper-belt object 柯伊伯带天体Kuiper disk 柯伊伯盘LAMOST, Large Multi-Object Fibre 大型多天体分光望远镜Spectroscopic TelescopeLaplacian plane 拉普拉斯平面late cluster 晚型星系团LBT, Large Binocular Telescope 〈LBT〉大型双筒望远镜lead oxide vidicon 氧化铅光导摄象管Leo Triplet 狮子三重星系LEST, Large Earth-based Solar 〈LEST〉大型地基太阳望远镜Telescopelevel-Ⅰcivilization Ⅰ级文明level-Ⅱcivilization Ⅱ级文明level-Ⅲcivilization Ⅲ级文明Leverrier ring 勒威耶环Liapunov characteristic number 李雅普诺夫特征数(LCN )light crown 轻冕玻璃light echo 回光light-gathering aperture 聚光孔径light pollution 光污染light sensation 光感line image sensor 线成象敏感器line locking 线锁line-ratio method 谱线比法Liner, low ionization nuclear 低电离核区emission-line regionline spread function 线扩散函数LMT, Large Millimeter Telescope 〈LMT〉大型毫米波望远镜local galaxy 局域星系local inertial frame 局域惯性架local inertial system 局域惯性系local object 局域天体local star 局域恒星look-up table (LUT )对照表low-mass X-ray binary 小质量X 射线双星low-metallicity cluster 低金属度星团;低金属度星系团low-resolution spectrograph 低分辨摄谱仪low-resolution spectroscopy 低分辨分光low - z 小红移luminosity mass 光度质量luminosity segregation 光度层化luminous blue variable 高光度蓝变星lunar atmosphere 月球大气lunar chiaroscuro 月相图Lunar Prospector 〈月球勘探者〉Ly-αforest 莱曼-α森林MACHO (massive compact halo 晕族大质量致密天体object )Magellan 〈麦哲伦〉金星探测器Magellan Telescope 〈麦哲伦〉望远镜magnetic canopy 磁蓬magnetic cataclysmic variable 磁激变变星magnetic curve 磁变曲线magnetic obliquity 磁夹角magnetic period 磁变周期magnetic phase 磁变相位magnitude range 星等范围main asteroid belt 主小行星带main-belt asteroid 主带小行星main resonance 主共振main-sequence band 主序带Mars-crossing asteroid 越火小行星Mars Pathfinder 火星探路者mass loss rate 质量损失率mass segregation 质量层化Mayall Telescope 梅奥尔望远镜Mclntosh classification 麦金托什分类McMullan camera 麦克马伦电子照相机mean motion resonance 平均运动共振membership of cluster of galaxies 星系团成员membership of star cluster 星团成员merge 并合merger 并合星系; 并合恒星merging galaxy 并合星系merging star 并合恒星mesogranulation 中米粒组织mesogranule 中米粒metallicity 金属度metallicity gradient 金属度梯度metal-poor cluster 贫金属星团metal-rich cluster 富金属星团MGS, Mars Global Surveyor 火星环球勘测者micro-arcsec astrometry 微角秒天体测量microchannel electron multiplier 微通道电子倍增管microflare 微耀斑microgravitational lens 微引力透镜microgravitational lensing 微引力透镜效应microturbulent velocity 微湍速度millimeter-wave astronomy 毫米波天文millisecond pulsar 毫秒脉冲星minimum mass 质量下限minimum variance 最小方差mixed-polarity magnetic field 极性混合磁场MMT, Multiple-Mirror Telescope 多镜面望远镜moderate-resolution spectrograph 中分辨摄谱仪moderate-resolution spectroscopy 中分辨分光modified isochrone method 改进等龄线法molecular outflow 外向分子流molecular shock 分子激波monolithic-mirror telescope 单镜面望远镜moom 行星环卫星moon-crossing asteroid 越月小行星morphological astronomy 形态天文morphology segregation 形态层化MSSSO, Mount Stromlo and Siding 斯特朗洛山和赛丁泉天文台Spring Observatorymultichannel astrometric photometer 多通道天测光度计(MAP )multi-object spectroscopy 多天体分光multiple-arc method 复弧法multiple redshift 多重红移multiple system 多重星系multi-wavelength astronomy 多波段天文multi-wavelength astrophysics 多波段天体物理Ida 艾达(小行星243号)IEH, International Extreme Ultraviolet 〈IEH〉国际极紫外飞行器HitchhikerIERS, International Earth Rotation 国际地球自转服务Serviceimage deconvolution 图象消旋image degradation 星象劣化image dissector 析象管image distoration 星象复原image photon counting system 成象光子计数系统image sharpening 星象增锐image spread 星象扩散度imaging polarimetry 成象偏振测量imaging spectrophotometry 成象分光光度测量immersed echelle 浸渍阶梯光栅impulsive solar flare 脉冲太阳耀斑infralateral arc 外侧晕弧infrared CCD 红外CCDinfrared corona 红外冕infrared helioseismology 红外日震学infrared index 红外infrared observatory 红外天文台infrared spectroscopy 红外分光initial earth 初始地球initial mass distribution 初始质量分布initial planet 初始行星initial star 初始恒星initial sun 初始太阳inner coma 内彗发inner halo cluster 内晕族星团integrability 可积性Integral Sign galaxy (UGC 3697 )积分号星系integrated diode array (IDA )集成二极管阵intensified CCD 增强CCDIntercosmos 〈国际宇宙〉天文卫星interline transfer 行间转移intermediate parent body 中间母体intermediate polar 中介偏振星international atomic time 国际原子时International Celestial Reference 国际天球参考系Frame (ICRF )intraday variation 快速变化intranetwork element 网内元intrinsic dispersion 内廪弥散度ion spot 离子斑IPCS, Image Photon Counting System 图象光子计数器IRIS, Infrared Imager / Spectrograph 红外成象器/摄谱仪IRPS, Infrared Photometer / Spectro- 红外光度计/分光计meterirregular cluster 不规则星团; 不规则星系团IRTF, NASA Infrared Telescope 〈IRTF〉美国宇航局红外Facility 望远镜IRTS, Infrared Telescope in Space 〈IRTS〉空间红外望远镜ISO, Infrared Space Observatory 〈ISO〉红外空间天文台isochrone method 等龄线法IUE, International Ultraviolet 〈IUE〉国际紫外探测器ExplorerJewel Box (NGC 4755 )宝盒星团Jovian magnetosphere 木星磁层Jovian ring 木星环Jovian ringlet 木星细环Jovian seismology 木震学jovicentric orbit 木心轨道J-type star J 型星Juliet 天卫十一Jupiter-crossing asteroid 越木小行星Galactic aggregate 银河星集Galactic astronomy 银河系天文Galactic bar 银河系棒galactic bar 星系棒galactic cannibalism 星系吞食galactic content 星系成分galactic merge 星系并合galactic pericentre 近银心点Galactocentric distance 银心距galaxy cluster 星系团Galle ring 伽勒环Galilean transformation 伽利略变换Galileo 〈伽利略〉木星探测器gas-dust complex 气尘复合体Genesis rock 创世岩Gemini Telescope 大型双子望远镜Geoalert, Geophysical Alert Broadcast 地球物理警报广播giant granulation 巨米粒组织giant granule 巨米粒giant radio pulse 巨射电脉冲Ginga 〈星系〉X 射线天文卫星Giotto 〈乔托〉空间探测器glassceramic 微晶玻璃glitch activity 自转突变活动global change 全球变化global sensitivity 全局灵敏度GMC, giant molecular cloud 巨分子云g-mode g 模、重力模gold spot 金斑病GONG, Global Oscillation Network 太阳全球振荡监测网GroupGPS, global positioning system 全球定位系统Granat 〈石榴〉号天文卫星grand design spiral 宏象旋涡星系gravitational astronomy 引力天文gravitational lensing 引力透镜效应gravitational micro-lensing 微引力透镜效应great attractor 巨引源Great Dark Spot 大暗斑Great White Spot 大白斑grism 棱栅GRO, Gamma-Ray Observatory γ射线天文台guidscope 导星镜GW Virginis star 室女GW 型星habitable planet 可居住行星Hakucho 〈天鹅〉X 射线天文卫星Hale Telescope 海尔望远镜halo dwarf 晕族矮星halo globular cluster 晕族球状星团Hanle effect 汉勒效应hard X-ray source 硬X 射线源Hay spot 哈伊斑HEAO, High-Energy Astronomical 〈HEAO〉高能天文台Observatoryheavy-element star 重元素星heiligenschein 灵光Helene 土卫十二helicity 螺度heliocentric radial velocity 日心视向速度heliomagnetosphere 日球磁层helioseismology 日震学helium abundance 氦丰度helium main-sequence 氦主序helium-strong star 强氦线星helium white dwarf 氦白矮星Helix galaxy (NGC 2685 )螺旋星系Herbig Ae star 赫比格Ae 型星Herbig Be star 赫比格Be 型星Herbig-Haro flow 赫比格-阿罗流Herbig-Haro shock wave 赫比格-阿罗激波hidden magnetic flux 隐磁流high-field pulsar 强磁场脉冲星highly polarized quasar (HPQ )高偏振类星体high-mass X-ray binary 大质量X 射线双星high-metallicity cluster 高金属度星团;高金属度星系团high-resolution spectrograph 高分辨摄谱仪high-resolution spectroscopy 高分辨分光high - z 大红移Hinotori 〈火鸟〉太阳探测器Hipparcos, High Precision Parallax 〈依巴谷〉卫星Collecting SatelliteHipparcos and Tycho Catalogues 〈依巴谷〉和〈第谷〉星表holographic grating 全息光栅Hooker Telescope 胡克望远镜host galaxy 寄主星系hot R Coronae Borealis star 高温北冕R 型星HST, Hubble Space Telescope 哈勃空间望远镜Hubble age 哈勃年龄Hubble distance 哈勃距离Hubble parameter 哈勃参数Hubble velocity 哈勃速度hump cepheid 驼峰造父变星Hyad 毕团星hybrid-chromosphere star 混合色球星hybrid star 混合大气星hydrogen-deficient star 缺氢星hydrogenous atmosphere 氢型大气hypergiant 特超巨星Eagle nebula (M 16 )鹰状星云earty cluster 早型星系团early earth 早期地球early planet 早期行星early-stage star 演化早期星early stellar evolution 恒星早期演化early sun 早期太阳earth-approaching asteroid 近地小行星earth-approaching comet 近地彗星earth-approaching object 近地天体earth-crossing asteroid 越地小行星earth-crossing comet 越地彗星earth-crossing object 越地天体earth orientation parameter 地球定向参数earth rotation parameter 地球自转参数eccentric-disk model 偏心盘模型effect of relaxation 弛豫效应Egg nebula (AFGL 2688 )蛋状星云electronographic photometry 电子照相测光elemental abundance 元素丰度elliptical 椭圆星系elliptical dwarf 椭圆矮星系emulated data 仿真数据emulation 仿真encounter-type orbit 交会型轨道enhanced network 增强网络equatorial rotational velocity 赤道自转速度equatorium 行星定位仪equipartition of kinetic energy 动能均分eruptive period 爆发周期Eskimo nebula (NGC 2392 )爱斯基摩星云estimated accuracy 估计精度estimation theory 估计理论EUVE, Extreme Ultraviolet Explorer 〈EUVE〉极紫外探测器Exclamation Mark galaxy 惊叹号星系Exosat 〈Exosat〉欧洲X 射线天文卫星extended Kalman filter 扩充卡尔曼滤波器extragalactic jet 河外喷流extragalactic radio astronomy 河外射电天文extrasolar planet 太阳系外行星extrasolar planetary system 太阳系外行星系extraterrestrial intelligence 地外智慧生物extreme helium star 极端氦星Fabry-Perot imaging spectrograph 法布里-珀罗成象摄谱仪Fabry-Perot interferometry 法布里-珀罗干涉测量Fabry-Perot spectrograph 法布里-珀罗摄谱仪face-on galaxy 正向星系face-on spiral 正向旋涡星系facility seeing 人为视宁度fall 见落陨星fast pulsar 快转脉冲星fat zero 胖零Fermi normal coordinate system 费米标准坐标系Fermi-Walker transportation 费米-沃克移动fibre spectroscopy 光纤分光field centre 场中心field galaxy 场星系field pulsar 场脉冲星filter photography 滤光片照相观测filter wheel 滤光片转盘find 发见陨星finder chart 证认图finderscope 寻星镜first-ascent giant branch 初升巨星支first giant branch 初升巨星支flare puff 耀斑喷焰flat field 平场flat field correction 平场改正flat fielding 平场处理flat-spectrum radio quasar 平谱射电类星体flux standard 流量标准星flux-tube dynamics 磁流管动力学f-mode f 模、基本模following limb 东边缘、后随边缘foreground galaxy 前景星系foreground galaxy cluster 前景星系团formal accuracy 形式精度Foucaultgram 傅科检验图样Foucault knife-edge test 傅科刀口检验fourth cosmic velocity 第四宇宙速度frame transfer 帧转移Fresnel lens 菲涅尔透镜fuzz 展云CAMC, Carlsberg Automatic Meridian 卡尔斯伯格自动子午环Circlecannibalism 吞食cannibalized galaxy 被吞星系cannibalizing galaxy 吞食星系。
血氧仪参考设计

User’s Guide and Test Report TIDA-00311 1 Miniaturized Pulse Oximeter Reference DesignHealthTechABSTRACT The scope of this document is to provide a miniaturized pulse oximeter reference design for high end clinical application. This reference design features AFE4403, TI’s high performance Analog Front End for pulse oximeters, an ultra-low power microcontroller and a highly optimizedintegrated dual light emitting diodes (LED) and photodiode optical sensor. This reference design simplifies and accelerates the pulse oximeter system design while still ensuring the highestquality clinical measurements.Document History VersionDate Author Notes 1.0June 2014 Praveen Aroul First releaseTIDA-003112Contents1Design Summary (4)1.1Design Goal (4)1.2Top Level Architecture (4)2Theory of operation (4)3Circuit Description (8)4Hardware Overview (8)4.1AFE4403 Overview (9)4.1.1Receiver Front end (9)4.1.2Transmit Section (11)4.1.3Clocking and Timing Signal Generation (12)4.1.4Diagnostic mode (14)4.2Optical Sensor (14)4.3Microcontroller (15)5Miniaturized SpO2 reference design Modules (15)5.1DCM03–AFE4403 module pin-outs (16)5.2DCM03–AFE4403–MCU module pin-outs (17)6Verification and Measured Performance (19)6.1Testing conditions (19)6.2Estimation of SpO2 percentage (20)Appendix A. Design Resources (21)Appendix B. Acronyms (22)Appendix C. References (23)FiguresFigure 1: Top Level Architecture(1) (4)Figure 2: Oxygenated versus de-oxygenated blood light absorption of IR and Red (5)Figure 3: Variations in light attenuation by tissue illustrating the rhythmic effect of arterial pulsation (6)Figure 4: Normalization of R and IR wavelengths to remove the effects of variation in the incident light intensity or detector sensitivity (7)Figure 5: Empirical relationship between arterial SaO2 and normalized (R/IR) ratio (8)Figure 6: Functional Block Diagram of AFE4403 (9)Figure 7: TIA block diagram of AFE4403 (10)Figure 8: LED Transmit – H-Bridge Drive (13)Figure 9: LED Transmit – Push-Pull LED Drive (14)Figure 10: DCM03 Optical sensor (15)Figure 11: DCM03-AFE4403 reference module (15)Figure 12: DCM03-AFE4403-MCU reference module (16)Figure 13: Pin positions on the DCM03-AFE4403 module (17)Figure 14: Pin positions on the DCM03-AFE4403-MCU module (18)Figure 15: PPG waveform from the DCM03-AFE4403 reference module (19)TIDA-003113TablesDocument History (1)DCM03-AFE4403 module pin-outs (16)DCM03-AFE4403-MCU module pin-outs (17)TIDA-0031141 Design SummaryTI Reference Designs are mixed-signal solutions created by TI’s experts. Verified designs offer the theory, complete PCB schematic & layout, bill of materials and measured performance of the overall system.1.1 Design GoalThe goal is to provide reference design for building a miniaturized pulse oximeter system.1.2 Top Level ArchitectureThe block diagram shown in Figure 1 gives a top level architecture of the reference design. There are two variations of the reference design modules. The first reference design contains the LED and photodiode optical sensor and the Analog Front End (AFE). The second reference design contains the LED and photodiode optical sensor, Analog Front End (AFE) and the MCU.Figure 1: Top Level Architecture (1)(1)Note: The second reference design contains the MSP430 device.2 Theory of operationThe principle of pulse oximetry revolves around the fact that the arterial component of blood is pulsatile in nature (time varying). So when a LED light is made incident on the human body (for example at a finger), the amount of light that passes through after the attenuation from various components like tissue, artery and veins also has a pulsatile component riding over a constant component. The aim of pulse oximetry is to measure the percentage of oxygenated hemoglobin (HbO 2) to the total hemoglobin (Hb) (oxygenated plus deoxygenated) in the arterial blood – this is referred to as SpO 2. Oxygenated hemoglobin in the blood is distinctively red, whereas deoxygenated hemoglobin in the blood has a characteristic dark blue coloration. The opticalproperty of blood in the visible (i.e. between 400 and 700nm) and near-infrared (i.e. between 700 and 1000nm) spectral regions depends strongly on the amount of O 2 carried by blood.TIDA-003115The method exploits the fact that Hb has a higher optical absorption coefficient in the red region of the spectrum around 660nm compared with HbO 2, as illustrated in Figure 2. On the other hand, in the near-infrared region of the spectrum around 940nm, the optical absorption by Hb is lower compared to HbO 2.At the isobestic wavelength (i.e. 805nm), where the two curves cross over, the absorbance of light is independent of oxygenation level.Figure 3: Oxygenated versus de-oxygenated blood light absorption of IR and Red By doing light measurements at two wavelengths (usually Red and IR) that have dissimilar absorption coefficients to oxygenated and deoxygenated hemoglobin, all the constant components can be cancelled out and the SpO 2 can be calculated in a ratiometric manner. The optical system for SPO2 measurement consists of LEDs that shine the light and aphotodiode that receives the light. There are two types of optical arrangements – transmissive and reflective. In the transmissive case, the photodiode and the LED are placed on opposite sides of the human body part (most commonly the finger), with the photodiode collecting the residual light after absorption from the various components of the body part. In the reflective case, the photodiode and the LED are on the same side and the photodiode collects the light reflected from various depths underneath the skin. Both variations of this reference design is based on the reflective case.The photodiode converts the incident light into an electrical signal proportional to the intensity of the light and the AFE44xx signal chain can be used to condition the signal and digitize it. The signal is referred to as the Photoplethysmogram (PPG) signal and contains the periodicity of the pulse rate. SpO 2 measurements involve using two wavelengths – most commonly Red and IR. The AFE44xx family of devices therefore supports independent control over 2 LEDs.As shown in Figure 3, the magnitude of the PPG signal depends on the amount of blood ejected from the heart with each systolic cycle, the optical absorption of blood, absorption by skin and various tissue components, and the specific wavelengths used to illuminate the vascular tissuebed.TIDA-003116During systole, when the arterial pulsation is at its peak, the volume of blood in the tissueincreases. This additional blood absorbs more light, thus reducing the light intensity which is either transmitted or backscattered.During diastole, less blood is present in the vascular bed, thus increasing the amount of light transmitted or backscattered.The pulsatile part of the PPG signal is considered as the “AC” component, and the non- pulsatile part, resulting mainly from the venous blood, skin and tissue, is referred to as the “DC”component. A deviation in the LED brightness or detector sensitivity can change the intensity of the light detected by the sensor. This dependence on transmitted or backscattered light intensity can be compensated by using a normalization technique where the AC component is divided by the DC component, as given in the equation (1) below:R IR=⎝⎜⎛AC R DC R AC IR DC IR�⎠⎟⎞(1)Thus, the time invariant absorbance due to venous blood or surrounding tissues does not have any effect on the measurement. This normalization is carried out for both the red (R) and the infrared (IR) wavelengths, as shown in Figure 4. The normalized R/IR “ratio of ratios” can then be related empirically to SpO2, as shown in Figure 5. When the ratio is 1, the SpO2 value is about 85%.Figure 4: Variations in light attenuation by tissue illustrating the rhythmic effect of arterialpulsationTIDA-003117Figure 5: Normalization of R and IR wavelengths to remove the effects of variation in theincident light intensity or detector sensitivityMost pulse oximeters measure absorbance at two different wavelengths and are calibrated using data collected from CO-oximeters by empirically looking up a value for SpO 2, giving an estimation of SaO 2 using the empirical relationship given by the Equation (2)SaO 2% = A − B ∙ (R /IR ) (2)where R /IR is based on a normalization where the pulsatile (AC) component is divided by the corresponding non-pulsatile (DC) component for each wavelength, and A and B are linear regression coefficients which are related to the specific absorptions coefficients of Hb and HbO 2. The constants A and B are derived empirically during in-vivo calibration by correlating the ratio calculated by the pulse oximeter against SaO 2 from arterial blood samples by an in vitro oximeter for a large group of subjects. Pulse oximeters read the SaO 2 of the blood accurately enough for clinical use under normal circumstances because they use a calibration curve based on empirical data shown in Figure 5.TIDA-003118Figure 6: Empirical relationship between arterial SaO2 and normalized (R/IR) ratio3 Circuit DescriptionPulse oximeters measure arterial blood oxygen saturation by sensing absorption properties of deoxygenated and oxygenated hemoglobin using various wavelengths of light. A basic meter is comprised of a sensing probe attached to a patient's earlobe, toe, finger or other body locations, depending upon the sensing method (reflection or transmission), and a data acquisition system for the calculation and eventually display of oxygen saturation level, heart rate and/or blood flow.This reference design discusses the methodology to build a miniaturized pulse oximeter system.The design employs reflectance mode photoplethysmography (PPG).High Performance pulse oximetry measurements are achieved by using the AFE4403, a fully Integrated Analog Front End that consists of a low noise receiver channel with an integratedanalog-to-Digital converter, an LED transmit section, diagnostics for sensor and LED faultdetection. Additional components include:•Ultra-low power microcontroller (MCU)•LED and photodiode optical sensor4 Hardware OverviewThe following section describes the reference design by providing detailed information about the Analog Front End and the additional components that complete this reference design.TIDA-0031194.1 AFE4403 OverviewThe AFE4403 is a complete analog front-end (AFE) solution targeted for pulse oximeterapplications. The device consists of a low-noise receiver channel, an LED transmit section, and diagnostics for sensor and LED fault detection. To ease clocking requirements and provide the low-jitter clock to the AFE, an oscillator is also integrated that functions from an external crystal. The device communicates to an external microcontroller or host processor using an SPIinterface. Figure 6 provides a detailed block diagram for the AFE4403. The blocks are described in more detail in the following section.Figure 7: Functional Block Diagram of AFE44034.1.1 Receiver Front endThe device is ideally suited as a front-end for a PPG (photoplethysmography) application. In such an application, the light from the LED is reflected (or transmitted) from (or through) the various components inside the body (such as blood, tissue, and so forth) and are received by the photodiode. The signal received by the photodiode has three distinct components:1. A pulsatile or AC component that arises as a result of the changes in blood volume through the arteries.2. A constant DC signal that is reflected or transmitted from the time invariant components in the path of light. This constant DC component is referred to as the pleth signal.3.Ambient light entering the photodiode.TIDA-0031110The AC component is usually a small fraction of the pleth component, with the ratio referred to as the perfusion index (PI). Thus, the allowed signal chain gain is usually determined by the amplitude of the DC component.The receiver consists of a differential current-to-voltage (I-V) transimpedance amplifier (TIA) that converts the input photodiode current into an appropriate voltage. The feedback resistor of the amplifier (Rf) is programmable to support a wide range of photodiode currents. Available RF values include: 1 MΩ, 500 kΩ, 250 kΩ, 100 kΩ, 50 kΩ, 25 kΩ, and 10 kΩ.The model of the photodiode and the connection to the TIA is shown below:Figure 8: TIA block diagram of AFE4403I in is the signal current generated by the photodiode in response to the incident light and C in is the zero bias capacitance of the photodiode.The current to voltage gain in the TIA is given by:V TIA(diff)=V TIA+−V TIA−= 2∗I in∗R f(3) For example, for a photodiode current of I in= 1 μA and a TIA gain setting of R f = 100 kΩ, the differential output of the TIA is equal to 200 mV. The TIA has an operating range of ±1 V, and the ADC has an input full-scale range of ±1.2 V (the extra margin is to prevent the ADC from saturating while operating the TIA at the fullest output range). Furthermore, because the PPG signal is one-sided, only one half of the full-scale is used. TI recommends operating the device at a DC level that is not more than 50% to 60% of the ADC full-scale. The margin allows for sudden changes in the signal level that might saturate the signal chain if operating too close tofull-scale.The Rf amplifier and the feedback capacitor (Cf) form a low-pass filter for the input signalcurrent. Always ensure that the low-pass filter RC time constant has sufficiently high bandwidth (as shown by Equation 4 below) because the input current consists of pulses. For this reason, the feedback capacitor is also programmable. Available Cf values include: 5 pF, 10 pF, 25 pF,50 pF, 100 pF, and 250 pF. Any combination of these capacitors can also be used.R f∗C f≤Rx Sample Time10(4)The output voltage of the I-V amplifier includes the pleth component (the desired signal) and a component resulting from the ambient light leakage. The I-V amplifier is followed by the second stage, which consists of a current digital-to-analog converter (DAC) that sources the cancellation current and an amplifier that gains up the pleth component alone. The amplifier has fiveprogrammable gain settings: 0 dB, 3.5 dB, 6 dB, 9.5 dB, and 12 dB. The gained-up pleth signal is then low-pass filtered (500-Hz bandwidth) and buffered before driving a 22-bit ADC. Thecurrent DAC has a can cellation current range of 10 μA with 10 steps (1 μA each). The DACvalue can be digitally specified with the SPI interface. Using ambient compensation with theambient DAC allows the DC-biased signal to be centered to near mid-point of the amplifier (±0.9 V). Using the gain of the second stage allows for more of the available ADC dynamic range to be used.The output of the ambient cancellation amplifier is separated into LED2 and LED1 channels.When LED2 is on, the amplifier output is filtered and sampled on capacitor C LED2. Similarly, the LED1 signal is sampled on the C LED1 capacitor when LED1 is on. In between the LED2 andLED1 pulses, the idle amplifier output is sampled to estimate the ambient signal on capacitorsC LED2_amb and C LED1_amb.The sampling duration is termed the receiver (Rx) sample time and is programmable for each signal, independently. The sampling can start after the I-V amplifier output is stable (to account for LED and cable settling times). The Rx sample time is used for all dynamic range calculations;the minimum time recommended is 50 μs. While the AFE4403 can support pulse widths lower than 50 µs, having too low of a pulse width could result in a degraded signal and noise from the photodiode.A single 22-bit ADC converts the sampled LED2, LED1, and ambient signals sequentially. Eachconversion provides a single digital code at the ADC output. The conversions are meant to be staggered so that the LED2 conversion starts after the end of the LED2 sample phase, and so on.Note that four data streams are available at the ADC output (LED2, LED1, ambient LED2, and ambient LED1) at the same rate as the pulse repetition frequency. The ADC is followed by adigital ambient subtraction block that additionally outputs the (LED2 – ambient LED2) and (LED1 – ambient LED1) data values.4.1.2 Transmit SectionThe transmit section integrates the LED driver and the LED current control section with 8-bitresolution.The RED and IR LED reference currents can be independently set. The current source (ILED) locally regulates and ensures that the actual LED current tracks the specified reference. Thetransmitter section uses an internal 0.25-V reference voltage for operation. This referencevoltage is available on the TX_REF pin and must be decoupled to ground with a 2.2-μFcapacitor. The TX_REF voltage is derived from the TX_CTRL_SUP. The TX_REF voltage can be programmed from 0.25 V to 1 V. A lower TX_REF voltage allows a lower voltage to besupported on LED_DRV_SUP. However, the transmitter dynamic range falls in proportion to the voltage on TX_REF. Thus, a TX_REF setting of 0.5 V gives a 6-dB lower transmitter dynamic range as compared to a 1-V setting on TX_REF, and a 6-dB higher transmitter dynamic range as compared to a 0.25-V setting on TX_REF.Note that reducing the value of the band-gap reference capacitor on the BG pin reduces the time required for the device to wake-up and settle. However, this reduction in time is a trade-offbetween wake-up time and noise performance. For example, reducing the value of thecapacitors on the BG and TX_REF pins from 2.2 µF to 0.1µF reduces the wake-up time (from complete power-down) from 1 sec to 100 ms, but results in a few decibels of degradation in the transmitter dynamic range.The minimum LED_DRV_SUP voltage required for operation depends on:•Voltage drop across the LED (VLED),•Voltage drop across the external cable, connector, and any other component in series with the LED (V CABLE), and•Transmitter reference voltage.Two LED driver schemes are supported:•An H-bridge drive for a two-terminal back-to-back LED package. See Figure 8.• A push-pull drive for a three-terminal LED package. See Figure9.4.1.3 Clocking and Timing Signal GenerationThe crystal oscillator generates a master clock signal using an external crystal. In the defaultmode, a divide-by-2 block converts the 8-MHz clock to 4 MHz, which is used by the AFE tooperate the timer modules, ADC, and diagnostics. The 4-MHz clock is buffered and output from the AFE in order to clock an external microcontroller.To enable flexible clocking, the AFE4403 has a clock divider with programmable division ratios.While the default division ratio is divide-by-2, the clock divider can be programmed to selectbetween ratios of 1, 2, 4, 6, 8, or 12. The division ratio should be selected based on the external clock input frequency such that the divided clock has a frequency close to 4 MHz. Whenoperating with an external clock input, the divider is reset based on the RESET signal risingedge.The device supports both external clock mode as well as an internal clock mode with the external crystal. In the external clock mode, an external clock is input on the XIN pin and the device internally generates the internal clock (used by the timing engine and the ADC) by a programmable division ratio. After division, the internal clock should be within the range of 4 MHz to 6 MHz. In internal clock mode, an external crystal (connected between XIN and XOUT) is used to generate the clock.Figure 9: LED Transmit – H-Bridge DriveThe AFE4403 has a timer module that can program the various rising and falling timing edges for the 11 signals.The module uses a single 16-bit counter (running off of the 4-MHz clock) to set the time-base. All timing signals are set with reference to the pulse repetition period (PRP). Therefore, a dedicated compare register compares the 16-bit counter value with the reference value specified in the PRF register. Every time that the 16-bit counter value is equal to the reference value in the PRF register, the counter is reset to 0.For the timing signals, the start and stop edge positions are programmable with respect to the PRF period. Each signal uses a separate timer compare module that compares the counter value with preprogrammed reference values for the start and stop edges. All reference values can be set using the SPI interface. After the counter value has exceeded the stop reference value, the output signal is set. When the counter value equals the stop reference value, the output signal is reset.Figure 10: LED Transmit – Push-Pull LED Drive4.1.4 Diagnostic modeThe device includes diagnostics to detect open or short conditions of the LED and photosensor, LED current profile feedback, and cable on or off detection. The diagnostics module, whenenabled, checks for nine types of faults sequentially. The results of all faults are latched in 11 separate flags. The status of all flags can also be read using the SPI interface.4.2 Optical SensorTo measure the peripheral oxygen saturation, an optical sensor (DCM03) (see Figure 10) which has an integrated Red, IR LEDs and photodiode built in to a single module was used. Themodule has been developed by APMKorea [1]. The module works on the principle of reflective photometry. In reflectance photometry, the LEDs and photodiode are placed on the same plane as the human body part and the photodiode collects the light reflected from various depthsunderneath the skin. The sensor has been designed with optimum separation distance between the LEDs and the photodiode to achieve good quality photoplethysmogram signal.Figure 11: DCM03 Optical sensor4.3 MicrocontrollerIn this reference design (both variations), the microcontroller is used to configure the AFE4403 and process the AFE4403 information. The microcontroller MSP430F5528 is from the TexasInstruments MSP430 family of ultra-low power microcontrollers. The microcontroller architecture, combined with extensive low power modes, is optimized to achieve extended battery life inportable applications.5 Miniaturized SpO2 reference design ModulesThere are two variations of the SpO2 reference design modules. The first reference designcontains the LED and photodiode optical sensor, Analog Front End (AFE) for acquiring andconditioning the PPG signal. The second reference design contains the LED and photodiodesensor, Analog Front End (AFE) for acquiring and conditioning the PPG signal and the MCU for processing the information from the AFE.Figure 11 shows the first reference design module with the AFE and the optical sensor. Thereference design module is small and compact and has the following dimensions 0.393”(9.98mm) x 0.411” (10.44mm).Figure 12: DCM03-AFE4403 reference moduleFigure 12 shows the second reference design module with the AFE, MCU and the opticalsensor. The reference design module is small and compact and has the following dimensions0.609” (15.47mm) x 0.413” (10.49mm).Figure 13: DCM03-AFE4403-MCU reference module5.1 DCM03–AFE4403 module pin-outsThe table below shows the signal names on the DCM03- AFE4403 module pin-outs. Figure 13 shows the pin positions on the DCM03-AFE4403 module.DCM03-AFE4403 module pin-outsPin Number Signal Names1 AFE_VCC2 GND3 AFE_SPI_SOMI4 AFE_SPI_SIMO5 AFE_SPI_CLK6 AFE_DIAG_END7 AFE_XIN8 GND9 AFE_PDNZ10 AFE_ADC_RDY11 AFE_SPI_STE12 AFE_RESETZ13 LED_DRV_GND14 LED_DRV_SUPFigure 14: Pin positions on the DCM03-AFE4403 module5.2 DCM03–AFE4403–MCU module pin-outsThe table below shows the signal names on the DCM03- AFE4403-MCU module pin-outs.Figure 14 shows the pin positions on the DCM03-AFE4403-MCU module.DCM03-AFE4403-MCU module pin-outsPin Number Signal Names1 AFE_VCC2 GND3 No Connect (NC)4 No Connect5 No Connect6 EXT_SPI_STE7 EXT_SPI_SOMI8 EXT_SPI_SIMO9 EXT_SPI_CLK10 GND11 No Connect12 No Connect13 LED_DRV_GND14 LED_DRV_SUP15 JTAG_TDO16 JTAG_TMS17 JTAG_RST18 JTAG_TDI19 JTAG_TCK20 JTAG_TEST21 DVCC22 GNDFigure 15: Pin positions on the DCM03-AFE4403-MCU module6 Verification and Measured PerformanceThis section describes the measurement results of the DCM03-AFE4403 reference module.6.1 Testing conditionsAFE44x0SP02EVM was used to test the DCM03-AFE4403 reference module. The reference module was hard-wired to the MSP430 serial Peripheral Interface (SPI) on the evaluationmodule.Below were the testing conditions:In the reference module, AFE_VCC was set to 3V. LED_DRV_SUP was set to 3.3V.LED_DRV_GND and GND were shorted together. LED current was set to 5mA.Figure 15 shows the PPG waveform captured from the DCM03-AFE4403 reference module.Figure 16: PPG waveform from the DCM03-AFE4403 reference module6.2 Estimation of SpO2 percentageThis section outlines the calculation of SpO2 using PPG signals. The SpO2 estimation relies on the relationship between the baseline value (referred as DC component) to the fluctuation in the signal (referred to as AC component). SpO2 calculation is based on computing the “ratio ofratios” or Pulse Modulation ratio R which is defined as the ratio of AC/DC of red and IR LEDs as mentioned in Section 2.The PPG signal is normally contaminated with noise which could come from various sources like the power supply noise, motion artifact etc. An essential component as part of the datapreprocessing is filtering out the unwanted signal of interest. Since the DC component resides in frequencies below 0.5Hz, a low pass filter with a cutoff frequency of 5Hz can be used for theSpO2 estimation. This filtering stage is left for the user to implement.Here is an example of how to estimate SpO2 percentage based on the sample PPG data from Figure 15.The ratio of ratios R for the sample PPG data is computed below,R=(AC DC)Red(AC DC)IR=4mV(323mV)25mV(920mV)=0.455 (5)The R value is the only variable in the SpO2 estimation. The standard model for computing is defined as follows:SpO2 %=110−R∗25(6)This model is often used in the literature in the context of the medical devices. However, it relies on the calibration curves [2] that are used to make sure that this linear approximation provides a reasonable result.For the sample PPG data, % SpO2 is computed as below,SpO2 %=110−0.455∗25=98.6 %(7)TIDA-0031121Appendix A. Design ResourcesDesign Archive (ZIP File)All design files AFE4403Product Folder AFE4403EVMTools FolderTIDA-0031122Appendix B. AcronymsADC Analog-to-Digital ConverterAFE Analog Front EndDAC Digital-to-Analog ConverterHb HaemoglobinHbO2Oxygenated HaemoglobinLED Light Emitting DiodeMCU Microcontroller UnitPCB Printed Circuit BoardPPG PhotoplethysmographyRX ReceiverSPI Serial Peripheral InterfaceTI Texas InstrumentsTIA Transimpedance AmplifierTIDA-0031123Appendix C. References1./bio-device/reflectance_oximeter4.pdf 2. “A technology overview of the Nellcor OxiMax pulse oximery system,” Nellcor PuritanBennet Inc., 2003IMPORTANT NOTICE FOR TI REFERENCE DESIGNSTexas Instruments Incorporated("TI")reference designs are solely intended to assist designers(“Buyers”)who are developing systems that incorporate TI semiconductor products(also referred to herein as“components”).Buyer understands and agrees that Buyer remains responsible for using its independent analysis,evaluation and judgment in designing Buyer’s systems and products.TI reference designs have been created using standard laboratory conditions and engineering practices.TI has not conducted any testing other than that specifically described in the published documentation for a particular reference design.TI may make corrections,enhancements,improvements and other changes to its reference designs.Buyers are authorized to use TI reference designs with the TI component(s)identified in each particular reference design and to modify the reference design in the development of their end products.HOWEVER,NO OTHER LICENSE,EXPRESS OR IMPLIED,BY ESTOPPEL OR OTHERWISE TO ANY OTHER TI INTELLECTUAL PROPERTY RIGHT,AND NO LICENSE TO ANY THIRD PARTY TECHNOLOGY OR INTELLECTUAL PROPERTY RIGHT,IS GRANTED HEREIN,including but not limited to any patent right,copyright,mask work right, or other intellectual property right relating to any combination,machine,or process in which TI components or services are used. Information published by TI regarding third-party products or services does not constitute a license to use such products or services,or a warranty or endorsement e of such information may require a license from a third party under the patents or other intellectual property of the third party,or a license from TI under the patents or other intellectual property of TI.TI REFERENCE DESIGNS ARE PROVIDED"AS IS".TI MAKES NO WARRANTIES OR REPRESENTATIONS WITH REGARD TO THE REFERENCE DESIGNS OR USE OF THE REFERENCE DESIGNS,EXPRESS,IMPLIED OR STATUTORY,INCLUDING ACCURACY OR COMPLETENESS.TI DISCLAIMS ANY WARRANTY OF TITLE AND ANY IMPLIED WARRANTIES OF MERCHANTABILITY,FITNESS FOR A PARTICULAR PURPOSE,QUIET ENJOYMENT,QUIET POSSESSION,AND NON-INFRINGEMENT OF ANY THIRD PARTY INTELLECTUAL PROPERTY RIGHTS WITH REGARD TO TI REFERENCE DESIGNS OR USE THEREOF.TI SHALL NOT BE LIABLE FOR AND SHALL NOT DEFEND OR INDEMNIFY BUYERS AGAINST ANY THIRD PARTY INFRINGEMENT CLAIM THAT RELATES TO OR IS BASED ON A COMBINATION OF COMPONENTS PROVIDED IN A TI REFERENCE DESIGN.IN NO EVENT SHALL TI BE LIABLE FOR ANY ACTUAL,SPECIAL,INCIDENTAL,CONSEQUENTIAL OR INDIRECT DAMAGES,HOWEVER CAUSED,ON ANY THEORY OF LIABILITY AND WHETHER OR NOT TI HAS BEEN ADVISED OF THE POSSIBILITY OF SUCH DAMAGES,ARISING IN ANY WAY OUT OF TI REFERENCE DESIGNS OR BUYER’S USE OF TI REFERENCE DESIGNS.TI reserves the right to make corrections,enhancements,improvements and other changes to its semiconductor products and services per JESD46,latest issue,and to discontinue any product or service per JESD48,latest issue.Buyers should obtain the latest relevant information before placing orders and should verify that such information is current and complete.All semiconductor products are sold subject to TI’s terms and conditions of sale supplied at the time of order acknowledgment.TI warrants performance of its components to the specifications applicable at the time of sale,in accordance with the warranty in TI’s terms and conditions of sale of semiconductor products.Testing and other quality control techniques for TI components are used to the extent TI deems necessary to support this warranty.Except where mandated by applicable law,testing of all parameters of each component is not necessarily performed.TI assumes no liability for applications assistance or the design of Buyers’products.Buyers are responsible for their products and applications using TI components.To minimize the risks associated with Buyers’products and applications,Buyers should provide adequate design and operating safeguards.Reproduction of significant portions of TI information in TI data books,data sheets or reference designs is permissible only if reproduction is without alteration and is accompanied by all associated warranties,conditions,limitations,and notices.TI is not responsible or liable for such altered rmation of third parties may be subject to additional restrictions.Buyer acknowledges and agrees that it is solely responsible for compliance with all legal,regulatory and safety-related requirements concerning its products,and any use of TI components in its applications,notwithstanding any applications-related information or support that may be provided by TI.Buyer represents and agrees that it has all the necessary expertise to create and implement safeguards that anticipate dangerous failures,monitor failures and their consequences,lessen the likelihood of dangerous failures and take appropriate remedial actions.Buyer will fully indemnify TI and its representatives against any damages arising out of the use of any TI components in Buyer’s safety-critical applications.In some cases,TI components may be promoted specifically to facilitate safety-related applications.With such components,TI’s goal is to help enable customers to design and create their own end-product solutions that meet applicable functional safety standards and requirements.Nonetheless,such components are subject to these terms.No TI components are authorized for use in FDA Class III(or similar life-critical medical equipment)unless authorized officers of the parties have executed an agreement specifically governing such use.Only those TI components that TI has specifically designated as military grade or“enhanced plastic”are designed and intended for use in military/aerospace applications or environments.Buyer acknowledges and agrees that any military or aerospace use of TI components that have not been so designated is solely at Buyer's risk,and Buyer is solely responsible for compliance with all legal and regulatory requirements in connection with such use.TI has specifically designated certain components as meeting ISO/TS16949requirements,mainly for automotive use.In any case of use of non-designated products,TI will not be responsible for any failure to meet ISO/TS16949.Mailing Address:Texas Instruments,Post Office Box655303,Dallas,Texas75265Copyright©2014,Texas Instruments Incorporated。
太赫兹时域光谱技术用于老化炸药检测
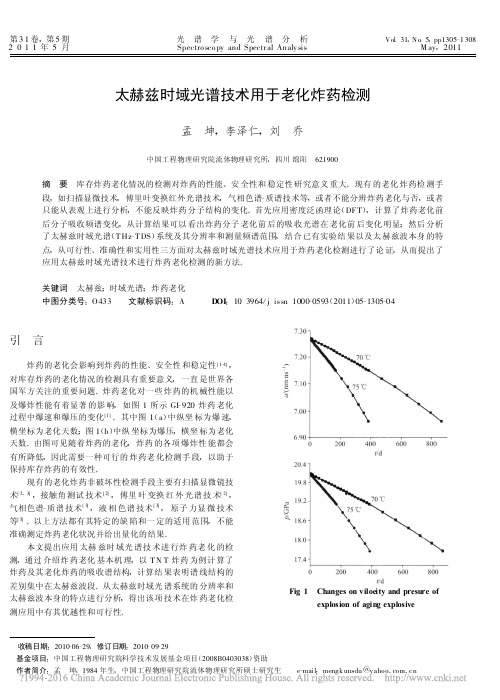
第31卷,第5期 光谱学与光谱分析Vol .31,No .5,pp1305-13082011年5月 Spectro sco py and Spectr al Analy sisM ay ,2011 太赫兹时域光谱技术用于老化炸药检测孟 坤,李泽仁,刘 乔中国工程物理研究院流体物理研究所,四川绵阳 621900摘 要 库存炸药老化情况的检测对炸药的性能、安全性和稳定性研究意义重大。
现有的老化炸药检测手段,如扫描显微技术,傅里叶变换红外光谱技术,气相色谱-质谱技术等,或者不能分辨炸药老化与否,或者只能从表观上进行分析,不能反映炸药分子结构的变化。
首先应用密度泛函理论(DF T ),计算了炸药老化前后分子吸收频谱变化,从计算结果可以看出炸药分子老化前后的吸收光谱在老化前后变化明显;然后分析了太赫兹时域光谱(T Hz -T DS )系统及其分辨率和测量频谱范围,结合已有实验结果以及太赫兹波本身的特点,从可行性、准确性和实用性三方面对太赫兹时域光谱技术应用于炸药老化检测进行了论证,从而提出了应用太赫兹时域光谱技术进行炸药老化检测的新方法。
关键词 太赫兹;时域光谱;炸药老化中图分类号:O 433 文献标识码:A D OI :10.3964/j .issn .1000-0593(2011)05-1305-04 收稿日期:2010-06-29,修订日期:2010-09-29 基金项目:中国工程物理研究院科学技术发展基金项目(2008B0403038)资助作者简介:孟 坤,1984年生,中国工程物理研究院流体物理研究所硕士研究生 e -mail :mengk unsdu @yahoo .com .cn引 言 炸药的老化会影响到炸药的性能、安全性和稳定性[1-4],对库存炸药的老化情况的检测具有重要意义,一直是世界各国军方关注的重要问题。
炸药老化对一些炸药的机械性能以及爆炸性能有着显著的影响,如图1所示GI -920炸药老化过程中爆速和爆压的变化[1]。
音译汉翻译

1 The transistor is what started the evolution of the modern computer industry in motion.晶体管开启了现代电脑工业的革命2 The storage cell only requires one capacitor and one transistor, whereas a flip-flop connected in an array requires 6 transistors.存储单元仅需要一个电容和晶体管,并而不像触发器整列那样需要6个晶体管3 There hase been a never ending series of new op amps released each year since then, and their performance and reliability has improved to the point where present day op amps can be used for analog applications by anybody.从此以后每年都有新系列的运放发布,他们的性能和可靠性得到了提升,如今任何人都能用运放来设计模拟电路。
4 This is capable of very high speed conversion and thus can accommodate high sampling rates, but in its basic form is very power hungry.它具有高速转换能力,从而能适应高速采样速率,但它的基本形式非常耗电。
5 During the “on” period , energy is being stored within the core material of the inductor in the form of flux.在”on”阶段,能量以涌浪形式存储在电感的核芯材料里面6 The design goal of frequency synthesizers is to replace multiple oscillators in a system, and hence reduce board space and cost.频率合成器的设计目标是取代系统中多个振荡器,从而减小板卡面积和成本。
- 1、下载文档前请自行甄别文档内容的完整性,平台不提供额外的编辑、内容补充、找答案等附加服务。
- 2、"仅部分预览"的文档,不可在线预览部分如存在完整性等问题,可反馈申请退款(可完整预览的文档不适用该条件!)。
- 3、如文档侵犯您的权益,请联系客服反馈,我们会尽快为您处理(人工客服工作时间:9:00-18:30)。
a rXiv:as tr o-ph/17548v128J ul21USA Observation of Spectral and Timing Evolution During the 2000Outburst of XTE J1550−564K.T.Reilly 1,E.D.Bloom,W.Focke,B.Giebels,G.Godfrey,P.M.Saz Parkinson,G.Shabad Stanford Linear Accelerator Center,Stanford University,Stanford,CA 94309P.S.Ray 2,R.M.Bandyopadhyay 3,K.S.Wood,M.T.Wolff,G.G.Fritz,P.Hertz 4,M.P.Kowalski,M.N.Lovellette,D.J.Yentis E.O.Hulburt Center for Space Research,Naval Research Laboratory,Washington,DC 20375and Jeffrey D.Scargle Space Science Division,NASA/Ames Research Center,Moffett Field,CA 94305-1000ABSTRACT We report on timing and spectral observations of the 2000outburst of XTE J1550−564made by the Unconventional Stellar Aspect (USA)Experiment on board the Advanced Research and Global Observation Satellite (ARGOS).We observe a low-frequency quasi-periodic oscillation (LFQPO)with a centroid frequency that tends to increase with increasing flux and a fractional rms ampli-tude which is correlated with the hardness ratio.The evolution of the hardness ratio (4–16keV/1–4keV)with time and source flux is examined.The hardness-intensity diagram (HID)shows a cyclical movement in the clockwise direction and possibly indicates the presence of two independent accretion flows.We ob-serve a relationship between the USA 4–16keV count rate and radio observations and discuss this in the context of previously observed correlations between X-ray,radio,optical and IR data.We examine our results in the context of models invoking two accretion flows:a thin disk and a hot sub-Keplerian flow.1.IntroductionXTE J1550−564wasfirst observed in1998September by the All Sky Monitor(ASM) on board the Rossi X-ray Timing Explorer(RXTE)when it began an outburst lasting approximately8months(Smith1998).XTE J1550−564began a second outburst on2000 April2(Masetti&Soria2000),lasting approximately2months.The source was detected for a third time in2001January but did not go into a full outburst(Tomsick et al.2001b; Jain et al.2001).Recent optical observations of XTE J1550−564have placed a lower limit of7.4±0.7M⊙on the mass of the compact object(Orosz et al.2001).This mass places the compact object well above the maximum mass for a stable neutron star and so provides compelling evidence that XTE J1550−564contains a black hole.During its1998–1999outburst,apparent super-luminal radio jets(v>2c)were observed by Hannikainen et al.(2001);however,the jet’s angle to the line of sight has not yet been determined.Radio and optical observations of the 2000outburst also show evidence of jet formation(Corbel et al.2001;Jain et al.2001).Complex timing and spectral behavior has been observed by RXTE in XTE J1550−564 during its two full outbursts.This behavior includes detections of three classes of low-frequency quasi-periodic oscillations(LFQPO)(<20Hz)and several detections of high frequency QPOs(HFQPO)(>100Hz)(Remillard et al.2001;Miller et al.2001;Kalemci et al.2001).Further,color-color diagrams and hardness intensity diagrams of the1998–1999outburst showed separate spectral branches for each of the black hole states as well as correlations with quasi-periodic oscillations and other timing behavior(Homan et al.2001).During the1998–1999outburst,XTE J1550−564exhibited all four identified black hole spectral states(Sobczak et al.2000;Homan et al.2000).In the2000outburst the source never achieved the high state(HS),going from an initial low/hard state(LS)to an interme-diate state(IS)or a very high state(VHS)and returning to afinal LS(Miller et al.2001). Although previous authors have made a distinction between the IS and VHS,recent work on XTE J1550−564has suggested that the IS and VHS are actually the same state at dif-ferent X-rayflux levels(Homan et al.2000).Therefore,for the remainder of this paper we will refer to this state as the IS.The transition from the initial LS to the IS was made on 2000April26(MJD51660).The transition from the IS back to the LS occurred sometime between May13(MJD51677)and May19(MJD51623)(Corbel et al.2001).In this Letter,we report on X-ray observations of the2000outburst of XTE J1550−564 made by the Unconventional Stellar Aspect(USA)Experiment on the US Air Force Advanced Research and Global Observation Satellite(ARGOS).For a detailed description of the USA experiment see Ray et al.(1999)and Shabad(2000).We present lightcurves and hardnessratios and track a low frequency QPO which appears in the initial and late stages of the outburst.2.Observations and Data Analysis2.1.Lightcurves and Hardness RatiosThe USA Experiment observed XTE J1550−564at the rate of2–8times per day between 2000April14(MJD51648)and June18(MJD51713).For the present investigation,193 observations were used,from which we selected∼49ks of data obtained in low-background regions.The data are time tagged,having32µs time resolution,and cover an energy range of approximately1–17keV in16pulse height analyzer(PHA)channels.In this work we do not make use of the lowest(channel0)and highest(channel15)PHA channel.We refer to PHA channels1–14(∼1−16keV)as the total range.To create the light curves shown in Figure1,afirst order background subtraction was made by averaging blank sky observations and then subtracting these values from the count rate.To determine the total error,the standard deviation of the average in the background was added in quadrature to the error on the count A data were then corrected for obscuration by the instrument support structure and the collimator response.The overall average light curve(normalized to the USA Crab counting rate)for the total range is shown in panel(a)of Figure1.The circles are RXTE/ASM daily averaged data used to give the complete outburst profile(USA observations did not cover thefirst few days of the outburst). The USA data points shown are an average of several USA observations.The number of observations averaged was dependent on the observation spacing and signal to noise ratio.The spectral characteristics of the outburst were studied by dividing the USA data into two energy bands,USA PHA channels1–3and channels4–14.These two bands correspond to1–4keV and4–16keV,respectively.For the remainder of this Letter these bands will be referred to as the soft band count rate(SB)and the hard band count rate(HB).The motivation for choosing the specific energy ranges of the SB and HB came from properties of the hardness-intensity diagram(HID).During the outburst,XTE J1550−564traces a cyclic pattern in the HID.Plots of count rates versus the total range show this cyclical structure for individual channels in the range4–14,but not for channels1,2or3.Panels(b)and(c)of Figure1show the SB and HB as a function of time during the outburst.The bottom panel of Figure1shows the evolution of hardness ratio using these energy bands.The HID in Figure2shows how the hardness ratio evolves with total count rate during the outburst.The hardness ratio is plotted only for USA data prior to MJD51687,after which the signal to noise decreases to the point that the hardness ratio is not constrained.In Figure2and panel(f)of Figure1,one point is shown for each point in panels(b)and(c)of Figure1.The design of the USA detector incorporated automatic gain stabilization hardware and frequent iron source energy calibrations were done while in orbit.We note that the USA channel to energy conversion varies slightly over the USA orbit;however,checks performed showed that this variation made no significant impact on the relevant features seen in the SB, HB,and hardness ratio.A further check of our spectral results was made by comparing our data to public RXTE/ASM data.Daily averaged ASM data were used tofind the hardness ratio as a function of time and to make a HID.The ASM hardness ratio was calculated by dividing the sum of ASM B Band(3–5keV)and C Band(5–12keV)by A Band(1.5–3keV). To try to emulate the ASM energy bands the USA PHA channels3–11(3–11.5keV)were summed and divided by channel2(2–3keV).The ASM data confirmed the hardness ratio observed with USA and the cyclic behavior in the HID.2.2.Power Spectra:Low Frequency QPOsA low frequency quasi-periodic oscillation(LFQPO)was ubiquitous during the rise of the outburst and during the decay of the outburst after the secondary maximum.In order to track the LFQPO evolution through the outburst,observations were grouped by day and frequently in sub-day groups(signal to noise ratio permitting).Power spectra(see Nowak et al.1999and references therein)were calculated from these groups and averaged.The resultant power spectrum for each group containing a LFQPO wasfit with a power law or broken power law and a Lorentzian for any observable QPO features.Fits were made in three energy bands:the total range,SB,and HB.In case of confusion by sub-harmonics,the strongest QPO feature was chosen as the primary LFQPO (see Remillard et al.2001).In most cases no sub-harmonics were detectable.Panel(d)of Figure1shows how the centroid frequency of the LFQPO evolves during the outburst.The evolution of the rms amplitude for all three energy bands is shown in panel(e).Panels(d) and(e)show error bars calculated by allowing theχ2of thefit to vary by one.All error bars are given at the68%confidence level.3.Results3.1.QPO Evolution and Correlation to State ChangesWe observe LFQPOs between MJD51648and51663and between MJD51675and51686 which vary in frequency between0.24–7.19Hz and6.34–0.64Hz,respectively.During the times of these detections the source is either in the LS or near the transition from one state to another.The LFQPO rms amplitude decreases rapidly at the state transition from the LS to the IS and then increases during the transition back to the LS,indicating that the mechanism for creating the LFQPO is suppressed in the IS.The LFQPO centroid frequency generally increases with increasingflux;the fractional rms amplitude is correlated with hardness ratio (see Figure1).During the IS,significant detections of HFQPOs(249–278Hz)were made by RXTE between between MJD51663and51675(Miller et al.2001).A65Hz QPO has been discovered by Kalemci et al.(2001)at MJD51684.8.These HFQPO detections occurred during the periods where USA observed the LFQPO to be weakening or not detectable at all. It is interesting to note that the HFQPOs were observed to decrease in strength as a function of time in the IS(Miller et al.2001).These observations point to an unfavorable interaction between the mechanisms for LFQPO and HFQPO production.We observe a decline in rms amplitude of the LFQPO near the LS/IS transition,which marks the approximate onset of the HFQPOs.Towards the end of the IS,near the IS/LS transition,the HFQPO weakens as the LFQPO once again becomes detectable.This trend continues in the last days of the outburst,when the LFQPO rms amplitude weakens and the65Hz QPO is detected.These QPO features are qualitatively consistent with observations of XTE J1550−564 during the1998–1999outburst(Remillard et al.2001),during which an“antagonism”between LFQPOs and HFQPOs was also observed.During that outburst,type“C”QPOs were observed when strong correlations were seen between the frequency and diskflux while the amplitude was observed to correlate with disk temperature(Remillard et al.2001). These previous observations closely resemble what we see for the LFQPO observed during the2000outburst;thus we tentatively classify the LFQPO discussed here as a type C.At MJD51661.21an anomalous QPO was detectable exclusively in the HB,in contrast to the primary LFQPO which appears in all energy ranges.In Figure1panel(d),this anomalous QPO is the highest frequency point and is marked with a large unfilled circle near MJD51660.This QPO was detected between the primary LFQPO and its harmonicHz,whereas the primary LFQPO is seen at4.71±0.05Hz and has a frequency of7.19+0.12−0.11and its harmonic is seen at9.75+0.4Hz.−0.353.2.Spectral EvolutionFrom Figure1it is clear that the2000outburst of XTE J1550−564does not follow the canonical fast rise,exponential decay(FRED)outburst as would have been expected prior to the RXTE era.Now,with many more examples of well-observed soft X-ray transient (SXT)outbursts,it has become clear that few outbursts look like pure FREDs,and that the outburst profile can be very different at high energy than at low paring the SB and HB lightcurves in Figure1(b)and(c),the two bands rise approximately in unison,but show very different behavior after the peak.With the exclusion of the secondary maximum the HB light curve shows a nearly symmetric outburst profile,while the SB rapidly rises, then decays approximately linearly.As is often observed in SXTs,the decay returns to its original path after the secondary maximum.In the HID(Figure2),we observe that the difference between the SB and HB lightcurves manifests itself as a cyclic structure that moves with time in a clockwise direction.The HID shows a rapid drop in the hardness ratio as the source enters the IS and a rapid increase as thefinal LS is realized.This type of spectral structure,which has been seen in several other sources(Smith et al.2001),is a consequence of the spectrum being harder during the rise than during the decline.3.3.Multiwavelength CorrelationsMultiwavelength observations of XTE J1550−564during the2000outburst have shown correlations between radio,optical,IR and X-rays.These observations have been compared with similar correlations seen in other black-hole candidates(BHCs),such as GX339−4,and have led to the interpretation that the LS of BHCs is characterized by jets and the IS state is characterized by quenching of these jets(Corbel et al.2001).In Figure1,lines1and8 mark the times of optical/IR maxima and lines3and7indicate significant radio detections made by ATCA while line4indicates no significant radio detection.Line6is the time of an optical/IR minimum.(Optical/IR observations were made by YALO;for complete details on the radio and optical/IR observations see Corbel et al.2001and Jain et al.2001). Radio observations by MOST(not shown)made during the initial LS show a detection of 8–15mJy at843MHz(Corbel et al.2001).This indicates that the radio emission prior to line3is more than a factor of50stronger than at the time of the ATCA observation made at line4(Corbel et al.2001).Together,these radio and optical/IR observations have been interpreted(Corbel et al.2001;Jain et al.2001)as evidence for the presence of jets during the initial andfinal A observations indicate that the decline in the HB,during the IS, is associated with a rapid drop in radio emission.The weak radio detection(line3)occurswhile the SB is still very near its maximum and the HB has dropped from its maximum by a factor of∼2and continues on a rapid decline.At the point of no significant radio detection (line4),the HB has greatly reduced its rate of decrease.The return of the radio signal in thefinal LS suggests that the mechanism of jet production is related to but not dependent on HB photon production mechanism.In future outbursts,it would be helpful to obtain a much more thorough radio coverage in order to pin down the nature of the relationship between the HB and jet quenching.4.Discussion:Two Flow ModelsThe different behavior of the HB and SB lightcurves,together with the lack of a strict correlation between the QPO frequency and sourceflux,suggest a scenario involving a two component accretionflow.Models invoking two independent accretionflows have been described by Chakrabarti&Titarchuk(1995)and Smith et al.(2001),while van der Klis(2001)presents a model where the two parameters are the instantaneous and time averaged values of a single quantity.Whether the two accretionflows are dependent or independent,there will be a transition radius at which the Keplerian disk is disrupted and forms a hot sub-Keplerianflow.This innerflow can be an advection-dominated accretionflow(Esin et al.1997)or a postshockflow interior to the radius where two independentflows interact(Chakrabarti&Titarchuk1995). One may then consider models where the LFQPO is related to the Keplerian orbital period at the transition radius(r tr,measured in units of the Schwartzchild radius)between the thin disk and an innerflow.The relationship between the Keplerian orbital period and radius for a7.5M⊙black hole is R=195R Sch P2/3,where R Sch is the Schwartzchild radius and P is the orbital period in seconds.Thus,the LFQPO evolving from∼0.2Hz to∼5Hz could be related to the transition radius changing from∼570R Sch to∼67R Sch.When the disk inner radius gets small enough,Compton cooling becomes important and the hard Comptonized emission is suppressed while the black-body emission from the disk moves into the X-ray band,causing a spectral state transition.This agrees remarkably well with what was observed in this outburst.In order for a twoflow model to explain the spectral characteristics described in§3.2,it should allow for spectral softening to occur while the overall sourceflux is dropping.For two independentflows,this type of spectral evolution occurs because changes in the radialflow may occur on a short(free-fall)timescale,while the effect of changes in the the disk accretion rate are delayed due to viscosity(Chakrabarti&Titarchuk1995;Smith et al.2001).A model of two independentflows was applied to GRS1758−258and1E1740.7−2942by Smithet al.(2001),both of which also showed spectral softening with decreasingfling a dependentflow model,van der Klis(2001)suggests that if the count rate is dominated by the disk accretion rate and the spectral hardness is related to the inner disk radius(which is determined by the time-averaged accretion rate),the same cyclic structure in the HID will result.Recent ideas on the role of jets in microquasars suggest a link between the jet and the corona(see Fender2001and references therein)and provide a theoretical basis for the observed association between the HB and the radio and optical/IR signals(§3.3).This association is suggestive of a mechanism by which jets are created in the LS and quenched in the IS.The LS is associated with a continuous radio-emitting outflow and the presence of the strong LFQPO.At the transition to the IS,discrete radio ejections seem to be common but the continuous jet ceases and the LFQPO mechanism is suppressed.This indicates that both the outflow and the LFQPO are characteristic of the LS and are related to the presence of a hot corona or sub-Keplerianflow.We gratefully acknowledge useful discussions with Lev Titarchuk.We thank Mark Yashar for providing useful references.Work at SLAC was supported by department of Energy contract DE-AC03-76SF00515.Basic research in X-ray Astronomy at the Naval Research Laboratory is supported by ONR/NRL.This work was performed while RMB held a National Research Council Research Associateship Award at NRL.JDS is grateful to the NASA Applied Information Technology Research Program for support.This paper made use of quick-look results provided by the ASM/RXTE team(see ).REFERENCESChakrabarti,S.&Titarchuk,L.G.1995,ApJ,455,623Corbel,S.et al.2001,ApJ,553,in press(astro-ph/0102114)Esin,A.A.,McClintock,J.E.,&Narayan,R.1997,ApJ,489,865Fender,R.2001,Proc.International Symposium on High Energy Gamma-Ray Astronomy, Heidelberg,Eds.F.Aharonian&H.Voelk,2001,AIP,in press,1233 Hannikainen,D.et al.2001,Proc.of the4th INTEGRAL Workshop,Alicante,2070 Homan,J.,Wijnands,R.,van der Klis,M.,Belloni,T.,van Paradijs,J.,Klein-Wolt,M., Fender,R.,&M´e ndez,M.2001,ApJS,132,377Homan,J.et al.2000,ApJ,in press(astro-ph/0001163)Jain,R.K.,Bailyn,C.D.,Orosz,J.A.,McClintock,J.E.,&Remillard,R.A.2001,ApJ, in press(astro-ph/0105115)Jain,R.,Bailyn,C.,&Tomsick,J.2001,IAU Circ.,7575,3Kalemci,E.,Tomsick,J.A.,Rothschild,R.E.,Pottschmidt,K.,&Kaaret,P.2001,ApJ, submitted(astro-ph/0105395)Masetti,N.&Soria,R.2000,IAU Circ.,7399Miller,J.M.et al.2001,ApJ,submitted(astro-ph/0105371)Nowak,M.A.,Vaughan,B.A.,Wilms,J.,Dove,J.B.,&Begelman,M.C.1999,ApJ,510, 874Orosz,J. A.,van der Klis,M.,McClintock,J.,Bailyn,C.,&Remillard,R.2001,The Astronomer’s Telegram,70Ray,P.S.et al.1999,in X-ray Astronomy1999,Bologna,Italy,in press(astro-ph/9911236) Remillard,R.A.,Sobczak,G.J.,Muno,M.P.,&McClintock,J.E.2001,ApJ,submitted, (astro-ph/0105508)Shabad,G.2000,Stanford Ph.D.Thesis,SLAC Report No.562Smith,D.A.1998,IAU Circ.,7008Smith,D.M.,Heindl,W.A.,&Swank,J.H.2001,ApJ,submitted(astro-ph/0103304) Sobczak,G.J.,McClintock,J.E.,Remillard,R.A.,Cui,W.,Levine,A.M.,Morgan,E.H., Orosz,J.A.,&Bailyn,C.D.2000,ApJ,544,993Tomsick,J.A.,Smith,E.,Swank,J.,Wijnands,R.,&Homan,J.2001,IAU Circ.,7575 van der Klis,M.2001,ApJ,in press(astro-ph/0106291)Fig.1.—Time Evolution of XTE J1550−564.(a)USA/ASM Crab normalizedfluxes for the outburst.The circles are ASM daily averaged data taken before USA started observations. ASM error bars are shown but are smaller than the circles.Crosses with error bars are USA data.(b)USA Soft Band count rate(SB),∼1−4keV.(c)USA Hard Band count rate(HB),∼4−16keV.(d)LFQPO centroid frequency.Filled squares show results for the energy range1–16keV.The large unfilled circle shows the frequency of the anomalous HB QPO.(e)LFQPO percent rms amplitude.Filled squares show results for the energy range1–16keV.Filled circles are the HB and the“X”s are the SB.The large unfilled circle marks the anomalous QPO.(f)Hardness ratio(HB/SB).Line2shows the transition between the initial LS and the IS.Line5shows the approximate beginning of the transition period between the IS andfinal LS.Lines3,4and7are the times of ATCA observations.Lines1and8show optical/IR maxima and line6shows an optical/IR minima.–11–Fig. 2.—Hardness Ratio(HB/SB)vs.Total Range Count Rate.Squares are plotted on points in which the LFQPO was detected.Points at which no QPO detection was made only show error bars.The error bars shown are the standard deviation of theflux and the hardness ratio.Arrows plotted between points show the direction of time.The larger outlined arrows mark the start and stop times of USA observations and the time of the secondary maximum. Transitions between states have been marked with the bold circles.。