WIFI throughput test
Readme_TestItem

ItemName= TelnetDUT
CommandLine=
CmdRetry= 1
JudgeString=
JudgeRetry= 5 //telnet循环次数,Sleep(1000)
TimeOut= 1000
//启动待测产品,查看串口信息---------------------------------------
TimeOut= 500
//目前不需此项
[LoadTestFile]
ItemName= LoadTestFile
CommandLine=
CmdRetry= 1
JudgeString=
//串口通讯时找特定字符串时的循环次数。Sleep(500)
//telnet通讯时是输入命令后Sleep时间的循环次数,tftp时Sleep(500),其他Sleep(100)
//串口通讯时找特定字符串时的循环次数。Sleep(500)
//telnet通讯时是输入命令后Sleep时间的循环次数,tftp时Sleep(100)
JudgeRetry= 1
TimeOut= 500
[CheckFlash]
ItemName= CheckFlash
CommandLine=
JudgeString=
JudgeRetry= 1 //没有使用
TimeOut= 500 //没有使用
//连接无线信号---------------------------------------
[ConnectWifi]
ItemName= ConnectWifi
CommandLine=
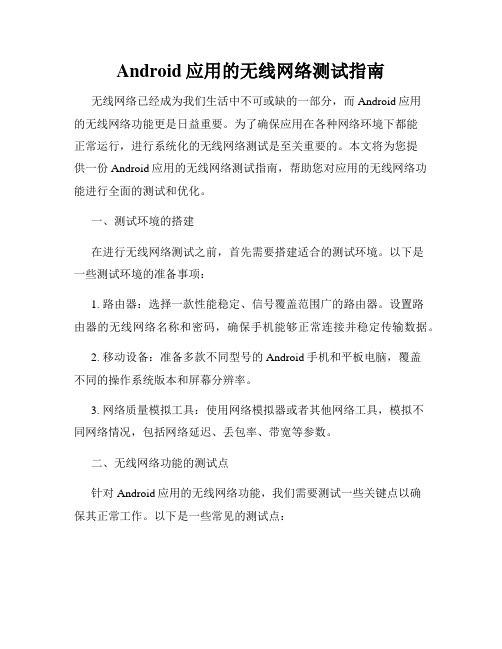
Android应用的无线网络测试指南

Android应用的无线网络测试指南无线网络已经成为我们生活中不可或缺的一部分,而Android应用的无线网络功能更是日益重要。
为了确保应用在各种网络环境下都能正常运行,进行系统化的无线网络测试是至关重要的。
本文将为您提供一份Android应用的无线网络测试指南,帮助您对应用的无线网络功能进行全面的测试和优化。
一、测试环境的搭建在进行无线网络测试之前,首先需要搭建适合的测试环境。
以下是一些测试环境的准备事项:1. 路由器:选择一款性能稳定、信号覆盖范围广的路由器。
设置路由器的无线网络名称和密码,确保手机能够正常连接并稳定传输数据。
2. 移动设备:准备多款不同型号的Android手机和平板电脑,覆盖不同的操作系统版本和屏幕分辨率。
3. 网络质量模拟工具:使用网络模拟器或者其他网络工具,模拟不同网络情况,包括网络延迟、丢包率、带宽等参数。
二、无线网络功能的测试点针对Android应用的无线网络功能,我们需要测试一些关键点以确保其正常工作。
以下是一些常见的测试点:1. 连接稳定性:测试应用在不同网络环境下的连接稳定性,包括WiFi和移动数据网络。
检查应用在弱信号环境下的表现,并观察是否出现连接中断、重连等问题。
2. 响应速度:测量应用在不同网络环境下的响应速度,包括数据请求和接收的时间。
比较在不同网络条件下的响应速度差异,发现潜在的性能瓶颈。
3. 数据传输质量:测试应用在网络传输过程中是否出现数据丢失、错误或者损坏的情况。
检查应用对数据包丢失或错误的处理能力,确保数据的完整性和准确性。
4. 节省流量:测试应用在使用移动数据网络时的流量消耗情况,比较应用在不同网络条件下的流量差异。
优化应用的流量使用,减少用户的流量费用。
5. 多任务处理:测试应用在同时处理多个网络请求时的性能表现,如并发下载、上传、推送通知等情况。
确保应用能够正常处理多个网络任务而不出现卡顿或崩溃。
三、测试工具的选择为了能够准确测试Android应用的无线网络功能,我们需要借助适当的测试工具。
无线通信测试方案MT8862A

8
Quality Assurance of Diverse and Complex Devices
The Wireless Connectivity Test Set MT8862A supports an RF performance measurement environment under realistic operation conditions (Network Mode).
• Bluetooth Low Energy
• WLAN IEEE802.11ac
• LPCWeAllu(LloarRaWAN, etc.)
主な無線システム LTE Cat.M1,
• LTE Cat-M1
NB-IoT
• NBN-IoonT-Cellular
IEEE802.11ac, WLAN 11ac
Universal Wireless Test Set MT8870A
Bluetooth Devices
Bluetooth Test Set MT8852B
Anritsu has solutions for every stage.
6
Universal Wireless Test Set MT8870A
3
Rise of Non-cellular IoT Devices and Diversifying Wireless
Connected devices (billions)
Standards
Increase in non-cellular IoT devices
20
15
Wide-area IoT (30%)
• Packets sent using the IP data TRx ports can also be measured.
WIFI性能测试讲解

WIFI开发及调试细节讲解大纲:第一章WIFI测试内容第二章测试仪器第三章(2.4G/5G)WIFI测试流程(IQ 举例)1.IQ设备基础配置2.发射功率测试TX Power3.发送信号频谱模板测试Transmit Spectrum Mask4.频率误差测试Frequency Error5.矢量误差幅度测试EVM6.频带边缘以及谐波测试Band Edges and Harmonics7.频谱平坦度测试Spectral Flatness8.TX上升/下降时间测试Power On/Off Ramp9.接收灵敏度测试Receiver Sensitivity10.接收最大输入信号电平测试Receiver Maximum input level11.邻道抑制测试Receive Adjacent Channel Rejection12.吞吐量测试Conductive Throughput13.OTA测试第一章WIFI测试内容WIFI测试内容包括:1.发射功率Transmitter Power2.发送信号频谱模板Transmit Spectrum Mask3.频率误差Frequency Error4.矢量误差幅度EVM5.频带边缘以及谐波Band Edges and Harmonics6.频谱平坦度Spectral Flatness7.TX上升/下降时间Power On/Off Ramp8.接收灵敏度Receiver Sensitivity9.接收最大输入信号电平Receiver Maximum input level10.邻道抑制Receive Adjacent Channel Rejection11.吞吐量Conductive Throughput第二章测试仪器WIFI常用测试仪器有:LightPoint公司生产的IQ系列,如IQview/nXn矢量信号分析仪器CMW500功率计第三章(2.4G/5G)WIFI测试流程(IQ 举例)1.IQ设备基础配置及操作步骤:1)通过IE浏览器访问IQxel:需要将控制仪器的PC和IQxel的IP地址设置在同一个网段2)选择Tools界面,再点击Port Routing3)Port Routing对话框点击Pathloss界面:TX Test端口选择VSA;RX Test端口选择VSG.4)选择Pathloss Setup界面:设置频点,线损值;点击Apply并Refresh.2.发射功率测试TX Power1)TX power 规范指标中国及欧洲≤20dBm;日本≤22dBm北美≤30dBm国内指标可理解为:天线增益≤10dBi时,≤100mW(20dBm)天线增益≥10dBi时,≤500mW(27dBm)2)IQ仪器测试举例a)测试Tx test - 11b (DSSS)•仪器操作说明:Settings界面:standards Family选择DSSS(直接序列扩频)备注:Setting页面是设置仪器捕捉波形模式,11b选择DSSS,11a/g/n/ac选择OFDM。
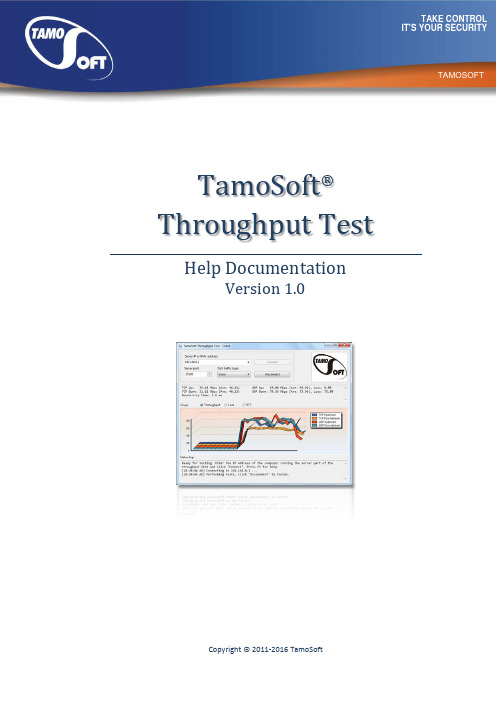
Throughput Test Help Documentation说明书

dfTamoSoft ® Throughput Test Help Documentation Version 1.0Copyright © 2011-2016 TamoSoftContentsContents (2)Introduction (3)Overview (3)System Requirements (3)Installation and Configuration (4)Installation (4)Configuring the Server (4)Configuring the Client (5)Performing the Tests (6)QoS Testing (8)Understanding Your Results (10)Throughput (10)Packet Loss (10)Round-Trip Time (10)Frequently Asked Questions (11)Other Network Analysis Software (12)IntroductionOverviewTamoSoft Throughput Test is a utility for testing the performance of a wireless or wired network. This utility continuously sends TCP and UDP data streams across your network and computes important metrics, such as upstream and downstream throughput values, packet loss, and round-trip time, and displays the results in both numeric and chart formats. TamoSoft Throughput Test supports both IPv4 and IPv6 connections and allows the user to evaluate network performance depending on the Quality of Service (QoS) settings.TamoSoft Throughput Test is free software. It is brought to you by TamoSoft, a software company that develops cutting-edge network monitoring and analysis software for the Internet, LANs, and WLANs, providing clients with the ability and confidence to meet the challenges of tomorrow's technology. System RequirementsTamoSoft Throughput Test can run on computers with the following minimal system requirements: ▪Microsoft Windows: Windows 7, Windows 8, Windows 8.1, Windows 10, Windows Server 2008, Windows Server 2008 R2, Windows Server 2012, Windows Server 2012 R2. Mac OS X: Mavericks(10.9), Yosemite (10.10), El Capitan (10.11), Sierra (10.12). Android (client only): Android 4.1 andnewer.▪ 1 GB of RAM.▪ 5 MB of free disk space.Installation and ConfigurationTo perform a throughput test, the application uses two components: a server and a client. The server part of the application listens for connections from the client, and the client connects to the server. Once the connection has been established, the client and server send data in both directions, and the client part of the application computes and displays the network metrics.InstallationWhen you install the application, both the server and client components are installed. You can then run either one, depending on how you plan to perform the tests. In a WLAN, the server part should be run on the wired side of the network, while the client part should be run on a WLAN client. In this type of a setup, "downstream" would be the data flow from the wired side of the network through the access point to the client, and "upstream" would be the data flow from the client through the access point to the wired side.While this application is intended primarily for testing Wi-Fi network throughput, you can also use it to test wired networks. If you test wired LANs, it's not important which of the two computers acts as a server and which one acts as a client.Configuring the ServerThe server part of the application has only two configurable options: the port on which it listens for incoming connections and the network protocol to be used (IP, also known as IPv4, or IPv6). By default, the server listens on port 27100 and uses IPv4, as shown below:If you want to change the port number or the protocol type, simply make the corresponding changes and click Apply:Configuring the ClientIn the client component, you only need to specify the port number to be used for connecting to the server (if you changed the default port number 27100 on the server side).IMPORTANT: This application automatically creates a Windows firewall rule that allows it to accept connections. If you use a third party firewall, be sure to configure it to allow incoming connections for this application. Both UDP and TCP connections must be allowed.Performing the TestsTo begin throughput testing, you need to launch both the client and server on different computers, as described in the previous chapter. In the client window, enter the IPv4 or IPv6 address of the server and click Connect. The client will attempt to connect to the server, and if the connection is successful, continuous throughput testing will commence. This will continue until you click Disconnect.The client window displays TCP and UDP upstream and downstream throughput values (both current and averaged), loss percentage for UDP streams, and the round-trip time. The same data are illustrated by a dynamically updated chart. The chart can display Throughput, Loss, or RTT values, depending on your selection. Note that the application uses Mbps, i.e. Megabits per second(not Megabytes!) as the measurement unit. Right-clicking on the chart allows you to clear the chart data, copy the chart, save it as a PNG file, or toggle the 3D view on and off. The status log window at the bottom displays messages about the current application status. If you would like to perform TCP tests only, without UDP, check the TCP only box.On Android devices, the interface is organized slightly differently. The first application screen is used for specifying the server IP address and port, while the second screen displays the charts, as shown below:to toggle the 3D view on and off.QoS TestingAdvanced users might want to use the QoS traffic type control to specify the Quality of Service traffic type that will be associated with the TCP and UDP data streams that are sent and received by the application.A description of the use of QoS and related standards and technologies, such as WMM, 802.11e, DSCP, and 802.11p, is beyond the scope of this manual, but in brief, there are two reasons why you may want to use this functionality:▪To check how different QoS traffic types affect throughput. In a properly designed WLAN that uses enterprise-class APs, throughput values for high-priority traffic should exceed those for normal-priority traffic.▪To verify end-to-end QoS network design. In a properly designed WLAN, QoS-tagged traffic must traverse the overall network from the source to the destination through wireless and wired segments with different technology and protocol implementations. When testing this scenario, you should use TamoSoft Throughput Test for generating QoS-tagged traffic, and use packet capture and analysis tools, such as CommView and CommView for WiFi (for wired and wireless LANs, respectively,) to inspect the packets and verify the QoS or DSCP values in the packets. The table below summarizes different QoS traffic types that you can use. Please pay attention to the fact that not all the QoS types available in the application and described below have corresponding WMM access categories. In practice, this means that when you run a TamoSoft Throughput Test on a WLAN client and select a QoS type that has no WMM mapping, your Wi-Fi adapter driver might fail to QoS-tag packets at all.Best Effort Flow traffic has the same network priority as regular traffic not associated withQoS.This traffic type is the same as not specifying priority, and as a result, the DSCPmark and 802.1p tag are not added to sent traffic. Corresponds to the WMMAC-BE access category. On Mac OS X, packets are tagged with Class SelectorCS0.Background Flow traffic has a network priority lower than that of Best Effort. This traffictype could be used for traffic of an application doing data backup.Sent traffic will contain a DSCP mark with a value of 0x08 and an 802.1p tagwith a value of 2. Corresponds to the WMM AC-BK access category. On Mac OSX, packets are tagged with Class Selector CS1.Excellent Effort Flow traffic has a network priority higher than Best Effort, yet lower than AudioVideo.This traffic type should be used for data traffic that is moreimportant than normal end-user scenarios, such as e-mail.Sent traffic will contain a DSCP mark with value of 0x28 and 802.1p tag with avalue of 5. This doesn't correspond to any WMM access category. On Mac OSX, packets are tagged with Class Selector CS2.AudioVideo Flow traffic has a network priority higher than Excellent Effort, yet lower thanVoice. This traffic type should be used for A/V streaming scenarios such asMPEG2 streaming.Sent traffic will contain a DSCP mark with a value of 0x28 and an 802.1p tagwith a value of 5. Corresponds to the WMM AC-VI access category. On Mac OSX, packets are tagged with Class Selector CS4.Voice Flow traffic has a network priority higher than AudioVideo, yet lower than Control. This traffic type should be used for real time voice streams such asVOIP.Sent traffic will contain a DSCP mark with a value of 0x38 and an 802.1p tagwith a value of 7. Corresponds to the WMM AC-VO access category. On Mac OSX, packets are tagged with Class Selector CS5.Control Flow traffic has the highest network priority. This traffic type should only be used for the most critical of data. For example, it may be used for data carryinguser inputs.Sent traffic will contain a DSCP mark with a value of 0x38 and an 802.1p tagwith a value of 7. This does not correspond to any WMM access category. OnMac OS X, packets are tagged with Class Selector CS7.Understanding Your ResultsDuring each testing cycle, the application performs five tests: sending and receiving TCP data, sending and receiving UDP data, and sending and receiving a time probe packet. Based on these tests, it computes TCP and UDP upstream and downstream throughput values (current, for the latest test, and averaged, for all tests), as well as the round-trip time. When all tasks in a cycle are completed, a new cycle automatically begins.ThroughputThroughput (also often referred to as "goodput") is the amount of application-layer data delivered from the client to the server (upstream) or from the server to the client (downstream) per second. The protocol overhead is not included, so when we talk, for example, about the TCP throughput rate of 1 Mbps, we mean that 125 Kbytes of actual data payload were sent between two network nodes during one second, not including TCP, IP, and Ethernet or 802.11 headers.Packet LossPacket loss is applicable to UDP tests only, because in TCP, all packets must be acknowledged and no data loss may occur. UDP loss is calculated as the percentage of data that was lost during transmission. For example, let's interpret the following result:UDP Down: 60.00 Mbps (Ave: 55.00), Loss: 40.0%This means that during the latest test cycle, the server sent 1 megabit of data in 10 milliseconds (actual data amount and duration may vary; we use this number only as an example,) and the client received 0.6 megabits in 10 milliseconds, while 0.4 megabits were lost en route.Round-Trip TimeRound-trip time (RTT) is the length of time it takes for a data packet to be sent from the client to the server and back. The application uses TCP packets for RTT measurements.Frequently Asked QuestionsQ. Why is the UDP downstream throughput value always zero?A. This is a firewall issue. This means that the UDP data being sent from the server cannot reach the client. When performing UDP testing, the client sends upstream UDP traffic to the server from a random UDP port to the server port (27100 by default.) The return downstream traffic goes from port 27101 to the client source port. Use this information to configure your firewall.Q. Why do I see very high (over 50%) UDP downstream loss?A. This is normal if you're running the client on a WLAN station. UDP traffic is not acknowledged. This means that the party that sends traffic can send as much traffic as the networking system can handle without "caring" about how much of it will be lost. If you run the server on the wired side of the network, then a typical PC equipped with a gigabit adapter can send hundreds of megabits per second. These data will first reach a switch, which might be the first bottleneck, and then the access point, which is almost always a bottleneck, because a typical 802.11n access point cannot send more than 100 Mbps of data downstream, i.e. to the client. As a result, most of the UDP packets might be lost en route, but this is the only way to figure out the maximum downstream UDP throughput value.Q. Why does the application require administrative privileges on Windows?A. The lion's share of problems with throughput tests is related to firewalls. For this reason, we took the liberty of opening the Windows firewall for our EXE file. Our application creates a permissive firewall rule on launch and deletes it on exit. This requires administrative privileges.Q. I entered a valid IPv6 address, clicked "Connect", and got the "No route to host" error. Why?A. Link-local IPv6 addresses may require a zone index. For example, instead of fe80:0:0:0:6a5b:35ff:fed1:4633, which does not contain a zone index, you may need to use fe80:0:0:0:6a5b:35ff:fed1:4633%en0.Q. Are the Windows, Mac, and Android versions interoperable?A. Yes, you can run the server on a Mac and the client on a Windows machine or vice versa. The Android client can work with either a Mac or a Windows server.11Frequently Asked Questions | TamoSoft Throughput TestOther Network Analysis SoftwareIn addition to simple test utilities like TamoSoft Throughput Test, we make a number of professional cutting-edge WLAN and LAN analysis and monitoring products:▪TamoGraph Site Survey is a wireless site survey software tool for collecting, visualizing, and analyzing 802.11 a/b/g/n/ac Wi-Fi data. Wireless network deployment and maintenance requires the use of a professional RF site survey tool that facilitates otherwise time-consuming and very complex tasks, such as ongoing analysis and reporting of signal strength, noise and interference, channel allocation, data rates, etc. By using TamoGraph, your business can dramatically reduce the time and costs that are involved in deploying and maintaining Wi-Fi networks and improve network performance and coverage.▪CommView for WiFi is a powerful wireless network monitor and analyzer for 802.11 a/b/g/n/ac networks. Loaded with many user-friendly features, CommView for WiFi combines performance and flexibility with an ease of use unmatched in the industry. CommView for WiFi captures every packet on the air to display important information such as the list of access points and stations, per-node and per-channel statistics, signal strength, a list of packets and network connections, protocol distribution charts, etc. By providing this information, CommView for WiFi can help you to view and examine packets, pinpoint network problems, and troubleshoot your software and hardware.▪NetResident is a network content analysis application designed to monitor, store, and reconstructa wide range of network events and activities, such as e-mail messages, Web pages, downloadedfiles, instant messages, and VoIP conversations. NetResident uses advanced monitoring technology to capture the data on the network, save the data to a database, reconstruct it, and display the content in an easy-to-understand format. NetResident helps your organization to protect sensitive information and enforce security policies, as well as to adhere to government and industry information protection regulations, by providing event-based network visibility and data leak detection and by reducing the risks associated with uncontrolled information flow. We welcome you to visit us at to learn more about these and our other network-relatedsoftware products.12Other Network Analysis Software | TamoSoft Throughput Test。
WIFI Test(wifi非信令测试指南)

WIFI Test UserGuide0.测试前准备测试运行环境:win7操作系统测试设备:IQVIEW测试需要安装软件:1、Android adb 工具2、production testharness3、PhoneTool 1914、IQSignal测试环境搭建如下图:1.WIFI Calibration首先连接设备,查看设备管理器连接端口如图,查看GTI/IPICOM 端口号,如图为com8启动ADB 输入如下命令:adb remountadb shellcd /system/bin ./rservice -p &启动校准工具:开始->程序->intel->ProductionTestHarness弹出error对话框,不用理会点击确定继续Load Flow 导入C:\Program Files (x86)\Intel\ProductionTestHarness\ScriptFiles\Self Calibration\RocsClient.ft注意:导入脚本之前,用记事本打开脚本,确认脚本内ComIndex编号设置和设备管理器的查看到的GTI/IPICOM口一致编辑完保存,选择打开,导入脚本文件,点击Execute Flow 执行校准如下图执行校准成功,显示界面如下图2.WIFI TX TEST发射指标测试启动PhoneTool ->settings->phone ToolPhone tool settingsConnection type:选择comPort:选择intel Mobil GTI/IPICOM Transport Layer:IPICOM6 Routing勾选复选框Custom RoutingSignage :DUTRoute Path:DUT/rsnode:GTICOM选定好后点击OK弹出如下对话框,不用理会,点击OK连接OK 如下图在Modes菜单下选择GTI进入GTI模式选择WLAN GTIinterface v.1.00.00. Functionget_version_informationmac_address_readmac_address_writePt_activatept_read_chip_idpt_rf_activatePt_rf_readPt_rf_startPt_txPt_tx_cw主要函数注释pt_activate()激活Ptest模式,0 off 1onPt_tx()TX发射指令{band; // 2.4GHz 设定为0channel; // 信道设定1-13sfactor; // starting factor 默认设定8000rate; //设定传输速率例如11B 11M设定11、11G 54M设定54、11N 65M设定71 powerlevel; // 1-64. Translated to - 5dBm to 26.5dBm in steps of ½ dB.enablectestmode; //默认设置0interval; //默认设置1preamble; //默认设置0length; } //发包长度默认设置10001、首先激活测试模式,选择pt_activate()单击回车,弹出对话框,输入0,返回ok后,再次选择pt_activate()回车,输入1 返回ok,进入测试模式选择Pt_tx() 回车,弹出对话空框,设定相关参数。
WIFI测试操作指导书

WIFI测试操作指导书1.测试框图2.WIFI测试需要搭配专业测试仪(N4010A)及被测试主板,电源,PC,数据线2.进入META模式连接被测试主板3.META设置1.选择工具栏:WIFI tool ,2.导入SRC ,3.再将校准的数据导入的EEPROM4.发射测试设置1.频率选择:通常我们只测试1.6.13三个频率信道号12345 6 7 8 9 10111213 频率(MHZ )2412 2417 2422 2427243224372442244724522457 2462 246724722.速率选择:调制试式与数据速率调制方式 数据速率状态 DSSS/CCK 1Mbit/s 、2Mbit/s 、5.5Mbit/s 、11Mbit/s必备 OFDM 6Mbit/s 、9Mbit/s 、12Mbit/s 、18Mbit/s 、24Mbit/s 、36Mbit/s 、54Mbit/s 必备 DSSS -OFDM 6Mbit/s 、9Mbit/s 、12Mbit/s 、18Mbit/s 、24Mbit/s 、36Mbit/s 、54Mbit/s 可选 PBCC5.5Mbit/s 、11Mbit/s 、22Mbit/s 、33Mbit/s可选3. 选择连续发射模式4. 点“start ”开始测试5.WIFI测试工具Agilent专门为N4010A做了一个测试工具,打开桌面上的专用工具1.新建一个测试,点“creat”2.选择对应测试频点3. 1Mbit/s、2Mbit/s、5.5Mbit/s、11Mbit/s(802.11B)其它速率(11a/g)6.发射功率测试(Transmitter Average Power Test)1.点“format-indepentent measurement”进入功率测试项2.按“force-multi”读取功率值测试内容 最大输出功率测试信道 1 6 13信号速率 11Mbit/s、6Mbit/s、54Mbit/s 测试标准(传导) CCK:14dBm《P《17dBmOFDM:12dBm《P《15dBm 规范 IEEE802.11b/802.11a/g7.发射中心频率容限(Transmitter center frequency tolerance )k 制式:点“DSSS standards measurements”进入测试2.OFDM 制式:点“OFDM standards measurements”进入测试测试内容 发射中心频率容限 测试信道 1 6 13 信号速率 11Mbit/s、6Mbit/s、54Mbit/s测试标准 +/-10ppm(24KHZ) 规范IEEE802.11b/802.11a/g8.码片时钟频率容限(transmitter chip clokc frencey tolerance)1.点“DSSS Demod”进入测试项2.点“force multi”读取“chip clk err”值测试内容 码片时钟频率容限测试信道 1 6 13信号速率 11Mbit/s(CCK)测试标准 +/-10ppm(24KHZ)规范 IEEE802.11b8.符号进钟频率容限(symbol clock frencency tolerance)1.点“OFDM Demod”进入测试项2.点“force multi”读取“SYMclk err”值测试内容 符号时钟频率容限测试信道 1 6 13信号速率 6Mbit/s54Mbit/s(OFDM)测试标准 +/-10ppm(24KHZ)规范 IEEE802.11a/g9.发射中心频率泄漏(transmitter center frequency leakage)1.点“OFDM standards measurements”进入测试2.点“force multi”读取“center frequency eaekage”值’测试内容 发射中心频率泄漏测试信道 1 6 13信号速率 6Mbit/s54Mbit/s(OFDM)测试标准 中心发射功率<-14dB规范 IEEE802.11a/g10.发射调制精度(EVM )k 制式:点“DSSS standards measurements”进入测试2.OFDM 制式:点“OFDM standards measurements”进入测试测试内容 发射调制精度 测试信道 1 6 13信号速率 11Mbit/s 测试标准 <20% 规范 IEEE802.11b 信号速率 6Mbit/s,54Mbit/s测试标准 (6Mbit/s )<-7dB,(54Mbit/s)<-27dB规范IEEE802.11a/g10.发射加电与掉电波度(power on and power down ramp)1.点“DSSS power ramp”进入测试项2.在“result”读取“up ramp time &down ramp time”值测试内容 发射加电与掉电波度测试信道 1 6 13信号速率 11Mbit/s(CCK)测试标准 <2us规范 IEEE802.11b11.发射频谱掩膜(transmitter spectral mask)k制式:点“spectral mask”,选择11b进入测试2.OFDM制式:点“spectral mask”选择11a/g进入测试测试内容 发射频谱掩膜测试信道 1 6 13信号速率 11 Mbit/s 、6Mbit/s、54Mbit/s(OFDM)测试标准 发射信号应包含在频谱掩膜范围内 规范 IEEE802.11a/g、IEEE802.11b12.发射机频谱平坦度(transmitter spectral flatness )1.点“OFDM standards measurements”进入测试2.点“force multi”读取“spectral flatness ”值’测试内容 发射中心频率泄漏 测试信道 1 6 13 信号速率 6Mbit/s54Mbit/s(OFDM)测试标准 >0 规范IEEE802.11a/g12.接收机最小输入电平灵敏度(receiver minimum input level sensitivity)目前我们的测试仪只支持11mbit/s与54mbit/s两种1.点“AWG control”进入测试,按图选择“11DSSS_CCk_1024B.WF1”“ 11DSSS_CCk_1024B.SEQ”2.在“out settings”输入最小电平点“play DSSS”进行测试3.在meta工具中点“continuous packet RX”读取“FER”,同时进行“2项输入不同的电平,11M时,最大-79dBm 误码率不得低于8%,54M时,最大-68dBm误码率不得低于10%,测试内容 发射频谱掩膜测试信道 1 6 13信号速率 11 Mbit/s、54Mbit/s(OFDM)测试标准 <-79(11mbit/s),<-68(54Mbit/s)规范 IEEE802.11a/g、IEEE802.11b。
WIFI吞吐量测试方法

Wireless mode an HT20 HT40 bgn HT20 HT40 Wireless mode bgn HT20 HT40
Tx Rx 90.23 93.14 180.62 188.37 86.35 89.62 170.26 180.46 Tx 44.67 93.25 Rx 47.18 93.16
4)开启“短GI”
5)开启“AMPDU”
单用户11n模式吞吐量测试
2、STA接收到AP的信号强度过强会影响吞吐量,需要将AP发射功率 调低(sta接收信号强度大于-20dbm会影响吞吐量),一般来说-----------40dbm~-65dbm的信号强度下吞吐量比较好,最好对比AP的web页 面显示的信号强度和STA无线扫描软件显示的信号强度。
选择合适的测试无线网卡。一定不能选择MIMO规格低于测试AP的 无线网卡。比如测试2x2的AP就不能选择1x1的无线网卡,但可以选 择2x2或者3x3的无线网卡。此外请尽量使用出货量大的无线网卡进行 测试,比如迅驰笔记本自带的Intel系列。
11n模式吞吐量测试
GO
单用户11n模式吞吐量测试
1.基本参数设置: 1)无线模式选择“802.11b/g/n” 2)数据率选择“Auto” 3)信道模式选择“20/40MHz”
5、使用Atheros方案的产品,在WEP、WPA、WPA-PSK加密时不支持 802.11n。
单用户11n模式吞吐量测试
6.如果在狭小空间测试(如屏蔽房),需要先降功率再测试。
7.802.11n的速率需要耐心的调试,速率不佳时尝试变动AP与终端的 距离,角度。
公司产品吞吐量介绍
