Raman spectroscopic study on pressure-induced amorphization in nanocrystalline anatase (TiO2)
冶金工程专业英语词汇
冶金工程专业英语词汇1. 冶金学冶金学是冶金工程专业的核心课程,主要讲授钢铁冶金和有色金属冶金过程的基本原理、工艺及装备,包括炼铁、炼钢、精炼、连铸、铝冶金、铜冶金、稀土冶金等内容。
中文英文冶金学metallurgy钢铁冶金iron and steel metallurgy有色金属冶金nonferrous metal metallurgy炼铁ironmaking炼钢steelmaking精炼refining连铸continuous casting铝冶金aluminum metallurgy铜冶金copper metallurgy稀土冶金rare earth metallurgy高炉blast furnace转炉converter电炉electric furnace真空精炼vacuum refining钢包ladle结晶器crystallizer铝电解槽aluminum electrolytic cell铜闪速熔炼copper flash smelting稀土萃取分离rare earth extraction and separation熔盐电解法molten salt electrolysis method冶炼产品smelting products生铁pig iron钢水molten steel铝锭aluminum ingot铜阳极泥copper anode slime稀土氧化物rare earth oxides冶炼渣smelting slag炉渣性质slag properties脱硫desulfurization脱磷dephosphorization脱氧deoxidation合金化alloying溅渣护炉splashing slag lining protection终点控制endpoint control中文英文出钢操作tapping operation凝固传热机制solidification heat transfer mechanism凝固结构与缺陷solidification structure and defects氧化还原反应oxidation-reduction reaction造渣反应与造渣制度slagging reaction and slagging system2. 冶金物理化学冶金物理化学是冶金工程专业的基础理论课程,主要讲授冶金过程中涉及的物理化学原理和方法,包括平衡与相图、溶液理论、电化学、表面与胶体化学、传递现象等内容。
第三代半导体材料氮化镓的拉曼光谱分析

第三代半导体材料氮化镓的拉曼光谱分析作者:***来源:《无线互联科技》2024年第03期摘要:第三代半导体材料中氮化镓是高频电子器件、大功率电子器件和微波功率器件制造领域的首选材料。
为了实现高质量氮化镓材料的外延生长,并且精准表征氮化镓外延材料的特性,文章对氮化镓外延材料进行了深入的拉曼光谱分析。
实验结果表明,对氮化镓外延材料进行拉曼光谱分析时最佳扫描范围是100~1 000 cm-1、最佳曝光时间是5 s、最佳光孔直径为100 μm,从而更精准地表征氮化镓外延材料,进而对微波功率器件的性能提升起到推动作用。
关键词:第三代半导体材料;氮化镓;拉曼光谱中图分类号:TN304 文献标志码:A0 引言第三代半导体材料出现后,逐步形成以氮化镓材料[1]为代表的一系列半导体材料,其中还包括碳化硅和金刚石等。
第三代半导体材料有其独有的特性,比如禁带宽度大、电子迁移率高以及击穿场强大等[2]。
在半导体材料进行异质外延时,有2种因素会导致外延层产生应变。
拉曼光谱测试仪就是利用这一原理进行工作。
这2种因素包括:衬底材料的膨胀系数与外延层的膨胀系数存在较大差异、衬底材料的晶格常数和外延材料的晶格常数存在较大差异。
在半导体中引入残余应力,会使得半导体能带结构以及外延层的结构性质产生变化,当应力较大时还会引起外延层产生裂纹。
拉曼峰的位置能够显示样品的成分分布,其中包括化学组成、结构和形态等。
峰位位移能够显示样品的属性分布,其中包括应力和温度。
拉曼散射光谱在研究材料各项性能和晶格等方面起到很大作用,其优势在于非接触性、非破坏性,并且不使用特殊的样品制备[3-4]。
氮化物半导体中存在特殊的化学键,这种化学键属于共价键和离子键的混合型,并且很容易受激光辐射,正因如此更适合用拉曼散射来进行分析[5]。
若要提升微波功率器件的性能,需要从提高第三代半导体材料氮化镓的晶体质量出发,对氮化镓材料进行深入详尽的拉曼光谱分析。
1 实验方法氮化镓外延材料中产生残余热应变,这是由衬底材料的膨脹系数与氮化镓外延层的膨胀系数存在巨大差异造成的。
白云石I相到Ⅱ相高压相变行为的拉曼光谱研究
白云石I相到Ⅱ相高压相变行为的拉曼光谱研究作者:张璐牛菁菁翟天雷秦善来源:《当代化工》2019年第11期Raman Spectroscopic Study on the High-pressure PhaseTransition Behavior of Dolomite;From Phase I to Phase IIZHANG Lu, NIU Jing-jing, ZHAI Tian-lei,;QIN;Shan(Key Laboratory of Orogenic Belts and Crustal Evolution, MOE, School of Earth and Space Sciences, Peking University,Beijing 100871, China)作为地壳中分布最广的含碳物质之一,碳酸盐广泛分布于地壳,并且对碳循环的演化过程具有重要作用。
碳循环是指深海沉积形成的碳酸盐受洋壳俯冲作用而向下运移进入地球深部,在深部通过变质和火山作用再经地质作用回到地表的过程[1]。
在此过程中,压力、温度和氧逸度共同作用使得碳酸盐在进入地球深部时发生分解、相变等一系列变化,其中的含碳物质也随之赋存[2,3]。
因此研究碳酸鹽矿物在地球深部的晶体结构和性质对理解深部碳循环具有重要的意义。
进入地球深部的碳酸盐矿物主要有白云石CaCO3、方解石MgCO3和菱镁矿CaMg(CO3)等。
作为碳酸盐中最重要的矿物之一,它们在高温高压下的稳定性和结构变化也受到了学者2的关注。
在地幔顶部对应的温压条件下白云石可以分解成文石和菱镁矿[4],而菱镁矿因其较强的结构稳定性被看作是深部碳的潜在载体[5,6];方解石在高压下会发生一系列相变[7-9]。
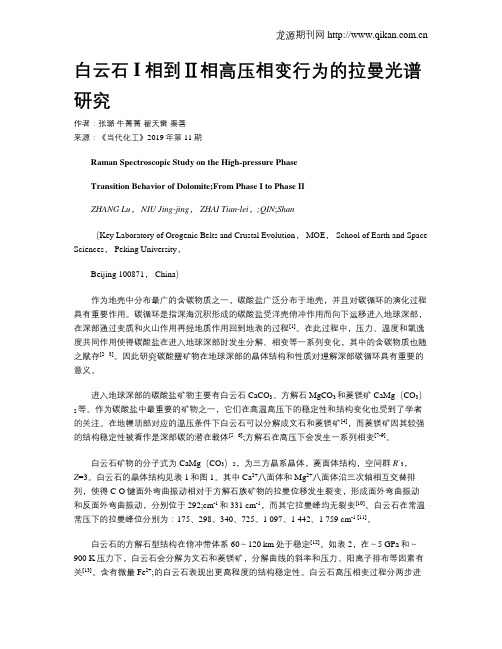
白云石矿物的分子式为CaMg(CO3)2,为三方晶系晶体,菱面体结构,空间群R`3,Z=3。
白云石的晶体结构见表1和图1。
其中Ca2+八面体和Mg2+八面体沿三次轴相互交替排列,使得C-O键面外弯曲振动相对于方解石族矿物的拉曼位移发生裂变,形成面外弯曲振动和反面外弯曲振动,分别位于292;cm-1和331 cm-1,而其它拉曼峰均无裂变[10]。
杰尼奥公司的Raman光谱仪使用培训课程说明书

6Who should attendFrom Monday 9 am to Wednesday 5:30 pmDates: February 11-13, 2019 May 13-15, 2019 June 24-26, 2019 October 7-9, 2019November 18-20, 2019Users of HORIBA Scientific Raman spectrometers • A cquire theoretical and practical knowledge on Raman spectrometers • L earn how to use the software • L earn methodology for method development and major analytical parameters • H ow to set up an analytical strategy with an unknown sample • H ow to interpret results• L earn how to follow the performances of theRaman spectrometer over the time.Day 1• The theory of the Raman principle • R aman Instrumentation • P ractical session – System and software presentation, Acquisition Parameters: - L abSpec 6 presentation and environment: useraccounts, file handling, display of data, basic functions - S et up of acquisition parameters and singlespectra measurement - Templates & ReportsDay 2• Analysis of Raman spectra • P ractical session: Raman spectrum measurement and Database Search - O ptimization of the parameters: how to chosethe laser, the grating, the confocal hole, the laser power- How to use the polarization options - Library Search using KnowItAll software - How to create databasesRaman imaging • H ow to make a Raman image (1D, 2D and 3D) • D ata evaluation: cursors, CLS fitting, peakfitting•Image rendering, 3D datasets •Fast mapping using SWIFT XSDay 3Data processing• Processing on single spectra and datasets • Baseline correction • Smoothing • Normalization• Spectra subtraction, averaging • Data reduction • Methods• Practical exercisesCustomer samples: Bring your own samples!Duration: 3 daysReference: RAM1Raman Microscopy for Beginners7Acquire technical skills on DuoScan, Ultra Low Frequency (ULF), Particle Finder or TERS.Users of HORIBA Scientific Raman spectrometers who already understand the fundamentals of Raman spectroscopy and know how to use HORIBA Raman system and LabSpec Software. It is advised to participate in the basic Raman training first (RAM1).Introduction to DuoScan• Principle and hardwareDuoScan Macrospot• Practical examplesDuoScan MacroMapping• Practical examplesDuoScan Stepping Mode• Practical examplesCustomer samples: Bring your own samples!Presentation of the ULF kit• Principle and requirements • Application examplesInstallation of the ULF kitIntroduction to Particle Finder• Principle and requirementsPractical session• Demo with known sample• Customer samples: Bring your own samples!Practical session• Demo with known samplesCustomers samples: Bring your own samples! Presentation of the TERS technique• Principle and requirements • Application examplesDemo TERS• Presentation of the different tips and SPM modes • Laser alignment on the tip • T ERS spectra and TERS imaging on known samplesPractical session• Hands-on on demo samples (AFM mode)• Laser alignment on the tip • T ERS spectra and TERS imaging on known samplesRaman Options: DuoScan, Ultra Low Frequency, Particle Finder, TERS8Users of HORIBA Scientific Raman spectrometers who already understand the fundamentals of Raman spectroscopy and know how to use HORIBA Raman system and labSpec Software. It is adviced to participate in the basic Raman training first.Who should attendDates: February 14, 2019 June 27, 2019November 21, 2019Duration: 1 dayReference: RAM2From 9 am to 5:30 pm• Acquire theoretical and practical knowledge on SERS (Surface Enhanced Raman Spectroscopy)• Know how to select your substrate • Interpret resultsRaman SERSIntroduction to SERSPresentation of the SERS technique • Introduction: Why SERS?• What is SERS?• Surface Enhanced Raman basics • SERS substratesIntroduction to the SERS applications• Examples of SERS applications • Practical advice • SERS limitsDemo on known samplesCustomer samples: Bring your own samples!Raman Multivariate Analysis9Users of HORIBA Scientific Raman spectrometerswho already understand the fundamentals of Ramanspectroscopy and know how to use HORIBA Ramansystem and LabSpec Software. It is advised toparticipate in the basic Raman training first (RAM1).• Understand the Multivariate Analysis module• Learn how to use Multivariate Analysis for data treatment• Perform real case examples of data analysis on demo and customer dataIntroduction to Multivariate Analysis• Univariate vs. Multivariate analysis• Introduction to the main algorithms: decomposition (PCA and MCR), classification and quantification (PLS)Practical work on known datasets (mapping)• CLS, PCA, MCRIntroduction to classification• HCA, k-means• Demo with known datasetsIntroduction to Solo+MIA• Presentation of Solo+MIA Array• Demo with known datasetsData evaluation: cursors, CLS fitting, peak fitting• Fast mapping using SWIFT XSObjective: Being able to select the good parameters for Raman imaging and to perform data processScanning Probe Microscopy (SPM)• Instrumentation• T he different modes (AFM, STM, Tuning Fork) and signals (Topography, Phase, KPFM, C-AFM, MFM,PFM)Practical session• Tips and sample installation• Molecular resolution in AFM tapping mode• M easurements in AC mode, contact mode, I-top mode, KPFM• P resentation of the dedicated tips and additional equipment• O bjective: Being able to use the main AFM modes and optimize the parametersimaging)Practical session• Hands-on on demo samples (AFM mode)• Laser alignment on the tip• T ERS spectra and TERS imaging on known sample Day 3TERS Hands-on• T ERS measurements, from AFM-TERS tip installation to TERS mapping.• TERS measurements on end users samples.• Bring your own samples!28Practical informationCourses range from basic to advanced levels and are taught by application experts. The theoretical sessions aim to provide a thorough background in the basic principles and techniques. The practical sessions are directed at giving you hands-on experience and instructions concerning the use of your instrument, data analysis and software. We encourage users to raise any issues specific to their application. At the end of each course a certificate of participation is awarded.Standard, customized and on-site training courses are available in France, G ermany, USA and also at your location.Dates mentionned here are only available for HORIBA France training center.RegistrationFill in the form and:• Emailitto:***********************• Or Fax it to: +33 (0)1 69 09 07 21• More information: Tel: +33 (0)1 69 74 72 00General InformationThe invoice is sent at the end of the training.A certificate of participation is also given at the end of the training.We can help you book hotel accommodations. Following your registration, you will receive a package including training details and course venue map. We will help with invitation letters for visas, but HORIBA FRANCE is not responsible for any visa refusal. PricingRefreshments, lunches during training and handbook are included.Hotel transportation, accommodation and evening meals are not included.LocationDepending on the technique, there are three locations: Longjumeau (France, 20 km from Paris), Palaiseau (France, 26 km from Paris), Villeneuve d’Ascq (France 220 km from Paris) or at your facility for on-site training courses. Training courses can also take place in subsidiaries in Germany or in the USA.Access to HORIBA FRANCE, Longjumeau HORIBA FRANCE SAS16 - 18 rue du canal91165 Longjumeau - FRANCEDepending on your means of transport, some useful information:- if you are arriving by car, we are situated near the highways A6 and A10 and the main road N20- if you are arriving by plane or train, you can take the train RER B or RER C that will take you not far from our offices. (Around 15 €, 150 € by taxi from Charles de Gaulle airport, 50 € from Orly airport).We remain at your disposal for any information to access to your training place. You can also have a look at our web site at the following link:/scientific/contact-us/france/visi-tors-guide/Access to HORIBA FRANCE, Palaiseau HORIBA FRANCE SASPassage Jobin Yvon, Avenue de la Vauve,91120 Palaiseau - FRANCEFrom Roissy Charles de Gaulle Airport By Train • T ake the train called RER B (direction Saint RemyLes Chevreuse) and stop at Massy-Palaiseaustation• A t Massy-Palaiseau station, take the Bus 91-06C or 91-10 and stop at Fresnel• T he company is a 5 minute walk from the station,on your left, turn around the traffic circle and youwill see the HORIBA building29 Practical InformationAround 150 € by taxi from Charles de Gaulle airport. From Orly Airport By Train• A t Orly airport, take the ORLYVAL, which is ametro line that links the Orly airport to the AntonyRER station• A t Antony station, take the RER B (direction StRemy Les Chevreuse) and stops at Massy-Palai-seau station• A t Massy-Palaiseau station, take the Bus 91-06C, 91-06 B or 91-10 stop at Fresnel• T he company is 5 minutes walk from the station,on your left, turn around the traffic circle and youwill see the HORIBA building• O r at Orly take the Bus 91-10 stop at Fresnel.The company is 5 minutes walk from the station,on your left, turn around the traffic circle and youwill see the HORIBA building. We remain at yourdisposal for any information to access to your trainingplace. You can also have a look at our web site at thefollowing link:/scientific/contact-us/france/visi-tors-guide/Around 50 € by taxi from Orly airport.Access to HORIBA FRANCE, Villeneuve d’Ascq HORIBA Jobin Yvon SAS231 rue de Lille,59650 Villeneuve d’Ascq - FRANCEBy Road from ParisWhen entering Lille, after the exit «Aéroport de Lequin», take the direction «Bruxelles, Gand, Roubaix». Immmediatly take the direction «Gand / Roubaix» (N227) and No «Bruxelles» (A27) Nor «Valenciennes» (A23).You will then arrive on the ringroad around Villeneuve d’Ascq. Take the third exit «Pont de Bois».At the traffic light turn right and follow the road around, (the road will bend left then right). About 20m further on you will see the company on the right hand side where you can enter the car park.By Road from Belgium (GAND - GENT)Once in France, follow the motorway towards Lille. After «Tourcoing / Marcq-en-Baroeul», follow on the right hand side for Villeneuve d’Ascq. Take the exit «Flers Chateau» (This is marked exit 6 and later exit 5 - but it is the same exit). (You will now be following a road parallel to the mo-torway) Stay in the middle lane and go past two sets of traffic lights; at the third set of lighte, move into the left hand lane to turn under the motorway.At the traffic lights under the motorway go straight, (the road shall bend left then right). About 20 m further you shall see the company on the right hand side where you can enter the car park.AeroplaneFrom the airport Charles de Gaulle take the direction ‘Ter-minal 2’ which is also marked TGV (high speed train); where you can take the train to ‘Lille Europe’.Train - SNCFThere are two train stations in Lille - Lille Europe or Lille Flandres. Once you have arrived at the station in Lille you can take a taxi for HORIBA Jobin Yvon S.A.S., or you can take the underground. Please note both train stations have stations for the underground.Follow the signs:1. From the station «Lille Flandres», take line 1, direction «4 Cantons» and get off at the station «Pont de bois».2. From the station «Lille Europe», take line 2, direction «St Philibert» and get off at the following station «Gare Lille Flandres» then take line 1, direction «4 Cantons» and get off at the station «Pont de Bois».BusBus n°43, direction «Hôtel de Ville de Villeneuve d’Ascq», arrêt «Baudoin IX».InformationRegistration: Fill inthe form and send it back by FAX or Email four weeks before beginning of the training.Registration fees: the registration fees include the training courses and documentation. Hotel, transportation and living expenses are not included except lunches which are taken in the HORIBA Scientific Restaurant during the training.Your contact: HORIBA FRANCE SAS, 16-18 rue du Canal, 91165 Longjumeau, FRANCE Tel: + 33 1 64 74 72 00Fax: + 33 1 69 09 07 21E-Mail:***********************Siret Number: 837 150 366 00024Certified ISO 14001 in 2009, HORIBA Scientific is engaged in the monitoring of the environmental impact of its activitiesduring the development, manufacture, sales, installation and service of scientific instruments and optical components. Trainingcourses include safety and environmental precautions for the use of the instrumentsHORIBA Scientific continues contributing to the preservation of theglobal environment through analysis and measuring technologymentisnotcontractuallybindingunderanycircumstances-PrintedinFrance-©HORIBAJobinYvon1/219。
二氧化钛的紫外拉曼光谱研究外文翻译
附录UV Raman Spectroscopic Study on TiO2. I. Phase Transformation at theSurface and in theBulkJing Zhang, Meijun Li, Zhaochi Feng, Jun Chen, and Can Li*State Key Laboratory of Catalysis, Dalian Institute of Chemical Physics, Chinese Academy of Sciences,P. O. Box 110, Dalian 116023, ChinaRecei V ed: September 16, 2005; In Final Form: No V ember 4, 2005Phase transformation of TiO2 from anatase to rutile is studied by UV Raman spectroscopy excited by 325and 244 nm lasers, visible Raman spectroscopy excited by 532 nm laser, X-ray diffraction (XRD), andtransmission electron microscopy (TEM). UV Raman spectroscopy is found to be more sensitive to the surfaceregion of TiO2 than visible Raman spectroscopy and XRD because TiO2 strongly absorbs UV light. Theanatase phase is detected by UV Raman spectroscopy for the sample calcined at higher temperatures thanwhen it is detected by visible Raman spectroscopy and XRD. The inconsistency in the results from the abovethree techniques suggests that the anatase phase of TiO2 at the surface region can remain at relatively highercalcination temperatures than that in the bulk during the phase transformation. The TEM results show thatsmall particles agglomerate into big particles when the TiO2sample is calcined at elevated temperatures andthe agglomeration of the TiO2 particles is along with the phase transformation from anatase to rutile. It issuggested that the rutile phase starts to form at the interfaces between the anatase particles in the agglomeratedTiO2 particles; namely, the anatase phase in the inner region of the agglomerated TiO2 particles turns out tochange into the rutile phase more easily than that in the outer surface region of the agglomerated TiO2 particles.When the anatase particles of TiO2 are covered with highly dispersed La2O3, the phase transformation inboth the bulk and surface regions is significantly retarded, owing to avoiding direct contact of the anataseparticles and occupying the surface defect sites of the anatase particles by La2O3.1. IntroductionTitania (TiO2) has been widely studied because of its uniqueoptical and chemical properties in catalysis,[1]photocatalysis,[2]sensitivity to humidity and gas,[3,4] nonlinear optics,[5]photoluminescence,[6]and so on. The two main kinds of crystalline TiO2,anatase and rutile, exhibit different physical and chemicalproperties. It is well-known that the anatase phase is suitablefor catalysts and supports,[7]while the rutile phase is used foroptical and electronic purposes because of its high dielectricconstant and high refractive index.[8]It has been well demonstratedthat the crystalline phase of TiO2 plays a significant rolein catalytic reactions, especially photocatalysis.[9-11]Some studieshave claimed that the anatasephase was more active than therutile phase in photocatalysis.[9,10]Although at ambient pressure and temperature the rutile phaseis morethermodynamically stable than the anatase phase,[12]anatase is the common phase rather than rutile because anataseis kinetically stable in nanocrystalline TiO2at relatively lowtemperatures.[13] It is believed that the anatase phase transformsto the rutile phase over a wide range of temperatures.[14]Therefore, understanding and controlling of the crystalline phaseand the process of phase transformation of TiO2 are important,though they are difficult.Many studies[13-31]have been done to understand the processof the phase transformation of TiO2. Zhang et al.[15]proposedthat the mechanism of the anatase-rutile phase transformationwas temperature-dependent according to the kinetic data fromX-ray diffraction (XRD). On the basis of transmission andscanning electron microscopies, Gouma et al.[16] suggested thatrutile nuclei formed on the surface of coarser anatase particlesand the newly transformed rutile particles grew at the expenseof neighboring anatase particles. Penn et al.[17]suggested thatthe formation of rutile nuclei at twin interfaces of anataseparticles heated hydrothermally.Catalytic performance of TiO2 largely depends on the surfaceproperties, especially the surface phase, because catalyticreaction takes place on the surface. The surface phase of TiO2should be responsible for its photocatalytic activity because notonly the photoinduced reactions take place on the surface[32] butalso the photoexcited electrons and holes might migrate throughthe surface region. Therefore, the surface phase of TiO2, whichis exposed to the light source, should play a crucial role inphotocatalysis. However, the surface phase of TiO2, particularlyduring the phase transformation, has not been investigated. Thechallenging questions still remain: is the phase in the surfaceregion the same as that in the bulk region, or how does thephase in the surface region of TiO2 particle change during thephase transformation of its bulk? The difficulty in answeringthe above questions was mainly due to lacking suitabletechniques that can sensitively detect the surface phase of TiO2.UV Raman spectroscopy is found to be more sensitive tothe surface phase of a solid sample when the sample absorbsUV light.[33]We studied the phase transition of zirconia (ZrO2)from tetragonal phase to monoclinic phase by UV Ramanspectroscopy, visible Raman spectroscopy, and XRD.[33] Theseresults clearly indicated that the surface phase of ZrO2 is usuallydifferent from the bulk phase of ZrO2 and the phase transforma-tion of ZrO2 starts from its surface region and then graduallydevelops into its bulk when the ZrO2 with tetragonal phase iscalcined at elevated temperatures.These findings lead us to further investigate the phasetransformation in the surface region of TiO2 by UV Ramanspectroscopy as TiO2 also strongly absorbs UV light. In thisstudy, we compared the Raman spectra of TiO2 calcined atdifferent temperatures with excitation lines in the UV and visibleregions. XRD and transmission electron microscopy (TEM)were also recorded to understand the process of phase transformationof TiO2. It was found that the results of UV Ramanspectra are different from those of visible Raman spectra andXRD patterns. The anatase phase of TiO2 at the surface regioncan remain at relatively higher temperatures than that in thebulk at elevated calcination temperatures; namely, the anatasephase in the inner region of the agglomerated TiO2 particlesturns out to change into the rutile phase more easily than thatin the outer surface region of the agglomerated TiO2 particles.The literature[15,17,19] proposed the mechanism that phasetransformation of TiO2 might start at the interfaces of contactinganatase particles. If the anatase particles of TiO2 are separated,the phase transformation of TiO2 from anatase to rutile couldbe retarded or prohibited. Jing et al.[34]showed that La3+ did notenter the crystal lattices of TiO2 and was uniformly dispersedonto TiO2in the form of lanthana (La2O3) particles with smallsize. To verify the above assumption, this study also preparedthe anatase phase of TiO2 sample covered with La2O3 andcharacterized the above sample by visible Raman spectroscopyand UV Raman spectroscopy. The results of the two types ofRaman spectra are in agreement with each other and show thatthe TiO2 particle covered with La2O3 can retain its anatase phaseboth in the bulk and in the surface region even after calcinationat 900 °C.2. Experimental Section2.1. Catalyst Preparation.2.1.1. Preparation of TiO2. TiO2was prepared by precipitation method. To 100 mL of anhydrousethanol was added 20 mL of titanium(IV) n-butoxide(Ti(OBu)4). This solution was added to a mixture solution ofdeionized water and 100 mL of anhydrous ethanol. The molarratio of the water/Ti(OBu)4was 75. After the formed whiteprecipitate was stirred continuously for 24 h, it was filtered andwashed twice with deionized water and anhydrous ethanol.Finally, the sample was dried at 100 °C and calcined in air attemperatures from 200 to 800 °C for 4 h, and then cooled toroom temperature.2.1.2. Preparation of La2O3-Co V ered TiO2(La2O3/TiO2). Theabove TiO2powder calcined at 500 °C was used as a support.The critical La2O3 loading corresponding to monolayer coverageof La2O3 on the grain surface of TiO2 is 0.27 g/100 m2. [35,36] Onthe basis of the BET surface area of the TiO2 support (54.3m2/g), the monolayer dispersion capacity can also be expressedas 15 wt % La2O3 of the weight of TiO2. La2O3/TiO2 samples,containing different amounts of La2O3(0.5-6 wt %) wereprepared by a wet impregnation method. The support wasimpregnated with aqueous solution of various concentrationsof lanthanum nitrate (La(NO3)3·6H2O) andsubsequently stirredin a hot water bath until it was dried. After the sample waskept at 110 °C overnight, it was calcined at 900 °C in air for 4h. A TiO2 sample was prepared by calcining the TiO2supportat 900 °C for 4 h (denoted as TiO2-900) for comparison withthe La2O3/TiO2 sample. Pure La2O3was obtained by calciningLa(NO3)3·6H2O at 550 °C for 4 h.2.2. Characterization.2.2.1. UV Raman Spectroscopy. UVRaman spectra were measured at room temperature with a Jobin-Yvon T64000 triple-stage spectrograph with spectral resolutionof 2 cm-1. The laser line at 325 nm of a He-Cd laser wasused as an exciting source with an output of 25 mW. The powerof laser at the sample was about3.0 mW. The 244 nm linefrom a Coherent Innova 300 Fred laser was used as anotherexcitation source. The power of the 244 nm line at sample wasbelow 1.0 mW.2.2.2. Visible Raman Spectroscopy. Visible Raman spectrawere recorded at room temperature on a Jobin-Yvon U1000scanning double monochromator with the spectral resolutionof 4 cm-1. The line at 532 nm from a DPSS 532 Model 200532 nmsingle-frequency laser was used as the excitation source.2.2.3. X-ray Powder Diffraction (XRD), TEM, and Ultra V iolet-Visible Diffuse Reflectance Spectroscopy. XRD patterns wereobtained on a Rigaku MiniFlex diffractometer with a Cu KRradiation source. Diffraction patterns were collected from 20°to 80°at a speed of 5°/min. TEM was taken on a JEM-2011TEM for estimating particle size and morphology. UV-visdiffuse reflectance spectra were recorded on a JASCO V-550UV-vis spectrophotometer.2.2.4. Brunauer-Emmett-Teller (BET) Specific SurfaceArea. The BET surface area of the TiO2 support was measuredby nitrogen adsorption at 77 K using a Micromeritics ASAP2000 adsorption analyzer.3. Results3.1. Spectral Characteristics of Anatase and Rutile TiO2.The anatase and rutile phases of TiO2 can be sensitivelyidentified by Raman spectroscopy based on their Raman spectra.The anatase phase shows major Raman bands at 144, 197, 399,515, 519 (superimposed with the 515 cm-1 band), and 639cm-1.[37] These bands can be attributed to the six Raman-activemodes of anatase phase with the symmetries of Eg, Eg, B1g,A1g, B1g, and Eg, respectively.[37] The typical Raman bands dueto rutile phase appear at 143 (superimposed with the 144 cm-1band due to anatase phase), 235, 447, and 612 cm-1, whichcan be ascribed to the B1g, two-phonon scattering, Eg, and A1gmodes of rutile phase, respectively.38Additionally, the band at144 cm-1is the strongest one for the anatase phase and theband at 143 cm-1 is the weakest one for the rutile phase. PartsA and B, respectively, of Figure 1display the Raman spectra ofTiO2 calcined at 500 and 800 °C with excitation lines at 532,325, and 244 nm. Obviously, both visible Raman spectra andUV Raman spectra show that the TiO2 sample is in the anatasephase (Figure 1A) and rutile phase (Figure 1B).Figure 2 shows UV-vis diffuse reflectance spectra of theTiO2 sample calcined at 500 and 800 °C (the TiO2 sample is inthe anatase phase and rutile phase, respectively). For the anatasephase, the maximum absorption and the absorption band edgecan be estimated to be around 324 and 400 nm, respectively.The maximum absorption and the absorption band edge shiftto a little longer wavelength for the rutile phase.[39]By comparing the Raman spectra of the anatase (Figure 1A)or rutile phase (Figure 1B) excited by 532, 325, and 244 nmlines, it is found that the relative intensities of characteristicbands due to anatase or rutile phase in the high-frequency regionare different. For the anatase phase (Figure 1A), the band at638 cm-1 is the strongest one in the Raman spectrum with theexcitation line at 325 or 532 nm, while the band at 395 cm-1 isthe strongest one in the Raman spectrum with the excitationline at 244 nm.For the rutile phase (Figure 1B), the intensities of the bandsat 445 and 612 cm-1 are comparable in the visible Ramanspectrum. The intensity of the band at 612 cm-1 is strongerthan that of the band at 445 cm-1 in the Raman spectrum withthe excitation line at 325 nm, and the reverse is true for theRaman spectrum with the excitation line at 244 nm. In addition,for the rutile phase, a band at approximately 826 cm-1 appearsin the UV Raman spectra. Some investigations show that therutile phase of TiO2 exhibits a weak band at 826 cm-1 assignedto the B2g mode.[38,40]The fact that the relative intensities of the Raman bands ofanatase phase or rutile phase are different for UV Ramanspectroscopy and visible Raman spectroscopy are mainly dueto the UV resonance Raman effect because the laser lines at325 and 244 nm are in the electronic absorption region of TiO 2(Figure 2). There is no resonance Raman effect observed forthe TiO 2 sample excited by visible laser line, because the lineat 532 nm is outside the absorption region of TiO 2 (Figure 2).Therefore, for the anatase or rutile phase, the Raman spectroscopiccharacteristics in the visible Raman spectrum are differentfrom those in the UV Raman spectrum. When the UV laserline with different wavelengths is used as the excitation source,the resonance enhancement effect on the Raman bands ofanatase or rutile phase is different. For example, for the rutilephase (Figure 1B), the band at 612 cm -1 is easily resonanceenhanced when the excitation wavelength is 325 nm. Amongall the characteristic bands of the rutile phase, the extent ofresonance enhancement of 445 cm -1 is the strongest when the244 nm laser is used as the excitation source (Figure 1B).3.2. Semiquantitative Analysis of the Phase Compositionof TiO 2 by XRD and Raman Spectroscopy. The weightfraction of the rutile phase in the TiO 2 sample, W R, can beestimated from the XRD peak intensities using the followingformula:[41]]84.801[1)(rut ana A A W R +=where A ana and A rut represent the X-ray integrated intensities ofanatase (101) and rutile (110) diffraction peaks, respectively.To estimate the weight fraction of the rutile phase in the TiO 2sample by Raman spectroscopy, pure anatase phase and purerutile phase of the TiO 2 sample, which have been prepared bycalcination of TiO 2 powder at 500 and 800 °C for 4 h, weremechanically mixed at given weight ratio and ground carefullyto mix sufficiently. Figure 3A displays the visible Raman spectra of the mechanicalmixture with 1:1, 1:5, 1:10, 1:15, 5:1, and 10:1 ratios ofanatase phase to rutile phase. The relationship between the arearatios of the visible Raman band at 395 cm-1 for anatase phaseto the band at 445 cm -1 for rutile phase (A 395 cm -1/A 445 cm -1) andthe weight ratios of anatase phase to rutile phase (W A /W R ) isplotted in Figure 3B. It can be seen that a linear relationshipbetween the band area ratios and the weight ratios of anatasephase to rutile phase in the mixture is obtained. The rutilecontent in the Degussa P25, which usually consists of roughlyabout 80% anatase and 20% rutile phase,42 was estimated bythis plot. Our Raman result indicates that the rutile content inthe Degussa P25 is about 18.7%, which is close to the knownresult. Thus, the above linear relationship based on visibleRaman spectroscopy can be used to estimate the rutile contentin TiO 2.Figure 4A presents the UV Raman spectra of the mechanicalmixture with 1:1, 1:2, 1:4, 1:6, 1:10, and 1:15 ratios of anatasephase to rutile phase with the excitation line at 325 nm. Figure4B shows the plot of the area ratios of the UV Raman band at612 cm-1 for rutile phase to the band at 638 cm-1 for anatasephase (A 612 cm -1/A 638 cm -1) versus the weight ratios of rutile phaseto anatase phase (W R/W A). There is also a linear relationshipbetween the band area ratios and the weight ratios of rutile phaseto anatase phase.3.3. Phase Transformation of TiO 2 at Elevated CalcinationTemperatures.3.3.1. XRD Patterns and Visible Raman Spectraof TiO2Calcined at Different Temperatures. Figure 5 showsthe XRD patterns of TiO2calcined at different temperatures.The “A” and “R” in the figure denote the anatase and rutilephases, respectively. For the sample before calcination, diffractionpeaks due to the crystalline phase are not observed,suggesting that the sample is still in the amorphous phase. Whenthe sample was calcined at 200 °C, weak and broad peaks at2θ=25.5°, 37.9°, 48.2°, 53.8°, and 55.0° were observed. Thesepeaks represent the indices of (101), (004), (200), (105), and(211) planes of anatase phase, respectively.[43] These results suggest that some portions of the amorphous phase transforminto the anatase phase. The diffraction peaks due to anatasephase develop with increasing the temperature of calcination.When the calcination temperature was increased to 500 °C, thediffraction peaks due to anatase phase became narrow andintense in intensity. This indicates that the crystallinity of theanatase phase is further improved.[44]When the sample was calcined at 550 °C, weak peaks wereobserved at 2θ=27.6°, 36.1°, 41.2°, and 54.3°, whichcorrespond to the indices of (110), (101), (111), and (211) planesof rutile phase. [43]This indicates that the anatase phase starts totransform into the rutile phase at 550 °C. The diffraction peaksof anatase phase gradually diminish in intensity and thediffraction patterns of rutile phase become predominant withthe calcination temperatures from 580 to 700 °C. These resultsclearly show that the phase transformation from anatase to rutileprogressively proceeds at the elevated temperatures. The diffractionpeaks assigned to anatase phase disappear at 750 °C,indicating that the anatase phase completely changes into therutile phase. The diffraction peaks of rutile phase became quitestrong and sharp after the sample was calcined at 800 °C, owingto the high crystallinity of the rutile phase.Figure 6 displays the visible Raman spectra of TiO2 calcinedat different temperatures. For the sample before calcination, twobroad bands at about 430 and 605 cm-1are observed, indicatingthat the sample is in the amorphous phase.[19]For the samplecalcined at 200 °C, a Raman band at 143 cm-1 is observed andthe high-frequency region shows interference from the fluorescencebackground, which might come from organic species.After calcination at 300 °C, other characteristic bands of anatasephase appear at 195, 395, 515, and 638 cm-1, but some portionsof the sample may exist in the amorphous phase because thereis still a broad background in Figure 6.It was found that, when the sample was calcined at 400 °C,the fluorescence disappeared, possibly because the organicresidues were removed by the oxidation. The bands of anatasephase increased in intensity and decreased in line width whenthe sample was calcined at 500 °C. This result suggests thatthe crystallinity of the anatase phase is greatly improved,[18] whichis confirmed by XRD (Figure 5). The enlarged section of Figure6 shows the Raman spectrum of the high-frequency region ofthe sample calcined at 500 °C. Besides the bands at 395, 515,and 638 cm-1, two very weak bands at 320 and 796 cm-1areobserved. These two bands can be assigned to a two-phononscattering band and a first overtone of B1g at 396 cm-1,respectively. [37]It is noteworthy that a very weak band appearsat 445 cm-1 due to rutile phase for the sample calcined at 550°C. This indicates that the anatase phase starts to change intothe rutile phase at 550 °C. This result is in good agreementwith that of XRD patterns (Figure 5). The weightpercentageof the rutile phase in the samples calcined at different temperatureswas estimated by visible Raman spectroscopy and XRD(shown in Figure 7). As seen from Figure 7, the rutile contentestimated from visible Raman spectrum and XRD pattern ofthe sample calcined at 550 °C is 4.2% and 5.7%, respectively.It can be seen that the rutile contents estimated by visible Ramanspectroscopy and XRD are also in accordance with each other.When the sample was calcined at 580 °C, other twocharacteristic bands were observed at 235 and 612 cm-1 due toRaman-active modes of rutile phase. Figure 7 shows the rutilecontent is 13.6% and 10.9% based on the visible Ramanspectrum and XRD pattern of the sample calcined at 580 °C.The intensities of the bands of rutile phase (235, 445, and 612cm-1) increased steadily while those of the bands of anatasephase (195, 395, 515, and 638 cm-1) decreased when thecalcination temperatures were elevated from 600 to 680 °C(Figure 6). These results suggest that the TiO2 sample undergoesthe phase transformation from anatase to rutile gradually. Therutile content was estimated for the samples calcined from 600to 680 °C based on the visible Raman spectra. The results showthat the content of the rutile phase is increased from 33.1% to91.2% respectively for the samples calcined at 600 and 680 °C(Figure 7). The XRD results corresponding to the above twosamples indicate that the rutile content is changed from 32.9%to 90.7% (Figure 7). These results clearly show that the rutilecontent in the sample estimated by visible Raman spectroscopyis agreement with that estimated by XRD.The Raman spectrum of the sample calcined at 700 °C showsmainly the characteristic bands of rutile phase, but the very weakbands of anatase phase are still observed (Figure 6). When thesample was calcined at 750 °C, the bands of anatase phasedisappeared and only the bands due to rutile phase (143, 235,445, and 612 cm-1) were observed. These results indicate thatthe anatase phase completely transforms into the rutile phaseand are consistent with the results from XRD (Figure 5). Whenthe temperature was increased to 800 °C, the characteristic bandsdue to rutile phase increased in intensity further.Both the results of XRD and visible Raman spectra (Figures5 and 6) show that the anatase phase appears at around 200 °Cand perfect anatase phase is formed after calcination at temperaturesof 400-500 °C. The rutile phase starts to form at 550°C, and the anatase phase completely transforms into the rutilephase at 750 °C. The signals of visible Raman spectra comemainly from the bulk region of TiO2because the TiO2 sampleis transparent in the visible region (Figure 2).[33]XRD is knownas a bulk-sensitive method. Therefore, it is essentially inagreement between the results of visible Raman spectra andXRD patterns.3.3.2. UV Raman Spectra of TiO2 Calcined at DifferentTemperatures. UV-vis diffuse reflectance spectra (Figure 2)clearly show that TiO2 has strong electronic absorption in theUV region. Thus, the UV Raman spectra excited by a UV laserline contain more signal from the surface skin region than thebulk of the TiO2 sample because the signal from the bulk isattenuated sharply due to the strong absorption.[33] Therefore, ifa UV laser line in the absorption region of TiO2is used as theexcitation source of Raman spectroscopy, the information fromUV Raman spectra is often different fromthat of visible Ramanspectra.The laser line at 325 nm was selected as the excitation sourceof the UV Raman spectra. The UV Raman spectra and thecontent of the rutile phase of the TiO2 sample calcined atdifferent temperatures are shown in parts A and B, respectively,of Figure 8. When the sample was calcined at 200 or 300 °C,the Raman band at 143 cm-1 with a shoulder band at 195 cm-1and three broad bands at 395, 515, and 638 cm-1 were observed,indicating that the anatase phase is formed in the sample.However, the low intensity and the broad band indicate thatthe amorphous phase still remains in the sample. It can be seenthat the fluorescence in the high-frequency region can be avoidedwhen the UV laser line is used as the excitation line. However,the corresponding visible Raman spectra (Figure 6) showinterference from the fluorescence.All bands assigned to anatase phase become sharp and strongafter calcination at 500 °C (Figure 8A). These results are inagreement with those of XRD and visible Raman spectra(Figures 5 and 6). The UV Raman spectra of the sample withthe calcination temperatures from 550 to 680 °C are essentiallythe same as those of the sample calcined at 500 °C (Figure 8A).However, according to the XRD patterns and visible Ramanspectra (Figures 5 and 6), the anatase phase starts to transforminto the rutile phase at only 550 °C and the anatase phasegradually changes into the rutile phase in the temperature rangeof 550-680 °C.After calcination at 700 °C, a new band at 612 cm-1 andtwo weak bands at 235 and 445 cm-1 due to rutile phase appearwhile the intensities of the bands of anatase phase begin todecrease (Figure 8A). On the basis of the UV Raman spectrumand XRD pattern of the sample calcined at 700 °C, the rutilecontent in the sample is 56.1% and 97.0%, respectively (Figure8B). It is found that the rutile content estimated by UV Ramanspectroscopy is far less than that estimated by XRD.When the sample was calcined at 750 °C, the intensities ofthe bands due to rutile phase increased, but the intensities ofthe bands due to anatase phase were still strong in the UVRaman spectra (Figure 8A). The UV Raman spectrum of thesample calcined at 750 °C indicates that the rutile content is84.3% (Figure 8B). However, the results of XRD and visibleRaman spectrum (Figures 5 and 6) suggest that the anatase phasetotally transformed into the rutile phase after the sample wascalcined at 750 °C. The characteristic bands due to anatase phasedisappear and the sample is in the rutile phase after calcinationat 800 °C (Figure 8A). Obviously, there are distinct differences between the results from the UV Raman spectra, visible Ramanspectra, and XRD patterns. It seems that the anatase phaseremains at relatively higher temperatures when detected by UVRaman spectroscopy than by XRD and visible Raman spectroscopy. Another UV laser line at 244 nm was also selected as theexcitation source of UV Raman spectroscopy in order to getfurther insights into the phase transformation of TiO2. Theresults of the UV Raman spectra of TiO2 calcined at differenttemperatures with the excitation line at 244 nm are presentedin Figure 9. When the sample was calcined at 200 °C, four broadbands were observed at 143, 395, 515, and 638 cm-1, whichclearly indicate that the anatase phase exists in the sample. Theintensities of the Raman bands due to anatase phase (143, 395,515, and 638 cm-1) become strong after calcination at 500 °C.The UV Raman spectra hardly change for the sample calcinedatdifferent temperatures even up to 680 °C. The characteristicbands (445 and 612 cm-1) of rutile phase appear only whenthe calcination temperature exceeds 700 °C. This result is ingood agreement with that from the UV Raman spectrum of thesample calcined at 700 °C with 325 nm excitation (Figure 8A).The intensities of the bands due to anatase phase (395, 515,and 638 cm-1) decrease while those of bands assigned to rutilephase (445 and 612 cm-1) increase after calcination at 750 °C(Figure 9). When the sample was calcined at 800 °C, the Ramanbands due to anatase phase disappeared, while the bands of rutilephase developed. This result indicates that the sample calcinedat 800 °C is in the rutile phase. It is interesting to note that theresults of the UV Raman spectra with the excitation lines at325 and 244 nm are in agreement with each other but aredifferent from those of XRD patterns and visible Raman spectra.3.3.3. TEM of the TiO2 Sample Calcined at DifferentTemperatures. TEM was used to characterize the microstructureof the TiO2 sample calcined at 500, 600, and 800 °C (shown inFigure 10). Most particles in the sample calcined at 500 °Cexhibit diameters in a range between 10 and 30 nm (Figure10a). On the other hand, remarkable agglomeration is observedfor the TiO2 sample calcined at 500 °C. The particle sizeincreases after calcination at 600 °C (Figure 10b). Accordingto the results of XRD and visible Raman spectra (Figures 5and 6), the sample undergoes the phase transformation fromanatase to rutile gradually in the temperature range of 550-680 °C. These results imply that the phase transformation andgrowth of the particle size are interrelated. Many researchers[45-49]reported similar phenomena. Kumar et al.45 attributed thisparticle size growth to the higher atomic mobility because ofbond breakage during the phase transformation. When thecalcination temperature was increased to 800 °C, TiO2 particlesfurther grew and the particle size could be as large as about200 nm (Figure 10c).3.4. Visible Raman Spectra and UV Raman Spectra ofLa2O3/TiO2 with Increasing La2O3 Loading. The literature[15,17,29]proposed the mechanism that the phase transformationof TiO2might start at the interfaces of contacting anataseparticles. If direct contact between anatase particles of TiO2 isavoided, the phase transformation of TiO2 from anatase to rutilecould be retarded or prohibited. This assumption may be verifiedby covering the surface of anatase TiO2 with an additive. Inthis work, we used La2O3dispersed on anatase TiO2to preventthe anatase particles from contacting directly because it wasreported that La2O3could be highly dispersed on anataseTiO2.[34-36]Figure 11A displays the visible Raman spectra of La2O3/TiO2with increasing La2O3 loading. TiO2 support is in the anatasephase because only characteristic bands (143, 195, 395, 515,and 638 cm-1) due to anatase phase are observed. When theTiO2 support was calcined at 900 °C (TiO2-900), the Ramanspectrum gave the characteristic bands of rutile phase, indicatingthat the TiO2-900 sample was in the rutile phase. When thesample with 0.5 wt % La2O3 loading was calcined at 900 °C,the Raman spectrum drastically changed, as compared to theTiO2-900 sample. Only characteristic bands of anatase phasewere observed, suggesting that the TiO2 sample retains itsanatase phase when La2O3 loading is 0.5 wt % while the TiO2-900 sample is in the rutile phase. The。
硝酸钠分析报告
硝酸钠分析报告1. 简介硝酸钠(NaNO3)是一种常见的无机化合物,具有广泛的应用领域。
本报告旨在通过对硝酸钠样品的分析,了解其化学性质、物理性质以及分析方法。
2. 化学性质硝酸钠是无色结晶固体,易溶于水。
在水溶液中,硝酸钠完全解离为钠离子(Na+)和亚硝酸根离子(NO3-)。
硝酸钠具有氧化性和还原性,在一些化学反应中起到很重要的作用。
3. 物理性质硝酸钠的相对分子质量为85.0 g/mol,密度为2.26 g/cm3。
它在室温下为无色结晶固体,熔点为308℃,沸点为380℃。
硝酸钠的溶解度与温度密切相关,随着温度的升高,溶解度也增加。
4. 分析方法4.1 硝酸钠含量测定硝酸钠的含量可以通过酸碱滴定法进行测定。
具体步骤如下:1.取一定量的硝酸钠样品,并加入适量的酸性溶液进行酸化处理。
2.将酸化后的样品用标准酸溶液进行滴定,直到溶液由红变黄为止。
3.记录所耗酸溶液的体积,并根据滴定反应的化学计量关系计算硝酸钠的含量。
4.2 硝酸钠纯度测定硝酸钠样品的纯度可以通过热重分析进行测定。
具体步骤如下:1.取一定量的硝酸钠样品,并将其放入热重仪中进行加热。
2.在一定的温度范围内,观察样品的质量变化情况。
3.根据样品的质量损失情况,计算硝酸钠样品的纯度。
5. 结论通过以上的分析方法,我们可以得出以下结论:1.硝酸钠是一种常见的无机化合物,具有氧化性和还原性。
2.硝酸钠的物理性质包括密度、熔点和沸点等。
3.硝酸钠的含量可以通过酸碱滴定法进行测定。
4.硝酸钠的纯度可以通过热重分析进行测定。
在实际应用中,对硝酸钠样品进行分析可以确保其质量和纯度,从而满足不同领域的需求。
6. 参考文献1.Zhang, Y., Liu, D., Yu, F., & Li, H. (2018). Spectroscopic investigations ofthe interactions between bovine serum albumin and sodium nitrate.Spectrochimica Acta Part A: Molecular and Biomolecular Spectroscopy, 188,433-440.2.Zhang, Y., Li, H., Xu, Y., & Yu, F. (2019). Raman spectroscopicinvestigation of the interactions between sodium nitrate and bovine serumalbumin. Spectrochimica Acta Part A: Molecular and Biomolecular Spectroscopy, 207, 48-54.。
光散射学报第32卷,第1

光散射学报第32卷,第#〜4期目次第1期综述微流控SERS及其在生物医学应用的研究进展..................拉曼光谱在墨迹鉴定中的应用研究进展..........................光散射理论不同笼占据率I型甲烷水合物结构和光学性质的第一性原理研究…金纳米旋转椭球的折射率传感特性分析与优化...................表面增强拉曼散射技术基于单个花状银纳米颗粒的表面增强拉曼散射效应研究..........还原氮化对V2O5薄膜SERS效应的影响........................化学和生物研究中的应用Fe3O4@Au纳米星颗粒作为循环SERS基底用于农药残留物的检测拉曼光谱&D成像技术确定黑色交叉笔画顺序的研究............上川岛青花彩瓷的光谱分析.....................................乳腺癌的傅里叶变换红外光谱成像研究..........................其它光谱技术及应用基于激光诱导荧光的油类污染物检测系统研究...................利用小角X射线散射技术研究煤干幅过程中的孔隙结构变化.........................................徐迪,黄青⑴..............................刘英霞!贾硕果(23).......................邓蓉!王赵!杨亮!等(30)夏伊丁-亚库普,帕尔哈提江-吐尔孙,武盼盼(40)...................陶晨阳,宁欢,陈海艺,等(46)...................裴媛!吴振刚,魏恒勇!等(52).......................丁倩倩!顾涛!董荣录(51).....................白国华,鲁逸林,连园园(63)................胡林顺,曾庆光,温锦秀,等(72)...................陆燕飞!朱勇康!赵远!等(71).......................陈至坤,郭蕊,程朋飞(14)...................肖鹏!张淑娇,李东风!等(50)第2期第二十届全国光散射学术会议青年学者论文析应中面控中的原拉曼研究……………………………………………三维SiO2-Ag多孔结构的制备及对挥发性有机物(VOC:)的SERS检测........................基于“咖啡环$效应的SERS技术用于氯氮平中毒的快速检测.................................对氨基苯磺酰胺在银表面的吸附和SERS光谱的理论研究...................................... 透明柔性胶带包覆AuNPs/ITO基底应用于农药SERS光谱分析.................................表面增强拉曼光谱法检测油中甲醇............................................................基于不同萃取剂的油中糠醛拉曼光谱检测研究.................................................基于拉曼光谱和改进KNN算法的油纸绝缘设备老化阶段判别...................................基于萃取技术对变压器油中甲醇拉曼光谱定量分析的研究...................................... 拉曼分球及其在中的应用………………………………………………………………基于拉曼光谱和改进极限学习机的葡萄糖浓度检测............................................基于门控单光子相机的远程拉曼探测..........................................................表面增强拉曼技术ZnO/Au复合薄膜的制备及SERS性能的研究...................................................基于等离子波导的表面增强拉曼芯片仿真分析.................................................…朱嘉森,杨皓,张卫红,等(95)张茂峰,刘雍凯,王雅茹,等(102)朱青霞,,吴,等101,,刘国坤,等121 -■邱琼,代瑞红,刘晓琳,等125 -■李光茂,乔胜亚,朱晨,等132 -■乔胜亚,陈莎莎,熊俊,等136 -■赵金勇,周永阔,陈,等142王,张嘉,,等141 -■黄保坤,朱琳,,等154,王,杨,等159,张,金鹏程,等166••…刘肖,张霞,,等171,,朱,等179材料中的应用肉类现场快速智能化识别分类探究陈简一(114)ZnX&(OB))C12(X=Co,Ni)声子谱和热力学性质的第一性原理研究.................................董欣月,冯敏,王玉芳(119)第3期综述光声成像技术表面增强拉曼散射技术基于拉曼光谱相似度比对的油纸绝缘老化阶段诊断花粉的表面增强拉曼光谱鉴别研究Au@PS阵列SERS基底的特性研究表面增强拉曼光谱对抗肿瘤药物5-氟尿的检测研究蒋文萍,吴其鑫,,等(195%张腾翼,古亮,陈等(202…符致秋,刘刚,,等(210裴君妍,徐宗伟,王,等(217周国良,黄光耀,李盼,等(224化学和生物研究中的应用取代基对观es o-四苯基CD几何结构,红外拉曼振动频率及电子光谱的影响的理论研究张坚,李秀(230) PX装置吸附塔进料非芳含量的拉曼定量分析蒋飘逸,戴连奎(237)光散射理论基于光散射理论的玻璃晶圆表面缺陷检测方法研究涂政乾,董立超,赵东峰,等(245)对称性破缺纳米核壳二聚体的近场特性研究姜继玉,姜莎莎,吕靖薇,等(251)氮化_低温高压光谱研究范春梅,刘静仪,刘珊,等(259)材料中的应用嵌入金属纳米颗粒提高晶硅薄膜太阳能电池吸收率肖亮,朱群志(266)其它光谱技术及应用一种新的布里渊光时域定位技术蒋超(274)光谱法在唐卡蓝、绿色颜料分析中的应用张蕊,方小济,巨建伟(280)基于激光拉曼光谱快速无损检测牛油果油的研究张凤娟,黄敏,刘振方(288)第4期综述气溶胶单颗粒的拉曼测量方法,张(295)表面增强拉曼散射技术基于等离子波导的表面增强拉曼芯片仿真分析赖春红,周小兵,朱峻峰,等(301)单链DNA表面增强拉曼散射检测条件的优化蒋承顺,李旺,柳艳,等(306)基于SERS阵列的铜绿假单胞菌代谢产物铜绿菌素即时检测陈燕,陈欢,陈周恬,等(312)三氧化鸭超薄纳米片SERS活性基底的制备与性能研究孙宗杰,林东岳,何遥,等(320)材料中的应用小角X射线散射法研究枣树的微孔结构武海娟,翟红生,杨春明,等(328)化学和生物研究中的应用基于等离子体四极共振的金纳米长方体颗粒的折射率传感性能研究刘静雅,张现周(335)胆酸钠自组装行为的小角X射线散射研究李博楠,李天富,刘荣灯,等(343)金纳米颗粒在全血环境中近场增强特性李俊平,陈娜,刘书朋,等(348)仪器和方法学消光光谱颗粒粒径测量方法影响因素实验研究杨斌,赵蓉,王继,等(355)自组装纳米球热压印制备金属纳米盘阵列的研究曹燕,陈溢杭(361)其它光谱技术及应用江苏仪征刘集联营西汉墓岀土彩绘陶俑颜料分析范陶峰(369)陕西绥德县博物馆馆藏青铜甑锈蚀物的拉曼光谱分析付倩丽,康卫东,张尚欣,等(375)原位ATR-IR光谱研究钳酸钠光催化全分解水机理丁倩,陈涛,冯兆池,等(381) L-半胱氨酸功能化的碳量子点为探针快速检测花旗松素程家维,张宇辉,杨季冬(386)THE JOURNAL OF LIGHT SCATTERINGVol.32No.#〜4CONTENTSNo.1OverviewMicrofluidic SERS form and its Biomedical Applications..................................................................................................XU Di&HUANG Qing(1) Research Progress and Application of Raman Spectroscopy on the Identification of Ink Marks................LIU Yingxia,51A Shuoguo(23) Theories of Light ScatteringStudies on the Structure and Optical Properties of Different Cage Occupancy on si Methane Hydrate by First-principle ............................................................................................................................................DENGRong,WANG Zhao&YANG Liang&etal(30) Analysis and Optimization of Refractive Index Sensing of Gold Nanospheroid.YAKUPU Xiayiding,TUERSUN Paerhatijiang,WU Panpan(40)Surface-Enhanced Raman Scattering(SERS)Surface-enhanced Raman Scattering Study of Individual Flower-like Silver Nanoparticles....................................................................................................................................TAO Chenyang,NING Huan,CHEN Haiyi,et al(46) The Impact of Reduction Ntridation on SERS Effect of V2O5Film....................PEI Yuan,WU Zhengang,WEI Hengyong,et al(52) Application in Chemistry and Biology ResearchesFe3O4@Au nanostar as reproducible SERS substrates for the detection of pesticide residues.....................................................................................................................................................DING Qianqian&GU Tao&DONG Ronglu(58) Study of Raman Spectroscopy3D Profilometry to Determine the Sequence of Black Pen Ink Crossings.....................................................................................................................................................BAI Guohua,LU Yilin,LIAN Yuanyuan(63) Spectral Analysis of Blue-and-Whte porcelain on Shangchuan Island............HU Linshun&ZENG Qingguang&WEN Jiniu&et al(72) Study on Breast Cancer by Fourier Transform Infrared Spectroscopy Imaging••-LU Yanfei,ZHU Yongkang,ZHAO Yuan,et al(78) Other Optical Spectroscopic Techniques and ApplicationsResearch on Oil Contaminant Detection System Based on Laser Induced Fluorescence.................................................................................................................................................CHEN Zhikun&GUO Rui&CHENG Pengfei(84) Study on Pore Structural Changes of Coal Carbonization by Small Angle X-ray Scattering Technology...................................XIAO Peng,ZHANG Shujiao&LI Dongfeng,et al(90)No.2Papers by young scholars at the20th National Conference on light scattering=nsituRamanEvidenceof=ntermediatesAdsorptionEngineeringby High-=ndexFacetsControlduring HydrogenEvolutionReaction ....................................................................................................................................ZHU Jia s en,YANG Hao,ZHANG Weihong,et al(95) PreparationofThree-Dimensional(3D)SiO2-AgPorousStructureandSERSDetectionofVolatileOrganicCompounds(VOCs) ...............................................................................................................................ZHANG Mao f e ng&LIU Yongkai&WANG Yaru&et al(102) Antipsychoticdrugpoisoning monitoringofclozapineinurinebyusingco f eeringe f ectbasedsurface-enhancedRamanspectroscopy ............................................................................................................................................ZHU Qingxia&YU Xiaoyan&WU Ze'bing&et al(108) TheoreticalStudyofAdsorptionandSERSSpectraofSulfanilamideonSilverSurfaces........................................................................................................................................SHEN Xiaoru&PANG Ran&LIU Guokun&et al(121) Transparent flexible tape coated AuNPs/ITO substrate for pesticide SERS spectral analysisQIUQiong,DAIRuihong,LIU Xiaolin,tal(125) Detection of Methanol in Oil by Surface-enhanced Raman Spectroscopy...........LI Guangmao,QIAO Shengya,ZHU Chen,et al(132) RamanSpectroscopicDetectionofFurfuralinOilBasedonDi f erentExtractants....................................................................................................................................QIAO Shengya,CHEN Shasha,XIONG Jun,et al(136) Aging Stage Discrimination of Oil-Paper Insulation Equipment Based on Raman Spectrum and Improved KNN AlgorthmsZHAO Jinyong&ZHOU Yongkuo&CHEN Yu&tal(142) Study on Quanttative Analysis Method of Methanol Raman Spectra in OilBy Extraction TechnologyWANG Cong&ZHANGJiayi&SONG Shiji&tal(148)TheDesignofRamanIntegratingSphereandtheApplicationofDetectingGasesHUANGBaokun&ZHULin&HANJingf ng&tal(154)GlucoseconcentrationdetectionbasedonRamanspectroscopyandimprovedExtremeLearning MachineXING Lingyu&WANG Qiaoyun&YANG L i&tal(159) Remote Raman Detection Based on Gated-Single-Photon Camera......FANG Zhengjun&ZHANG ShPei&Jin Pengcheng&et al(166) Surface-EnhancedRamanSca t ering(SERS)Fabricationand SERS Properties Studies of ZnO/Au Composite film..........................LIU Xiao&ZHANG Xia&WENG Yijin&et al(171) Simulation AnalysisoJSurJace-enhancedRamanSca t eringChipBasedonthePlasma WaveguideI Chunhong,ZHOU Xiaobin,ZHU Jun f e ng,et al(179)FastInte l igentIdentiicationandExplorationoJMeatOnSite..........................................................................................................CHENJianyi(184)OtherOpticalSpectroscopicTechniquesandApplicationsFirst-principles Study of Phonon Spectra and Thermodynamic Properties of Z11X3(OB))C12(X=Co,Ni).................................................................................................................................................DONG Xinyue,FENG Min&WANG Yufang(119) No.3OverviewPhotoacoustic imaging................................................................................................................J1ANG Wenping&WU Qixin&MIN Jun&e=al(195) Surface-Enhanced Raman Scattering(SERS)Aging Phase Diagnosis of Oil Paper Insulation Based on Raman Spectral Similarty Ratio...............................................................................................................................ZHANG Tengyi,GU Liang,CHEN Xingang,et al(202) Discrimination of Pollen by Surface Enhanced Raman Spectroscopy......................................FUZhiqiu&LIU Gang&AN Ran&et al(210) Study on SERS substrate properties ofAu@PS arrays................................................................................PEI Junyan&XUZongwei,et al(217) Detection of5-Fluorouracil by Surface Enhanced Raman Spectroscopy ZHOU Guoliang,HUANG Guangyao&LI Pan,et al(224) Application in Chemistry and Biology ResearchesInfluences by substtuents on the geometrical structure&infrared and raman vibration frequency and electronic spectrum forme s o-tetraphenylporphyrin:A theoretical study................................................................................................................ZHANG Jian,Li Xiu(230) Quantitative Analysis for Non-aromatic Hydrocarbon in the Feedstock of an Adsorption Tower in a P-Xylene Unit Based on Raman Spectroscopy....................................................................................................................................................................................JIANG Piaoyi,DAI Liankui(237) Theories of Light ScatteringResearch on Surface Defect Detection Methodof Glass Wafer Based on Light Scattering Theory...............................................................................................................................Tu Zhengqian&Dong Lichao,Zhao Dongfeng&et al(245) ResearchonNearFieldCharacteristicsofSymmetryBreaking multilayerednanoshe l sdimer....................................................................................................................................JIANG Jiyu,JIANG Shasha,LV Jingwei,et al(251) Low-temperature and high-pressure Spectroscopy study of Gallium N t ride............FAN Chunme i,LIU Jingyi,LIU Shan,e t al(259) Other Optical Spectroscopic Techniques and ApplicationsEmbedding Metal NanEparticles tEIncrease the AbsErptiEn RateEf Crysta l ine SilicEn Thin Film SElar Ce l s...............................................................................................................................................................................XIAO Liang,ZHU Qunzhi(266) OtherOpticalSpectroscopicTechniquesandApplicationsA new Brillouin optical time domain localization technique................................................................................................................JIANG Chao(274) ApplicaNionofSpecNromeNryon AnalysisofBlueandGreenPigmenNsinNheThangka.....................................................................................................................................................ZHANG Rui,FANG Xiaoji,JU Jianwei(210) SNudyonRapid Non-desNrucNiveTesNingofAvocadoOilBasedonLaserRamanSpecNroscopy....................................................................................................................................ZHANG Fengjuan&HUANG Min&LIUZhenfang(211) No.4OverviewRaman Spectroscopy Measurement for Aerosol Single Particle.....................................................CHANG Pianpian&ZHANG Yunhong(295) Surface-EnhancedRamanSca t ering(SERS"Simulation AnalysisoJSurJace-enhancedRamanSca t eringChipBasedonthePlasma WaveguideI Chunhong&ZHOU Xiaobin&ZHU Jun f e ng&et al(301) OptimizationoJsurJaceenhancedRamansca t eringdetectionconditionsJorsingle-strandedDNAJIANGCh ngshun,LIWang,LIUYan,tal(306" SERS array toward point-of-care detection of Pseudomonas aeruginosa metabolteCHEN Yan,CHEN Huan,CHEN Zhoutian,tal(312" Preparation of Tungsten Trioxide Ultrathin Nanosheets for SERS Active Substrate and Its Performance............................................................................................................................................SUN Zongjie,LIN Dongyue,HE Yao,et al(320) OtherOpticalSpectroscopicTechniquesandApplicationsSAXS Study on the Micropore Structure of Jujube...................................WU Haijuan,ZHAI Hongsheng,YANG Chunming,et al(321) ApplicationinChemistryandBiologyResearchesStudyEftheRefractiveIndexSensingPerfErmancesEfAu NanEcubEidParticlesBasedEnthePlasmEnicQuadrupEleResEnance ......................................................................................................................................................................LIU Jingya&ZHANG Xianzhou(335) StudyEnself-assemblybehaviErEfsEdiu34)Near-fieldEnhancementCharacteristicsEfGEld NanEparticlesin WhEleBlEEdEnvirEnmentLI Junping&CHEN Na&LIUShup ng&tal(341) Instruments and MethodsExperimentalResearchEnInfluenceFactErsEfParticleSize MeasurementMethEdbasedEnExtinctiEnSpectrEscEpy .................................................................................................................................................YANG Bin&ZHAORong,WANG Ji,e t al(355) StudyEnfabricatiEnEfMeta l icNanEdisk ArraysbyhEtpressingself-assemblednanEspheres CAOyan&CHENyihang(361) OtherOpticalSpectroscopicTechniquesandApplicationsPigment analysis of painted terracotta unearthed from the Western Han Dynasty Tomb at Lianying&Liuji in Yizheng&Jiangsu Province ........................................................................................................................................................................................................FAN Taof e ng(369) Raman Spectrum Analysis of Corrosion Products on the Bronze Bu in Suide Museum in Shaanxi Province...........................................................................................................................FU Qianii,KANG Weidong,ZHANG Shangxin,et al(375) Mechanistic Study of Photocatalytic Overall Water Splitting on NaTaOa-based Photocatalysts by In S iu ATR-IR SpectroscopyDingQian,Ch nTao,F ngZhaochi,tal(311) Rap6dDetect6onofTaxfolnbyL-cyste6neFunct6onalzedCarbon QuantumDotsCHENG Jiawei&ZHANG Yuhui&YANG Jidong(316)。
拉曼光谱原理及应用
6 醇和烷烃的拉曼光谱是相似的:I. C-O键与C-C键的力常 数或键的强度没有很大差别。II. 羟基和甲基的质量仅相 差2单位。 III.与C-H和N-H谱带比较,O-H拉曼谱带较弱。
2941,2927cm-1 ASCH2 2854cm-1 SCH2 1444,1267 cm-1 CH2
仪器使用中的注意事项
1.保证使用环境:具备暗室条件;无强震动 源、无强电磁干扰;不可受阳光直射。
2.光学器件表面有灰尘,不允许接触擦拭, 可用气球小心吹掉。
3.实验结束,首先取出样品,关断电源。
4.注意激光器电源开、关机的顺序正好相反。
四、拉曼光谱的应用
Applications of Raman spectroscopy
由拉曼光谱可以获得有机化合物的各种结构信息:
1 同种分子的非极性键S-S,C=C,N=N,CC产生强拉曼 谱带, 随单键双键三键谱带强度增加。
2 红外光谱中,由C N,C=S,S-H伸缩振动产生的谱带一 般较弱或强度可变,而在拉曼光谱中则是强谱带。
3 环状化合物的对称呼吸振动常常是最强的拉曼谱带。
4 在拉曼光谱中,X=Y=Z,C=N=C,O=C=O-这类键的对 称伸缩振动是强谱带,反这类键的对称伸缩振动是弱谱带。 红外光谱与此相反。
拉曼光谱的特征
1. 对不同物质Raman 位移不同; 2.对同一物质与入射光频率无关;是表征分子振转能级的特征物理量;是定性与结构分析的依据; 3.拉曼线对称地发布在瑞利线两侧,长波一侧为斯托 克斯线,短波一侧为反斯托克斯线; 4.斯托克斯线强度比反斯托克斯线强;
三. 激光Raman光谱仪 laser Raman spectroscopy
- 1、下载文档前请自行甄别文档内容的完整性,平台不提供额外的编辑、内容补充、找答案等附加服务。
- 2、"仅部分预览"的文档,不可在线预览部分如存在完整性等问题,可反馈申请退款(可完整预览的文档不适用该条件!)。
- 3、如文档侵犯您的权益,请联系客服反馈,我们会尽快为您处理(人工客服工作时间:9:00-18:30)。
Raman spectroscopic study on pressure-induced amorphization innanocrystalline anatase (TiO 2)Zhongwu Wang *,S.K.SaxenaCenter for Study of Matter at extreme conditions (CeSMEC),Florida International University,VH-150,University Park,Miami,FL 33199,USA Received 16November 2000;received in revised form 29January 2001;accepted 30January 2001by F.J.DiSalvoAbstractA raman spectroscopic investigation was carried out to study the pressure-induced phase transformation in nanocrystalline anatase (TiO 2)up to 37GPa.As compared to a macrocrystalline solid which transforms to the a -PbO 2structure at 2.6±4.5GPa,we found that the nano-anatase phase remains stable to pressures as high as ,24GPa,and then transforms to an amorphous phase.The new amorphous phase is quenchable upon release of pressure to ambient condition.An increased surface energy may stabilize the nano-anatase,suppressing the appearance of anatase-to-a -PbO 2phase transformation (2.6±4.5GPa in bulk anatase),and then leads to the amorphization of nano-anatase under strong compression.q 2001Elsevier Science Ltd.All rights reserved.Keywords:A.Nanostructures;D.Phase transition;D.Order±disorder effects;D.Raman spectroscopy PACS :62.50.1p;61.82.Rx;64.70.Kb1.IntroductionNanocrystalline solids are de®ned as materials with crystal size between 10±100nm.They have attracted signi®cant interest due to their special properties [1].Numerous nanocrystalline metals,ceramics and semi-conductors have been synthesized and studied [2,3].Nano-crystalline materials have large surface to volume ratios and fewer dislocations as compared to bulk samples.There is lattice relaxation at grain boundaries.Each of these characters can have signi®cant impact on the physical and electronic properties of the material.Studies have shown that various properties such as stability,hardness,melting temperature,sintering ability,compressibility and electronic structure can be dependent upon particle size [4±9].Nanocrystalline TiO 2has been the subject of considerable experimental and theoretical work in recent years [10±13].The mechanical,optical,electrical behavior,and vibrational modes of nano-TiO 2have been widely studied [10,12,13].In order to better understand the physical and vibrationalproperties of nano-TiO 2,the internal strain and grain boundary structure of nano-TiO 2have been extensively investigated by transmission electron microscopy,X-ray diffraction,and Raman and FTIR spectroscopy [10,11,12,13].But there is little study on the pressure dependence of phase transformations in nano-TiO 2.At ambient pressure,bulk TiO 2crystallizes in three modi-®cations:rutile,brookite and anatase.Because of the simpli-city of synthesis with application in materials science (e.g.nano-techniques)and the relevance to geophysics,high-pressure behavior of bulk anatase has been investigated experimentally by using Raman spectroscopy and X-ray diffraction [14±18].To explore the different dynamics caused by external pressure in nanoparticle materials,we investigated the high-pressure behavior of nano-anatase by using DAC technique together with in-situ Raman spectro-scopy.Here,we report on the pressure-induced amorphiza-tion in nanosized (the average size of 9nm)anatase (TiO 2),and its pressure dependence of Raman vibrational modes.2.ExperimentalThe sample used here was commercial anataseSolid State Communications 118(2001)75±780038-1098/01/$-see front matter q 2001Elsevier ScienceLtd.Allrights reserved.PII:S0038-1098(01)00046-1*Corresponding author.Tel.:11-305-348-3445;fax:11-305-348-3070.E-mail address:zwang04@® (Z.Wang).nanomaterial,with a particle size within 7±11nm.It was identi®ed with X-ray diffraction.At atmospheric pressure,the powder anatase exhibited spectral features similar to these of single crystal [10,19],but the Raman peak in low wave number (141cm 21in bulk-and 158cm 21in nano-anatase)is a little different [12±14],and this is likely caused by heating and plasma effect from laser.High pressure Raman measurements were carried out at room temperature by using a gaseketed high pressure Diamond Anvil Cell (DAC)and Raman spectrometer in the back scattering con®guration.An argon ion laser in combination with an additional Ti 31:sapphire laser was operated at 785nm.This design can effectively suppress the strong ¯uorescence effect of diamond [20].The laser power was operated at 30±50mw (after ®lter)to excite the sample.The Raman spectra were collected by using high throughput holographic imaging spectrograph with volume transmission grating,holographic notch ®lter and thermoelectrically cooled CCD detector with the resolution of 4Rcm 21[20].A 4:1mixture of methanol:ethanol was used as pressure medium.This mixture is known to produce a hydrostatic environment to about 10GPa.Pressures were determined using the pressure dependent spectral shift of the sharp ruby ¯uorescence R 1line [21].The R 1line ¯uorescence was excited by the argon green laser with the wave number of 514.5nm.The sample was placed in a 301steel gasket hole 115m m in initial thickness and 150m m in diameter with a ruby chip.The gasket hole was then completely ®lled with the alcohol mixture to ensure a hydrostatic environ-ment.Moreover,another run without any pressure medium was carried out to check the effect of deviatoric stress on Raman scattering.3.Results and discussionThe Raman spectra of nano-crystalline anatase with a 4:1mixture of methanol/ethanol at high pressures are shown in Fig.1.A signi®cant spectral change occurs at pressure of 24GPa.As is well known,anatase belongs to the spacegroup D 194h (I41/amd)and the primitive unit cell contains two formula units [14].According to the factor group analy-sis,the six modes (A 1g 12B 1g 13E g )are Raman active and the three modes (A 1u 12E u )infrared active [14].At low pressure,all Raman active modes are in reasonable agree-ment with these reported previously (Fig.1)[10,13].Because of the plasma effect from Ti 31:sapphire laser and heating in sample,the lowest wave number mode (E g )in 162cm 21is a little higher than that (158cm 21)observed previously at ambient condition by using an argon ion laser of 488nm [10,13],and also shows a relatively weak peak.Our studies on other powders including garnets and oxides show a similar phenomenon,which can be effectively suppressed under high pressures [20].This can also be found in Fig.1,showing that the above Raman peak inlow wave-number mode (E g )gets stronger with increasing pressure.As shown in Fig.2,the four strong Raman peaks,assigned to two E g modes and one B 1g mode and one A 1g 1B 1g duplicated mode,shift to higher frequencies under compression.The three high wave-number modes have similar Raman shift slope of 2.7cm 21/GPa,similar to these observed in bulk materials [17].One low wave number mode (E g )shows a lower slope of 1.5cm 21/GPa,much lower than that in bulk materials [17].With increasing pressure to about 24GPa,all Raman modes disappear.In stead,a halo starts to arise and remains up to our investi-gated pressure of 37GPa (Fig.1).It means that a pressure-induced amorphization occurs at pressure of about 24GPa.Upon release of pressure,the amorphous phase was quench-able to ambient pressure.In the run of free pressure medium,the spectral depen-dence of pressure is the almost same as that with pressure medium,and the amorphization occurs at same pressure of 24GPa.Also,a few ruby chips in the loading sample were used to examine the pressure gradient,indicating that no remarkable pressure gradient cross the sample exists at pressure lower than 10GPa.This implies that the nano-crystalline anatase may have a low bulk modulus as compared with the bulk anatase (179GPa)[15].Z.Wang,S.K.Saxena /Solid State Communications 118(2001)75±7876Fig.1.High pressure Raman spectra of nano-anatase at room temperature.The spectra were collected from sample with a pres-sure medium of a 4:1mixture of methanol/ethanol.The run without pressure medium has the same spectral dependence on pressure.For the bulk crystalline anatase,both Raman and X-ray diffraction studies indicate that anatase transforms to the orthorhombic columbite phase(a-PbO2structure with space group Pbcn,60)at2.6±4.5GPa,and then to the monoclinic baddeleyite phase(ZrO2structure with space group P21/c,14)at13GPa[14±19].Upon decompression, the baddeleyite phase transforms to the a-PbO2phase at about7GPa[16].As compared to the bulk materials, nano-anatase has a higher ratio of surface energy to volume and a ratio of lower defect number to volume[2,3].Also, nano-crystalline anatase may have different physical proper-ties,likely having a lower bulk modulus.Thus,a high energy kinetic hindrance may exists in the phase trans-formation of anatase-to-a-PbO2due to the size-induced effect,so it is likely to result in anatase stable up to very high pressure(24GPa),and then in turn to transform to an amorphous phase,rather than a new a-PbO2phase or ZrO2 phase at high pressure.4.ConclusionAn in-situ Raman spectroscopic study of nanocrystalline anatase with an average size of9nm has been conducted up to37GPa.It is shown that the pressure-induced amorphiza-tion in nano-anatase takes place at pressures around24GPa. The decrease of the particle size results in an anatase phase stable up to very high pressure,and suppresses the appear-ance of the anatase-a-PbO2phase transformation observed in the corresponding bulk material.It is suggested that a higher ratio of surface energy to volume and a ratio of defect number to volume as well as the size-induced effect in nano-anatase compared with the bulk material may stabilize TiO2 in the original low pressure anatase phase,and then lead to the amorphization of nano-anatase under strong compres-sion.AcknowledgementsWe thank Florida International University for the research was made possible through®nancial support from the Division of sponsored Research at FIU.We also thank Peter Lazor for invaluable discussion,Debby Arnold for editorial and Peter Liermann for technical assistance.References[1]H.Gleiter,Prog.Mater.Sci.33(1989)223±315.[2]R.W.Siegel,Mater.Sci.Engng.A168(1993)189±197.[3]A.P.Alivisatos,P.F.Barbara,A.W.Castleman,J.Chang,D.A.Dixon,M.L.Klein,G.L.McLendon,ler,M.A.Ratner, P.J.Rossky,S.I.Stupp,M.E.Thompson,Adv.Mater.10 (1998)1297±1336.[4]C.-C.Chen,A.B.Herhold,C.S.Johnson,A.P.Alivisatos,Science276(1997)398±401.[5]S.H.Tolbert,A.B.Herhold,L.E.Brus,A.P.Alivisatos,Phys.Rev.Lett.76(1996)4384±4387.[6]S.H.Tolbert,A.P.Alivisatos,J.Chem.Phys.102(1995)4642±4671.[7]S.B.Qadri,J.Yang,B.R.Ratna,E.F.Skelton,J.Z.Hu,Appl.Phys.Lett.69(1996)2205±2207.[8]J.Z.Jiang,L.Gerward,R.Secco,R.Frost,J.Appl.Phys.87(2000)2658±2660.Z.Wang,S.K.Saxena/Solid State Communications118(2001)75±7877Fig.2.Pressure dependence of the peak frequencies of the Raman active modes of anatase up to24GPa at room temperature.[9]A.N.Goldstein,C.M.Echer,A.P.Alivisatos,Science256(1992)l425±1428.[10]W.F.Zhang,Y.L.He,M.S.Zhang,Z.Yin,Q.Chen,J.Phys.D.Appl.Phys.33(2000)912±916.[11]S.D.Mo,W.Y.Ching,Phys.Rev.B.51(1995)13023±13032.[12]D.Bersani,P.P.Lottici,X.Z.Ding,Appl.Phys.Lett.72(1998)73±75.[13]J.C.Parker,R.W.Siegel,Appl.Phys.Lett.57(1990)943±945.[14]M.Nicol,M.Y.Fong,J.Chem.Phys.54(1971)3167.[15]T.Arlt,M.Bermejo,M.A.Blanco,L.Gerward,J.Z.Jiang,J.S.Olsen,J.M.Recio,Phys.Rev.B61(2000)14414±14419.[16]J.K.Dewhurst,J.E.Lowther,Phys.Rev.B54(1996)R3673±R3676.[17]T.Ohsaka,S.Yamaoka,O.Shimomura,Solid State Commun.30(1979)345±347.[18]J.F.Mammone,S.K.Sharma,M.Nicol,Solid State Commun.34(1980)799±802.[19]T.Ohsaka,F.Izumi,Y.Fujiki,J.Raman Spectrosc.7(1978)321.[20]O.N.Shebanova,zor,Z.Wang,submitted for publica-tion.[21]H.K.Mao,P.W.Bell,J.W.Shaner,D.J.Steinberg,J.Appl.Phys.49(1978)3276±3284.Z.Wang,S.K.Saxena/Solid State Communications118(2001)75±78 78。