08-09(2)四六级作文辅导(3)--图表文写作
大学英语四六级、考研写作备考-图表作文
写作第八课图表作文图表作文是锻炼学生进行科学写作的一种形式,是四六级、研究生考试的主要题型之一,是一种控制性和应用性很强的出题方式。
图表就是利用统计数字、图像传达信息。
一般把各种数字资料,按照一定的顺序,通过表格形式表现出来的叫表—table;利用点、线、图等把信息资料表现出来的叫图—graph/chart. 常用的图形有柱形图—bar graph/chart or histogram、曲线图—line or curve graph/chart 、圆/饼形图—circle or pie graph/chart、方框图—block diagram、流程图或过程图—flow chart / sequence diagram、树形图—tree diagram等。
1.审题在信息量比较大、参考数据比较复杂的情况下,要仔细阅读任何一项提示性材料,在图表中提取以下几方面的准确信息:①浏览整个图表、要求、给出的题目、开头等,抓住主要内容。
②阅读图表的标题、比例系数、插图说明。
③寻找明显的特征,如曲线高点、低点,显著的趋势,变化模式等。
④曲线图与柱形图表示的是两个或两个以上事物间的关系。
⑤圆形图表示的是代表整体的圆(100%)与代表各部分的扇形之间的关系以及各扇形之间的关系。
扇形越大,百分比越高。
通过仔细分析,弄清了几项提示信息之间的内在关系后,推导出图表反映出的深层含义,进而从中推断出文章主题,确定采取哪一种描述方法,然后写出提纲或至少在头脑中对全文有个框架。
2.写法图表式作文一般以三段式来组织文章。
大体有两种类型:①先描写后议论。
在第一段把图表描述概况完毕,并综述图表反映出的主题、趋势。
以下两段针对主题议论、观点总结,与一般议论文无异。
②夹叙夹议。
第一段开门见山,简单明确地概括图表反映的总体内容,综述图表的核心含义。
第二段对数字进行仔细分析,阐述图表中的要点及其相互关系。
要列出几组典型的相关数据来说明或论证第一段提出的主题,归纳出图表所体现出来的增减规律或总体趋势。
四六级万能作文模板通用

四六级万能作文模板通用一、图表作文。
As is shown in the chart/table, the percentage/proportion/number of A has increased/decreased significantly in recent years. In 20XX, A accounted for XX%, while in 20XX, the figure rose to XX%. Meanwhile, the percentage/proportion/number of B has witnessed a similar trend, with XX% in 20XX and XX% in 20XX. In addition, the figure for C also experienced a dramatic change, from XX% in 20XX to XX% in 20XX.There are several possible reasons for these changes. Firstly, it is widely believed that the rapid development of economy has greatly contributed to the increase/decrease of A. In addition, the improvement of people's living standard also plays a significant role in the change of A. Moreover, the change in government policy has directly influenced the trend of A.From my perspective, the change in A not only reflects the development of society, but also brings about some problems. On the one hand, the increase/decrease of A may lead to some negative effects on the environment. On the other hand, the change in A may also exert some adverse influences on people's daily life.In conclusion, the change in A is a reflection of the development of society, and we should take some effective measures to solve the problems caused by it.二、图画作文。
四级作文辅导资料(作文)学生用
四级作文辅导资料---图表作文&说明文—学生用图表作文要求根据图表上的数据,找出所反映的某个趋势或某一问题、现象,并对该问题、趋势产生的原因进行分析。
常见的图表作文有表格(table),条形图(bar graph),圆形结构图(pie chart)。
其文章结构较为固定,一般分为三段:第一段:描述图表。
第二段:分析原因或后果。
第三段:结论。
即提出解决问题的办法、建议或进行展望。
一.图表作文基本模式模式A:段落一:According to the figures given in the diagram/picture/pie chart, we can see that _____ is increasing in the past _____, while ____________________ is decreasing. (从整体上对事物发展的趋势作概括) 段落二:Possible reasons for this are as follows. (问题产生的原因) On the one hand, _______. (原因一) On the other hand, _______. (原因二) Furthermore, ___________. (原因三)段落三:From what has been analyzed, we can draw a conclusion that _______. (得出结论) As a matter of fact, with the improvements in _______, the trend will go on in the future. (提出改进的方法或措施) Therefore, ______. (最后再强调观点)模式B:段落一:The chart gives us an overall picture of the ______(图表主题). The first thing we notice is that__________(图表最大特点). This means that as __________, __________(进一步说明).段落二:We can see from the statistics given that ________(图表细节一). After ving_____(细节一中的第一个变化), the ___ Ved+幅度+时间(紧跟着的变化). The figures also tells us that___________(图表细节二). (数据位置,如In the second column), we can see that ____________accounts for _______(进一步描述).段落三:Judging from these figures, we can draw the conclusion that___________(结论). The reason for this, as far as I am concerned is that_____________(给出原因). / It is high time that (发出倡议)二.图表作文常用句型:第一段:The chart/diagram/table/graph shows/indicates/illustrates/reveals/points out that …According to the statistics/study/survey, it can be seen/learned/estimated/predicted that …In recent years, there has been a marked /dramatic/sharp/sudden/abrupt/remarkable increase in …In the past few years/decades, there has arisen a gradual/slow/ slight/steady decrease in …In the past few decades, … has been on the rise/decline.It has increased/risen/grown/climbed/soared from … to …It decreased/ fell/declined/dropped/went down from … to …There is an upward/downward trend of/that …A certain period of time/ A certain place has witnessed/seen the change in …the rise in …the drop/decline/fall in …The number is … times as much as that of …The figure has nearly doubled/tripled, as against/compared with that of last year.…amount to/add up to/come to/sum up to...…fluctuate/go up and down… remain level/stay the same/remain unchanged…… reach a peak at …… reach the bottom at …第二段:The reason why … is that …Many reasons account for this.This can be attributed to the following reasons.This results from the following factors.From what has been analyzed, we can draw/come to/arrive at the conclusion that …From the above analysis, we can safely conclude that …三.描写图表和数据的句型:1) …rank first (both) in... 2) …in proportion to... 3) A is by far the largest...4) The number is ...times as much as that of ... 6) It accounts for 35% of..5) The figure has nearly doubled/tripled, as against that of last year..7) By comparison with ..., it decreased/increased/fell from...to...8) ...rise rapidly(slowly) 9) ...remain level... 10) ...reach ...11)There is a slight/slow/steady/rapid rise/increase demand/income/ population/prices/production/decrease/decline/reduction/fall/drop in…12) …be on the increase/decrease/rise/decline (……在不断地增加,减少,上升,下降)四.练习:Translations1.我们可以从图表上看出:托雅的女生比例远远高于男生所占比例。
英语四级图表作文写作技巧
英语四级图表作文写作技巧图表作文是考研英语写作中较为常见的题型之一,也是难度较大的一种写作题型。
这类作文可综合提供题目、数据、图像、提纲,形式多样,但实际上只涉及5个方面:描述图表、指明寓意、分析原因、联系实际、给出建议,而每次考试只是从这5个方面的内容中选出3个结合在一起。
从写作类型来看,基本上属于说明文。
要求考生围绕题目将有关信息转化为文字形式,考生应该具有一定数据分析和材料归纳的能力,同时会运用一定的写作方法。
图表型作文同时也是大学英语四六级考试中常考的一个题型。
今天店铺要与大家分享的是:英语四级考试图表作文的写作技巧。
具体内容如下,欢迎参考阅读:对于图表型作文,考生可能没有太多实战经验,也不了解一些图表作文的常用词汇与句型,这些问题四六级专家老师都已经为大家考虑到了,下面老师为大家整理的图表作文写作技巧和常用句型及专业名词,讲解十分详细清晰,希望对考生的复习能有所帮助。
技巧一、直观描述图表内容由于图表作文不像提纲作文那样有写作提示和内容要求,所以写图表作文的第一步就是要考生描述图表最直观的内容。
针对不同的图表有不同的描述方式,比如:泛指一份数据图表一般用a data graph/chart/diagram/illustration/table、饼图用pie chart、直方图或柱形图用bar chart / histogram、趋势曲线图用line chart / curve diagram、表格图用table、流程图或过程图用flow chart / sequence diagram、程序图用processing/procedures diagram。
而常用的描述图表内容的句式类型很多,考生可以重点记忆一些常用的但是又不失新颖的句式,例如:As can be seen from the table/chart/diagram/graph/figures,table/chart/diagram/graph figures (that) …It is apparent from the figures/statistics、According to the table/chart diagram/graph等等。
大学英语四级图表类写作
So from the analysis, we can draw a conclusion that our society is progressing and people are living a bettler life than ever before. We are now able to purchase more delicious and nutritious food, resulting in an improvement in our health.
3. 上图所示为某校大学生平均每周使用计算机的时间:1990年(2hours),1995 年(4hours), 2000(20hours), 请描述变化:
4. 请说明发生这些变化的原因(可从计算机的用途、价格或社会发展等方面加以 说明)
5. 你认为目前大学生在计算机使用中有什么困难和问题。
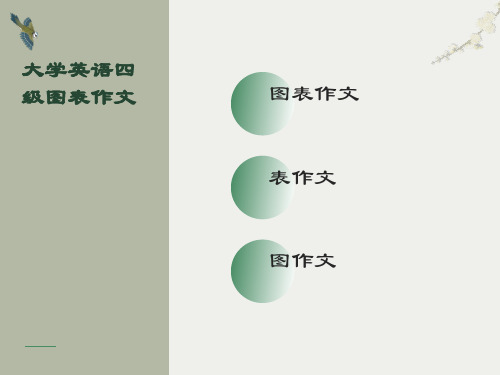
第一章节
0 第一季度 第二季度 第三季度 第四季度
东部 西部 北部
Bar graph
Pie chart
Line graph
Line graph
谋篇方法
一.先描写数据变化 二.再分析变化背后的原因 三.最后是笔者的个人看法,预测未来的发展趋势或提
出解决问题的方法。
如何写好图表作文
• 对比分析,寻找数据的变化规律 • 举例(1991.6)Changes in People’s Diet • Directions: • For this part, you are allowed 30 minutes to write a composition
table
一.State the changes in people’s diet(饮食)in the past five years;
四级英语写作:应用文写作(图表,漫画)

常用句式、词汇
• • • • • • • • • • • 1) 总括性描述 As can be seen from the table, great changes have been taking place in ... From the above table it can be seen that... As it is shown in the table,... According to the graph, ... It is clear from the table that ... The survey shows/suggests that ... According to the figures given in the table ... A study showed ... As you may see from the diagram,... The two charts above tell us something about ...
图表、图片作文写作步骤
Introduction
第一步 尽量用一句话把图表反映的问题或现象或趋势归 纳出来,放在开头表达清楚。 第二步 挑选有代表意义的数据点进行详细描述 第三步 回归传统作文
图表作文写作方法
开头写法
1. 对比分析,寻找数据的变化规律 图表作文通常要论述某个论点,因此,所提供的数据资料一 般都是有规律的.但这些数据是一些零散的信息,需要我们总结 和归纳.关键就是对比数据之间的关系,包括横向和纵向的比较 :从横向看,同一类(如事物A)数据随时间变化是升还是降,升降 的幅度多大;从纵向看,不同类别(如事物A、B、C)的变化是相 似还是相反,从中寻找规律. 以91.6 CET-4: Changes in People's Diet in China 为例( 表1).
2023年英语四级图表作文的类型及参考范文
您目前旳位置: 首页 > 英语四级 > 英语四级作文 > 英语四级作文综合辅导 > 正文英语四级图表作文旳类型及参照范文图表作文也是四(六)级考试中常见, 并且被认为是一种较难旳作文形式。
图表作文就是把非文字信息(一般为多种图表表达旳数字信息等)转换成文字信息旳一种作文。
它规定我们用文字来描述非文字性旳图表或对图表显示旳关系作解释阐明。
下面我们先来看一看图表作文旳类型。
第一节图表作文旳类型图表作文可分为两大类: 表作文和图作文。
表作文表格(Table)可以使大量数据系统化, 便于阅读、比较。
表格常由标题(Title)、表头(Boxhead)(表格旳第一行)、侧目(Stub)(表格左边旳第一列)和主体(Body)部分(表格旳其他部分)等部分构成。
如下表:用表格体现旳信息详细精确, 并且表格中旳各项均按一定规律排列。
阅读表格时要注意找出表格中各个项目旳互相关系, 表格中各个项目旳变化规律。
例如, 上面旳表格中旳数字阐明, 和1978年相比, 1983年大学入学旳人数在增长, 而小学旳入学人数在减少。
弄清晰这些变化规律也就读懂了表格旳内容。
图作文图作文又可分为三种: 圆形图作文、曲线图作文和条状图作文。
(1) 圆形图作文圆形图(Pie chart)也称为饼状图或圆面分割图。
圆形图由于比较形象和直观, 各部分空间大小差异轻易辨别, 因此常用来表达总量和各分量之间旳比例关系。
整个圆表达总量, 楔形块表达分量。
有时圆形图尚有数值表, 两者结合可把各分量表达得更精确、清晰。
例如:Thi.i..pi.char.o.th.averag.weekl.expenditur.o..famil.i.Grea.Britain.A.ca.b.se.fr o.th.chart.th.mai.expenditur.o.a.averag.Britis.famil.i.spen.o.food.whic.account. fo.25.o.it.tota.expenditure.Th.nex.tw.significan.expendin.item.ar.transpor.an.ho using.whic.ar.15.an.12.respectively.I.w.tak.int.accoun.clothin.an.footwear.whic. make.u.10%.th.fou.essential.o.life.tha.is.food.transport.housing.an.clothin.an.f ootwear.amoun.t.62.o.th.tota.expenditure.(2) 曲线图作文曲线图(Line graph)也称为线性图或坐标图。
大学英语四级图表写作
大学英语四级图表写作大学英语四级图表写作:如何准确传达数据信息在大学英语四级考试中,图表写作是必考题型之一。
考生需要具备良好的图表解读能力和语言表达能力,才能准确传达数据信息。
本文将为大家分享大学英语四级图表写作的技巧和注意事项,帮助大家提高图表写作水平。
一、理解图表类型在开始写作之前,考生需要了解不同的图表类型。
大学英语四级考试中常见的图表类型包括柱状图、饼图、曲线图和表格等。
每一种图表类型都有其特点和适用范围,考生需要根据题目要求选择合适的图表类型进行写作。
二、明确图表主题在开始写作之前,考生需要先明确图表的主题是关于什么的。
只有准确理解图表的主题,才能确定文章的中心思想。
在写作过程中,考生需要紧紧围绕主题展开论述,确保文章内容与主题密切相关。
三、关注数据变化图表中的数据变化是文章的重点。
考生需要认真观察数据变化,找出趋势和规律,然后对这些趋势和规律进行分析和解释。
在描述数据时,考生需要注意数据的准确性和语言的简洁性,避免夸大或歪曲事实。
四、注意语言表达在大学英语四级图表写作中,语言表达是非常重要的。
考生需要使用准确、简洁的语言描述图表中的数据信息。
在写作过程中,考生可以适当地使用一些连接词和过渡句,使文章更加流畅。
此外,考生还需要注意语法、拼写和标点等方面的错误,确保文章质量。
五、练习与总结最后,考生需要进行大量的练习,熟悉各种图表类型和写作技巧。
在练习过程中,考生可以发现自己存在的问题和不足,然后及时进行总结和改进。
只有通过不断的实践和反思,才能提高自己的图表写作能力。
总之,大学英语四级图表写作需要考生具备良好的图表解读能力和语言表达能力。
在写作过程中,考生需要准确理解图表类型、明确主题、关注数据变化、注意语言表达等方面的技巧和注意事项。
通过大量的练习和总结,相信大家一定可以写出优秀的图表作文。
大学英语四级图表作文写作大学英语四级图表作文写作在大学英语四级考试中,图表作文是一个重要的考点。
四级英语图表作文整理
关于英语四级图表作文整理图表作文也是四(六)级考试中常见,而且被认为是一种较难的作文形式。
图表作文就是把非文字信息(通常为各种图表表示的数字信息等)转换成文字信息的一种作文。
它要求我们用文字来描述非文字性的图表或对图表显示的关系作解释说明。
图表作文的类型(表作文和图作文)表作文表格(Table)可以使大量数据系统化,便于阅读、比较。
表格常由标题、表头(表格的第一行)、侧目(Stub)(表格左边的第一列)和主体(Body)部分(表格的其余部分)等部分组成。
用表格表达的信息具体准确,而且表格中的各项均按一定规律排列。
阅读表格时要注意找出表格中各个项目的相互关系,表格中各个项目的变化规律。
图作文图作文又可分为三种(圆形图作文、曲线图作文和条状图作文)图表作文的写作要领图表作文着重说明事实,常常是通过对图表中所反映的具体数据的说明、分析、比较,对某种事物或现象的事实或变化情况等加以说明,并提出结论或看法。
因此,图表作文常常采用议论文体的写作方法。
写好图表作文,关键在于能否读懂图表中所提供的信息,把握各信息间的联系,用准确流畅的语言把这一信息表达出来,并就这一信息发表自己的看发。
图表作文的写作步骤写图表作文时,要注意遵循以下步骤:1)认真分析图表的含义,弄清图表中所含的信息及不同信息间的关系;2)确定文章的主题思想,构思出文章的基本框架,筛选出能说明图表主题思想的典型数据;3)编列文章的提纲;4)根据文章的提纲,将各段的提纲内容扩展成段落,然后将各个段落组成文章,注意段与段之间的衔接与过渡;5)检查与修改。
图表作文的篇章结构写图表作文时,常采用三段式的谋篇方式。
第一段:概述图表反映的主题思想第二段:分析产生的原因第三段:展望未来或提出方法或建议图表作文常用的句型(1)常用的开篇句型(即概述图表内容时常用的表达法)① According to the table/pie chart/line graph/bar graph, we can see/conclude that …根据该表/图,我们可知……② The table/graph reveals (shows/indicates/illustrates/ represents/points out) that …该表/图表明……③ As we can see from the table …As can be seen from the line/bar graph …As is shown (illustrated/indicated) in the pie chart …(2) 描述增减变化常用的句型① Compared with … is still increased by …② The number of … grew/rose from … to …③ An increase is shown in …; then came a sharp increase of …④ In … the number remains the same/drops to …⑤ There was a very slight (small/slow/gradual) rise/increase in 1990.⑥ There was a very steady (marked/sharp/rapid/sudden/ dramatic) drop (decrease/decline/fall/reduction) in 1998/ compared with that of last year).图表作文的模式Eg.1段落一:According to the figures given in the diagram/picture/pie chart, we can see that ________________________ is increasing in the past__________________________, while ________________________________ is decreasing. (从整体上对事物发展的趋势作概括)段落二:Possible reasons for this are as follows. (问题产生的原因) On the one hand, _____________________________________________________. (原因一) On the other hand, __________________________________________________________________. (原因二) Furthermore, _________________________________________________. (原因三)段落三: From what has been analyzed, we can draw a conclusion that ________________________________. (得出结论) As a matter of fact, with the improvements in ____________________________, the trend will go on in the future. (提出改进的方法或措施) Therefore,________________________________. (最后再强调观点)Eg.2段落一:The chart gives us an overall picture of the ____________(图表主题). The first thing we notice is that_______________(图表最大特点).This means that as __________, _________________(进一步说明).段落二:We can see from the statistics given that _______________(图表细节一). After ving_________(细节一中的第一个变化), the _____Ved+幅度+时间(紧跟着的变化). The figures also tells usthat_________________________(图表细节二). (数据位置,如In the secondcolumn), we can see that ____________accounts for _______(进一步描述).段落三:Judging from these figures, we can draw the conclusion that___________(结论). The reason for this, as far as I am concerned isthat_____________(给出原因). / It is high time that (发出倡议)下面我们来看一篇范文⑴From the graph, we can see that the number of car accidents in Walton city fluctuated during the year of 1990. ⑵The first two months of 1990 showed an increasing trend. ⑶The rate rose to 32 in March but fell to 26 in June. ⑷From June on, the rate was rising again and reached the peak point 39 in August. ⑸After August the rate began to decline remarkably, and eventually dropped to the lowest point 16 at the end of the year. ⑹Therefore, it’s obvious that car accident in Walton city declined in 1990.⑴主题句/概述表格反映的内容⑵—(5)反映交通事故的变化情况(6)小结:总结表格数据反映的总趋势⑺There are several reasons for the decline. ⑻First, a new traffic law was made and came into force. ⑼It provided that in summer every car must be air-conditioned. ⑽As a result, the highest rate in August, when humidity and high temperature make drivers impatient and easily lead to car accidents, dropped steadily. ⑾Second, new roads were built and some narrow streets were widened, which quickened the flow of traffic. ⑿Finally, the city administration made great efforts to heighten people’s awareness of observing traffic rules.⑺主题句⑻原因/措施一⑼解释措施一/次要辅助⑽采取措施一后的结果⑾原因/措施二⑿原因/措施三⒀With all these new measures, I’m sure the rate of car accidents in Walton city will go on falling this year.⒀总结:展望未来的情况此外在写作的时候还应该适当的运用一些高级词汇,大家都懂得,我不必多说啦!!注:时间仓促,忙着考试,大家理解一下哈!!只是简略的整理了一下,我个人觉得这些差不多了。
图表类英语作文四六级模板
图表类英语作文四六级模板Title: Interpreting the Chart: A Closer Look at the Data.In the realm of data analysis, charts and graphs play a pivotal role in conveying complex information in a visually appealing and comprehensible manner. They enable us to identify patterns, trends, and outliers, all of which are crucial for informed decision-making. In this article, we will delve into the intricacies of chart interpretation, focusing on the key elements that make up a chart and the techniques we can employ to extract meaningful insights from it.The first step in chart interpretation is understanding the basic components of a chart. Any chart, whether it's a bar chart, line chart, pie chart, or scatter plot,typically consists of the following elements:1. Title: The title provides a concise overview of thechart's contents, giving readers a general idea of what they are about to see.2. Axes: The axes represent the variables being measured. The horizontal axis, usually labeled as the 'x-axis', represents the independent variable, while the vertical axis, labeled as the 'y-axis', represents the dependent variable.3. Legends: Legends are used to identify different data series in a chart. They are especially helpful when a chart displays multiple data sets.4. Data Points: These are the actual numerical values represented visually in the chart. They are the building blocks of any chart and form the basis for analysis.Once you are familiar with these basic components, you can move on to the next step: analyzing the data. Here are some techniques that can help you extract meaningful insights from a chart:1. Identify Trends: Look for patterns or trends in the data. For example, in a line chart, you might notice that a particular data series is consistently increasing or decreasing over time. Such trends can provide valuable insights into the underlying dynamics of the phenomenon being studied.2. Compare Data Sets: If the chart displays multiple data sets, compare them to identify any differences or similarities. Look for outliers, or data points that stand out from the rest, as they can often provide valuable insights.3. Analyze Relationships: In scatter plots, analyze the relationship between two variables. Look for patterns in the distribution of data points to determine whether there is a positive, negative, or no correlation between the variables.4. Quantify Changes: Use the axes to quantify changes in the data. For example, in a bar chart, the length of each bar represents the magnitude of the change in thecorresponding data category. By comparing the lengths of different bars, you can easily identify which categories have experienced the most significant changes.5. Consider Context: Always remember to consider the context of the data when interpreting charts. The meaning of a particular data point or trend might vary depending on the context in which it is presented.In conclusion, chart interpretation is a crucial skill for anyone working with data. By understanding the basic components of a chart and employing effective analysis techniques, you can extract meaningful insights from complex datasets and make informed decisions based on evidence-based analysis. With practice and experience, you will become more proficient at chart interpretation and able to extract valuable insights from even the most complex charts.。
- 1、下载文档前请自行甄别文档内容的完整性,平台不提供额外的编辑、内容补充、找答案等附加服务。
- 2、"仅部分预览"的文档,不可在线预览部分如存在完整性等问题,可反馈申请退款(可完整预览的文档不适用该条件!)。
- 3、如文档侵犯您的权益,请联系客服反馈,我们会尽快为您处理(人工客服工作时间:9:00-18:30)。
四/六级作文辅导(三)
图表文写作
一.常用句型(Structure/Sentence Pattern)
第一段: From the graph,we know the statistics of...(图表概况)
It can easily be seen that...(揭示含义)
第二段:There are many reasons responsible for this instance,and the following are the typical ones.For one thing,…(理由一)in addition,...(理由二)The main reason is
that...(理由三)
第三段:However,this graph may not predict the entire situation in the future.I believe...(前景预测)/Above all,we now know about the problem and we should try to find some
ways to solve it . For one thing,...(方法一)For another thing,...(方法二)Still
another,...(方法三)
常用句式
(1) The picture shows...
(2) This table shows the differences(the trend toward).., between
(3) The diagram represents...
(4) As can be seen from the chart...
(5) This is an illustration of (a typical example of )...
(6) There was a great (slight, marked)increase(rise)...
(7) There has been a sudden(slow, rapid)fall(drop)...
(8) It is 20% percent lower (higher)than...
(9) It doubles (trebles) the number (percentage) of ...
(10) From the table we can see...
二.四级题例:
三.练习题 Model Test Two
Part I Writing (30 minutes)
Directions: For this part, you are allowed 30 minutes to write a Composition on a Chart to describe and analyze
the changes in the students ’ using mobile phones in recent years. You should write at least 120 words following the outline given below in English:
(Please read the following chart, describe the changes and analyze the causes, and predict your expectation on students ’ using mobile phones.)
The Changes in the Students ’ Using Mobile Phones
year
percentage
From this chart, we can see clearly the dramatic increase of mobile phones in China in recent years. In 2000, the possession of mobile phones was only 20 percent, and in 2002, it rose to 45 percent, which was more than doubled ; while in 2005, it amazingly soared to 95 percent, which was more than 4 times that of 2000.
There are various reasons accounting for this booming phenomenon. First of all, mobile phones facilitate us to communicate with one another in the information age. Whenever and wherever we are, we can keep in touch with each other and get the latest information with mobile phones. Secondly, the price of mobile phones has been decreasing and the capacity of production of the mobile phones has been enhanced all the time accompanied by the upgrading of the electrical technology. Finally , the functions of mobile phones are so many that we can use them to perform different kinds of tasks to meet our individual needs. Besides receiving and sending information, we can surf the Internet to search for what we want and play games. It is the multi-functions of mobile phones that make them so popular among us.
In spite of the advantages mentioned above, the existing problems in using mobile phones can never be ignored. Firstly, it is still expensive and costly for a certain portion of ordinary students, who are mainly dependent on their parents. Secondly, the micro-waves of mobile phones are harmful to people ’s health. Finally some students spend so much time on playing with mobile phones that they are distracted from studies. However, all this is not the fault of mobile phones themselves. Great importance should be attached to the proper use of mobile phones and the prospects of mobile phones are definitely bright and hopeful.。