and Greenland During the Last Glacial Period
地球的不同圈层英文版
Water Vapour Ice Refer to website: http://www.accd.e du/sac/astrono m/astr1370/gla cial.htm
Atmosphere Hydrosphere Lithosphere
Weather Dynamics Unit Science 10
Spheres of the Earth
Hydrosphere
All of the water on planet Earth “71% of the earth is covered by water and only 29% is terra firma” (University of Florida). “Blue Planet” – water is not found on any other planets in our solar system. “It is because the Earth has just the right mass, the right chemical composition, the right atmosphere, and is the right distance from the Sun (the "Goldilocks" principle) that permits water to exist mainly as a liquid” (U of F).
Source: University of Florida Geosphere
/wiki/Image:Tectonic_plates.png
长难句1-11
Exercise 1 Analyze the Long Sentences:C6 p68-691. When an organisation is shrinking, the best and most mobile workers are prone to leave voluntarily. Unfortunately, they are the ones the organisation can least afford to lose --- those with the highest skills and experience.当企业衰退时,流动性最强的优秀员工就会主动离开。
不幸的是,这些才能出众、经验丰富的员工正是企业最不能失去的人才。
2. There is an abundance of evidence to support the motivational benefits that result from carefully matching people to jobs.大量证据表明,切实做到人尽其才能够激发工作动力。
3. High achievers will do best when the job provides moderately challenging goals and where there is independence and feedback.只有当职位能够提供具有一定挑战性的目标、让他们享有独立性并提供反馈时,业绩杰出者才会全力以赴地工作。
4. For those with high achievement needs, typically a minority in any organisation, the existence of external goals is less important because high achievers are already internally motivated.追求卓越成就的人是所有企业中典型的少数群体,对于他们而言,外部目标的存在并不十分重要,因为业绩杰出者已具有极强的内在动机。
加拿大中英文双语介绍

世界上福利最好的国家——加拿大加拿大-全球最适宜居住的国家据联合国发表的报告,加拿大在就业水平、人均国民生产总值、收入、教育及卫生水平等综合指标在全球160多个国家中名列第一。
优美的自然环境和安全先进的生活方式加拿大位于北美洲的北半部,总面积997万平方公里,仅次于俄罗斯,是世界第二大国。
人口2900多万,是世界上平均人口密度最低的国家之一,每3人占有一平方公里的土地。
89%的土地没有永久性居民点。
南部与美国为邻约5000公里,石油、矿产、木材、海产、水利资源十分丰富。
加拿大四季分明,西面受太平洋季风的影响,四季宜人春季郁金香花争艳,夏季阳光明媚,秋季枫叶层林尽染,冬季万里雪飘,极具风情。
加拿大是由十个省和两个地区组成的联邦国家。
民族构成一英裔、法裔、荷兰裔、德裔、波兰裔和华裔。
官方语言为英语和法语。
加拿大有26个人口超过10万的市区和3个人口超过100万的城市。
其中不少是北美洲最安全、最清洁、风光最美的市中心区。
加拿大城市的严重犯罪率不到美国城市的一半。
更为人称道的是多个不同种族的人们在一个国际性的环境中和睦相处。
政府和工业界致力保持空气和食品的清洁,共同努力维护健康的环境。
加拿大的城市都有高素质的歌剧院、乐团和舞蹈团、美术馆、博物馆以及公共图书馆。
加拿大城市有国际著名的芭蕾舞团、歌剧团和交响乐团。
同时亦经常邀请世界各国最优秀的艺术家到访演出。
加拿大政府对艺术的人均补助位于世界前列。
加拿大的城市融合了欧洲、亚洲、拉丁美洲和非洲的各种文化。
例如,温哥华是众多的亚裔人聚居之地;多伦多融合了欧、亚及其他文化;魁北克则为北美洲添上一份英、法双语的欧洲风味。
加拿大的气候各地不一,往往令预计天气较冷的访客诧异。
全国绝大多数人口聚居在离美国边境250公里以内的地区,而加拿大最南部的地区与美国加州北部处于同一纬度。
因此,加拿大各大城市的气候多数与美国北部或北欧地区相似。
加拿大的城镇提供舒适的生活设施,但是与其他国际性商业中心相比,生活费用确保持在很容易负担的水平上。
6 冰芯研究--过去的全球变化

超பைடு நூலகம்钻的主要冰芯钻探
E04 The flag line with clouds rolling in. Skyerne ruller ind over lejren. Photo: Sune Olander Rasmussen
Camp Crete, 1974. The first tower in the background was for the thermal drill; the next tower to the rear was for the radar reflector to enable aircraft to locate the site in the middle of the ice sheet.
Camp Milcent, 1973. The polyethylene-covered 100 KW generator shelter in the foreground was used for thermal drilling and other camp power needs. Waste heat from the generator provided the camp water supply.
The drill has just surfaced 冰芯被提上地表 2009
Pictures from the NEEM field campaign. Photos can be used freely with clear reference to the source: Photo: NEEM ice core drilling project, www.neem.ku.dk.
托福TPO19阅读Passage3原文文本+题目+答案解析

¡¡¡¡ÎªÁË°ïÖú´ó¼Ò¸ßЧ±¸¿¼Íи££¬Îª´ó¼Ò´øÀ´Íи£TPO19ÔĶÁPassage3Ô-ÎÄÎı¾+ÌâÄ¿+´ð°¸½âÎö£¬Ï£Íû¶Ô´ó¼Ò±¸¿¼ÓÐËù°ïÖú¡£¡¡¡¡¨ Íи£TPO19ÔĶÁPassage3Ô-ÎÄÎı¾£º¡¡¡¡Discovering the Ice Ages¡¡¡¡In the middle of the nineteenth century, Louis Agassiz, one of the first scientists to study glaciers, immigrated to the United States from Switzerland and became a professor at Harvard University, where he continued his studies in geology and other sciences. For his research, Agassiz visited many places in the northern parts of Europe and North America, from the mountains of Scandinavia and New England to the rolling hills of the American Midwest. In all these diverse regions, Agassiz saw signs of glacial erosion and sedimentation. In flat plains country, he saw moraines (accumulations of earth and loose rock that form at the edges of glaciers) that reminded him of the terminal moraines found at the end of valley glaciers in the Alps. The heterogeneous material of the drift (sand, clay, and rocks deposited there) convinced him of its glacial origin.¡¡¡¡The areas covered by this material were so vast that the ice that deposited it must have been a continental glacier larger than Greenland or Antarctica. Eventually, Agassiz and others convinced geologists and the general public that a great continental glaciation had extended the polar ice caps far into regions that now enjoy temperate climates. For the first time, people began to talk about ice ages. It was also apparent that the glaciation occurred in the relatively recent past because the drift was soft, like freshly deposited sediment. We now know the age of the glaciation accurately from radiometric dating of the carbon-14 in logs buried in the drift. The drift of the last glaciation was deposited during one of the most recent epochs of geologic time, the Pleistocene, which lasted from 1.8 million to 10,000 years ago. Along the east coast of the United States, the southernmost advance of this ice is recorded by the enormous sand and drift deposits of the terminal moraines that form Long Island and Cape Cod.¡¡¡¡It soon became clear that there were multiple glacial ages during the Pleistocene, with warmer interglacial intervals between them. As geologists mapped glacial deposits in the late nineteenth century, they became aware that there were several layers of drift, the lower ones corresponding to earlier ice ages. Between the older layers of glacial material were well-developed soils containing fossils of warm-climate plants. These soils were evidence that the glaciers retreated as the climate warmed. By the early part of the twentieth century, scientists believed that four distinct glaciations had affected North America and Europe during the Pleistocene epoch.¡¡¡¡This idea was modified in the late twentieth century, when geologists and oceanographers examining oceanic sediment found fossil evidence of warming and coolingof the oceans. Ocean sediments presented a much more complete geologic record of the Pleistocene than continental glacial deposits did. The fossils buried in Pleistocene and earlier ocean sediments were of foraminifera¡ªsmall, single-celled marine organisms that secrete shells of calcium carbonate, or calcite. These shells differ in their proportion of ordinary oxygen (oxygen-16) and the heavy oxygen isotope (oxygen-18). The ratio of oxygen-16 to oxygen-18 found in the calcite of a foraminifer's shell depends on the temperature of the water in which the organism lived. Different ratios in the shells preserved in various layers of sediment reveal the temperature changes in the oceans during the Pleistocene epoch.¡¡¡¡Isotopic analysis of shells allowed geologists to measure another glacial effect. They could trace the growth and shrinkage of continental glaciers, even in parts of the ocean where there may have been no great change in temperature¡ªaround the equator, for example. The oxygen isotope ratio of the ocean changes as a great deal of water is withdrawn from it by evaporation and is precipitated as snow to form glacial ice. During glaciations, the lighter oxygen-16 has a greater tendency to evaporate from the ocean surface than the heavier oxygen-18 does. Thus, more of the heavy isotope is left behind in the ocean and absorbed by marine organisms. From this analysis of marine sediments, geologists have learned that there were many shorter, more regular cycles of glaciation and deglaciation than geologists had recognized from the glacial drift of the continents alone.¡¡¡¡Paragraph 1: In the middle of the nineteenth century, Louis Agassiz, one of the first scientists to study glaciers, immigrated to the United States from Switzerland and became a professor at Harvard University, where he continued his studies in geology and other sciences. For his research, Agassiz visited many places in the northern parts of Europe and North America, from the mountains of Scandinavia and New England to the rolling hills of the American Midwest. In all these diverse regions, Agassiz saw signs of glacial erosion and sedimentation. In flat plains country, he saw moraines (accumulations of earth and loose rock that form at the edges of glaciers) that reminded him of the terminal moraines found at the end of valley glaciers in the Alps. The heterogeneous material of the drift (sand, clay, and rocks deposited there) convinced him of its glacial origin.¡¡¡¡¨ Íи£TPO19ÔĶÁPassage3ÌâÄ¿£º¡¡¡¡1. The word ¡°accumulations¡± in the passage is closest in meaning to¡¡¡¡O signs¡¡¡¡O pieces¡¡¡¡O types。
剑桥雅思阅读解析8(test2)
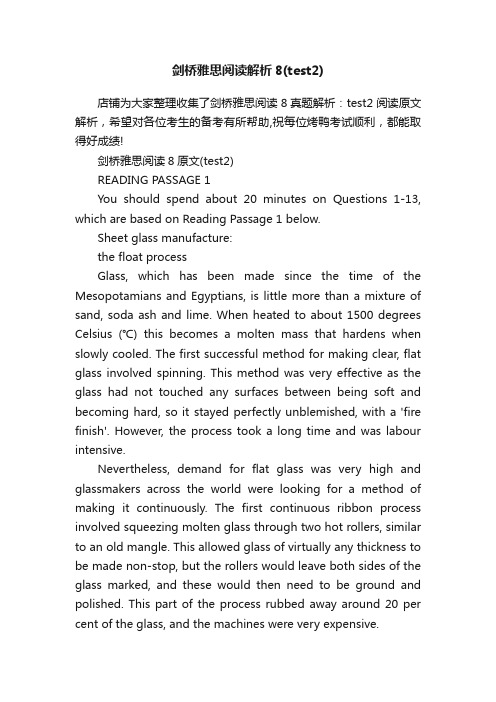
剑桥雅思阅读解析8(test2)店铺为大家整理收集了剑桥雅思阅读8真题解析:test2阅读原文解析,希望对各位考生的备考有所帮助,祝每位烤鸭考试顺利,都能取得好成绩!剑桥雅思阅读8原文(test2)READING PASSAGE 1You should spend about 20 minutes on Questions 1-13, which are based on Reading Passage 1 below.Sheet glass manufacture:the float processGlass, which has been made since the time of the Mesopotamians and Egyptians, is little more than a mixture of sand, soda ash and lime. When heated to about 1500 degrees Celsius (℃) this becomes a molten mass that hardens when slowly cooled. The first successful method for making clear, flat glass involved spinning. This method was very effective as the glass had not touched any surfaces between being soft and becoming hard, so it stayed perfectly unblemished, with a 'fire finish'. However, the process took a long time and was labour intensive.Nevertheless, demand for flat glass was very high and glassmakers across the world were looking for a method of making it continuously. The first continuous ribbon process involved squeezing molten glass through two hot rollers, similar to an old mangle. This allowed glass of virtually any thickness to be made non-stop, but the rollers would leave both sides of the glass marked, and these would then need to be ground and polished. This part of the process rubbed away around 20 per cent of the glass, and the machines were very expensive.The float process for making flat glass was invented by Alistair Pilkington. This process allows the manufacture of clear, tinted and coated glass for buildings, and clear and tinted glass for vehicles. Pilkington had been experimenting with improving the melting process, and in 1952 he had the idea of using a bed of molten metal to form the flat glass, eliminating altogether the need for rollers within the float bath. The metal had to melt at a temperature less than the hardening point of glass (about 600℃), but could not boil at a temperature below the temperature of the molten glass (about 1500℃). The best meta l for the job was tin.The rest of the concept relied on gravity, which guaranteed that the surface of the molten metal was perfectly flat and horizontal. Consequently, when pouring molten glass onto the molten tin, the underside of the glass would also be perfectly flat. If the glass were kept hot enough, it would flow over the molten tin until the top surface was also flat, horizontal and perfectly parallel to the bottom surface. Once the glass cooled to 604℃ or less it was too hard to mark and could be transported out of the cooling zone by rollers. The glass settled to a thickness of six millimetres because of surface tension interactions between the glass and the tin. By fortunate coincidence, 60 per cent of the flat glass market at that time was for six-millimetre glass.Pilkington built a pilot plant in 1953 and by 1955 he had convinced his company to build a full-scale plant. However, it took 14 months of non-stop production, costing the company £100,000 a month, before the plant produced any usable glass. Furthermore, once they succeeded in making marketable flat glass, the machine was turned off for a service to prepare it for years of continuous production. When it started up again it took another four months to get the process right again. They finallysucceeded in 1959 and there are now float plants all over the world, with each able to produce around 1000 tons of glass every day, non-stop for around 15 years.Float plants today make glass of near optical quality. Several processes —melting, refining, homogenising —take place simultaneously in the 2000 tonnes of molten glass in the furnace. They occur in separate zones in a complex glass flow driven by high temperatures. It adds up to a continuous melting process, lasting as long as 50 hours, that delivers glass smoothly and continuously to the float bath, and from there to a coating zone and finally a heat treatment zone, where stresses formed during cooling are relieved.The principle of float glass is unchanged since the 1950s. However, the product has changed dramatically, from a single thickness of 6.8 mm to a range from sub-millimetre to 25 mm, from a ribbon frequently marred by inclusions and bubbles to almost optical perfection. To ensure the highest quality, inspection takes place at every stage. Occasionally, a bubble is not removed during refining, a sand grain refuses to melt, a tremor in the tin puts ripples into the glass ribbon. Automated on-line inspection does two things. Firstly, it reveals process faults upstream that can be corrected. Inspection technology allows more than 100 million measurements a second to be made across the ribbon, locating flaws the unaided eye would be unable to see. Secondly, it enables computers downstream to steer cutters around flaws.Float glass is sold by the square metre, and at the final stage computers translate customer requirements into patterns of cuts designed to minimise waste.Questions 1-8Complete the table and diagram below.Choose NO MORE THAN TWO WORDS from the passage for each answer.Write your answers in boxes 1-8 on your answer sheet.Early methods of producing flat glassMethod Advantages Disadvantages1............Glass remained2........... ? Slow3.............RibbonCould produce glass sheets of varying 4.............non-stop process ? Glass was 5...........20% of glass rubbed awayMachines were expensive图片11Questions 9-13Do the following statements agree with the information given in Reading Passage 1?In boxes 9-13 on your answer sheet, writeTRUE if the statement agrees with the informationFALSE if the statement contradicts the informationNOT GIVEN if there is no information on this9 The metal used in the float process had to have specific properties.10 Pilkington invested some of his own money in his float plant.11 Pilkington’s first full-scale plant was an instant commercial success.12 The process invented by Pilkington has now beenimproved.13 Computers are better than humans at detecting faults in glass.READING PASSAGE 2You should spend about 20 minutes on Questions 14-26, which are based on Reading Passage 2 on the following pages.Question 14-17Reading passage 2 has six paragraphs, A-F.Choose the correct heading for paragraphs B and D-F from the list of headings below.Write the correct number, i-ix, in boxes 14-17 on your answer sheet.List of Headingsi Predicting climatic changesii The relevance of the Little Ice Age todayiii How cities contribute to climate change.iv Human impact on the climatev How past climatic conditions can be determinedvi A growing need for weather recordsvii A study covering a thousand yearsviii People have always responded to climate changeix Enough food at lastExample AnswerParagraph A Viii14 Paragraph BExample AnswerParagraph C V15 Paragraph D16 Paragraph E17 Paragraph FTHE LITTLE ICE AGEA This book will provide a detailed examination of the Little Ice Age and other climatic shifts, but, before I embark on that, let me provide a historical context. We tend to think of climate — as opposed to weather — as something unchanging, yet humanity has been at the mercy of climate change for its entire existence, with at least eight glacial episodes in the past 730,000 years. Our ancestors adapted to the universal but irregular global warming since the end of the last great Ice Age, around 10,000 years ago, with dazzling opportunism. They developed strategies for surviving harsh drought cycles, decades of heavy rainfall or unaccustomed cold; adopted agriculture and stock-raising, which revolutionised human life; and founded the world's first pre-industrial civilisations in Egypt, Mesopotamia and the Americas. But the price of sudden climate change, in famine, disease and suffering, was often high.B The Little Ice Age lasted from roughly 1300 until the middle of the nineteenth century. Only two centuries ago, Europe experienced a cycle of bitterly cold winters; mountain glaciers in the Swiss Alps were the lowest in recorded memory, and pack ice surrounded Iceland for much of the year. The climatic events of the Little Ice Age did more than help shape the modern world. They are the deeply important context for the current unprecedented global warming. The Little Ice Age was far from a deep freeze, however; rather an irregular seesaw of rapid climatic shifts, few lasting more than a quarter-century, driven by complex and still little understood interactions between the atmosphere and the ocean. The seesaw brought cycles of intensely cold winters and easterly winds, then switched abruptly to years of heavy spring and early summer rains, mild winters,and frequent Atlantic storms, or to periods of droughts, light northeasterly winds, and summer heat waves.C Reconstructing the climate changes of the past is extremely difficult, because systematic weather observations began only a few centuries ago, in Europe and North America. Records from India and tropical Africa are even more recent. For the time before records began, we have only 'proxy records' reconstructed largely from tree rings and ice cores, supplemented by a few incomplete written accounts. We now have hundreds of tree-ring records from throughout the northern hemisphere, and many from south of the equator, too, amplified with a growing body of temperature data from ice cores drilled in Antarctica, Greenland, the Peruvian Andes, and other locations, we are close to a knowledge of annual summer and winter temperature variations over much of the northern hemisphere going back 600 years.D This book is a narrative history of climatic shifts during the past ten centuries, and some of the ways in which people in Europe adapted to them. Part One describes the Medieval Warm Period, roughly 900 to 1200. During these three centuries, Norse voyagers from Northern Europe explored northern seas, settled Greenland, and visited North America. It was not a time of uniform warmth, for then, as always since the Great Ice Age, there were constant shifts in rainfall and temperature. Mean European temperatures were about the same as today, perhaps slightly cooler.E It is known that the Little Ice Age cooling began in Greenland and the Arctic in about 1200. As the Arctic ice pack spread southward, Norse voyages to the west were rerouted into the open Atlantic, then ended altogether. Storminess increased in the North Atlantic and North Sea. Colder, much wetter weatherdescended on Europe between 1315 and 1319, when thousands perished in a continent-wide famine. By 1400, the weather had become decidedly more unpredictable and stormier, with sudden shifts and lower temperatures that culminated in the cold decades of the late sixteenth century. Fish were a vital commodity in growing towns and cities, where food supplies were a constant concern. Dried cod and herring were already the staples of the European fish trade, but changes in water temperatures forced fishing fleets to work further offshore. The Basques, Dutch, and English developed the first offshore fishing boats adapted to a colder and stormier Atlantic. A gradual agricultural revolution in northern Europe stemmed from concerns over food supplies at a time of rising populations. The revolution involved intensive commercial farming and the growing of animal fodder on land not previously used for crops. The increased productivity from farmland made some countries self-sufficient in grain and livestock and offered effective protection against famine.F Global temperatures began to rise slowly after 1850, with the beginning of the Modern Warm Period. There was a vast migration from Europe by land-hungry farmers and others, to which the famine caused by the Irish potato blight contributed, to North America, Australia, New Zealand, and southern Africa. Millions of hectares of forest and woodland fell before the newcomers' axes between 1850 and 1890, as intensive European farming methods expanded across the world. The unprecedented land clearance released vast quantities of carbon dioxide into the atmosphere, triggering for the first time humanly caused global warming. Temperatures climbed more rapidly in the twentieth century as the use of fossil fuels proliferated and greenhouse gas levels continued to soar. The rise has been even steeper since theearly 1980s. The Little Ice Age has given way to a new climatic regime, marked by prolonged and steady warming. At the same time, extreme weather events like Category 5 hurricanes are becoming more frequent.Questions 18-22Complete the summary using the list of words, A-I, below.Write the correct letter, A-I, in boxes 18-22 on your answer sheet.Weather during the Little Ice AgeDocumentation of past weather conditions is limited: our main sources of knowledge of conditions in the distant past are 18...........and 19.................. We can deduce that the Little Ice Age was a time of 20.............. , rather than of consistent freezing. Within it there were some periods of very cold winters, other of 21...............and heavy rain, and yet others that saw 22................with no rain at all.A climatic shiftsB ice coresC tree ringsD glaciersE interactionsF weather observationsG heat waves H storms I written accountsQuestions 23-26Classify the following events as occurring during theA Medieval Warm PeriodB Little Ice AgeC Modern Warm PeriodWrite the correct letter, A, B or C, in boxes 23-26 on your answer sheet.23 Many Europeans started farming abroad.24 The cutting down of trees began to affect the climate.25 Europeans discovered other lands.26 Changes took place in fishing patterns.READING PASSAGE 3You should spend about 20 minutes on Questions 27-40, which are based on Reading Passage 3 on the following pages.Questions 27-32Reading Passage 3 has six paragraphs, A-F.Choose the correct heading for each paragraph from the list of headings below.Write the correct number, i-viii, in boxes 27-32 on your answer sheet.List of Headingsi The difficulties of talking about smellsii The role of smell in personal relationshipsiii Future studies into smelliv The relationship between the brain and the nosev The interpretation of smells as a factor in defining groups vi Why our sense of smell is not appreciatedvii Smell is our superior senseviii The relationship between smell and feelings27 paragraph A28 paragraph B29 paragraph C30 paragraph D31 paragraph E32 paragraph FThe meaning and power of smellThe sense of smell, or olfaction, is powerful. Odours affect us on a physical, psychological and social level. For the most part, however, we breathe in the aromas which surround us without being consciously aware of their importance to us. It is only when the faculty of smell is impaired for some reason that we begin torealise the essential role the sense of smell plays in our sense of well-beingA A survey conducted by Anthony Synott at Montreal's Concordia University asked participants to comment on how important smell was to them in their lives. It became apparent that smell can evoke strong emotional responses. A scent associated with a good experience can bring a rush of joy, while a foul odour or one associated with a bad memory may make us grimace with disgust. Respondents to the survey noted that many of their olfactory likes and dislikes were based on emotional associations. Such associations can be powerful enough so that odours that we would generally label unpleasant become agreeable, and those that we would generally consider fragrant become disagreeable for particular individuals. The perception of smell, therefore, consists not only of the sensation of the odours themselves, but of the experiences and emotions associated with them.B Odours are also essential cues in social bonding. One respondent to the survey believed that there is no true emotional bonding without touching and smelling a loved one. In fact, infants recognise the odours of their mothers soon after birth and adults can often identify their children or spouses by scent. In one well-known test, women and men were able to distinguish by smell alone clothing worn by their marriage partners from similar clothing worn by other people. Most of the subjects would probably never have given much thought to odour as a cue for identifying family members before being involved in the test, but as the experiment revealed, even when not consciously considered, smells register.C In spite of its importance to our emotional and sensorylives, smell is probably the most undervalued sense in many cultures. The reason often given for the low regard in which smell is held is that, in comparison with its importance among animals, the human sense of smell is feeble and undeveloped. While it is true that the olfactory powers of humans are nothing like as fine as those possessed by certain animals, they are still remarkably acute. Our noses are able to recognise thousands of smells, and to perceive odours which are present only in extremely small quantities.D Smell, however, is a highly elusive phenomenon. Odours, unlike colours, for instance, cannot be named in many languages because the specific vocabulary simply doesn't exist. ‘It smells like…,’ we have to say when describing an odour, struggling to express our olfactory experience. Nor can odours be recorded: there is no effective way to either capture or store them over time. In the realm of olfaction, we must make do with descriptions and recollections. This has implications for olfactory research.E Most of the research on smell undertaken to date has been of a physical scientific nature. Significant advances have been made in the understanding of the biological and chemical nature of olfaction, but many fundamental questions have yet to be answered. Researchers have still to decide whether smell is one sense or two — one responding to odours proper and the other registering odourless chemicals in the air. Other unanswered questions are whether the nose is the only part of the body affected by odours, and how smells can be measured objectively given the non-physical components. Questions like these mean that interest in the psychology of smell is inevitably set to play an increasingly important role for researchers.F However, smell is not simply a biological and psychologicalphenomenon. Smell is cultural, hence it is a social and historical phenomenon. Odours are invested with cultural values: smells that are considered to be offensive in some cultures may be perfectly acceptable in others. Therefore, our sense of smell is a means of, and model for, interacting with the world. Different smells can provide us with intimate and emotionally charged experiences and the value that we attach to these experiences is interiorised by the members of society in a deeply personal way. Importantly, our commonly held feelings about smells can help distinguish us from other cultures. The study of the cultural history of smell is, therefore, in a very real sense, an investigation into the essence of human culture.Questions 33-36Choose the correct letter, A, B, C or D.Write the correct letter in boxes 33-36 on your answer sheet.33 According to the introduction, we become aware of the importance of smell whenA we discover a new smell.B we experience a powerful smell.C our ability to smell is damaged.D we are surrounded by odours.34 The experiment described in paragraph BA shows how we make use of smell without realising it.B demonstrates that family members have a similar smell.C proves that a sense of smell is learnt.D compares the sense of smell in males and females.35 What is the write doing in paragraph C?A supporting other researchB making a proposalC rejecting a common beliefD describing limitations36 What does the write suggest about the study of smell in the atmosphere in paragraph E?A The measurement of smell is becoming more accurate.B Researchers believe smell is a purely physical reaction.C Most smells are inoffensive.D Smell is yet to be defined.Questions 37-40Complete the sentences below.Choose ONE WORD ONLY from the passage for each answer.Write your answers in boxes 37-40 on your answer sheet.37 Tests have shown that odours can help people recognise the.......... belonging to their husbands and wives.38 Certain linguistic groups may have difficulty describing smell because they lack the appropriate ................ .39 The sense of smell may involve response to................ which do not smell, in addition to obvious odours.40 Odours regarded as unpleasant in certain.................are not regarded as unpleasant in others.剑桥雅思阅读8原文参考译文(test2)PASSAGE 1 参考译文:玻璃板制造:浮法工艺早在美索不达米亚时期和古埃及时期人们就开始制造玻璃,当时制作出的玻璃只不过是沙子、碳酸钠和石灰的混合物而已。
托福阅读真题第231篇TheOriginofEarth’sAtmosphere(答案文章最后)
托福阅读真题第231篇TheOriginofEarth’sAtmosphere(答案文章最后)The Origin of Earth’s AtmosphereParagraph 1:In order to understand the origin of Earth's atmosphere, we must go back to the earliest days of the solar system, before the planets themselves were formed from a disk of rocky material spinning around the young Sun. This material gradually coalesced into lumps called planetesimals as gravity and chance smashed smaller pieces together, a chaotic and violent process that became more so as planetesimals grew in size and gravitational pull. Within each orbit, collisions between planetesimals generated immense heat and energy. How violent these processes were is suggested by the odd tilt and spin of many of the planets, which indicate that each of the planets was, like a billiard ball, struck at some stage by another large body of some kind. Visual evidence of these processes can be seen by looking at the Moon. Because the Moon has no atmosphere, its surface is not subject to erosion, so it retains the marks of its early history. Its face is deeply scarred by millions of meteoric impacts, as you can see on a clear night with a pair of binoculars. The early Earth did not have much of an atmosphere. Before it grew to full size, its gravitational pull was insufficient to prevent gases from drifting off into space, while the solar wind (the great stream of atomic particles emitted from the Sun) had already driven away much of the gaseous material from the inner orbits of the solar system. So we must imagine the early Earth as a mixture of rocky materials, metals, and trapped gases, subject to constant bombardment by smaller planetesimals and without much of an atmosphere.1. The word chaotic in the passage is closest in meaning toO rapidO disorganizedO intenseO long-lasting2. All of the following are true of the planetesimals mentioned in paragraph 1 EXCEPT:O They were formed of rocky material spinning around the early Sun.O They collided violently with each other.O They gradually grew in size.O They lost their atmospheres as they were hit by larger bodies.3. The author discusses the Moon in paragraph 1 in order toO help explain why Earth had fewer meteoric impacts than other planets in the solar systemO show why it is difficult to understand how the first planetary atmospheres developedO help explain the processes that took place in the formation of large planetary bodies in the solar systemO illustrate why the Moon's spin and tilt are unique among other planetary bodies in the solar systemParagraph 2:As it began to reach full size, Earth heated up, partly because of collisions with other planetesimals and partly because of increasing internal pressures as it grew in size. In addition, the early Earth contained abundant radioactive materials, also a source of heat. As Earth heated up, its interior melted. Within the molten interior, under the influence of gravity, different elements were sorted out by density. By about 40 million years after the formation of the solar system, most of theheavier metallic elements in the early Earth, such as iron and nickel, had sunk through the hot sludge to the center, giving Earth a core dominated by iron. This metallic core gives Earth its characteristic magnetic field, which has played an extremely important role in the history of our planet.4. Paragraph 2 answers which of the following questions about early Earth?O What caused materials on Earth to become radioactive?O What percentage of Earth's core was nickel?O What internal pressures caused Earth to heat up as it grew in size?O What caused Earth's magnetic field?5. According to paragraph 2, Earth's core is mostly iron because, compared to most other elements on early Earth, iron O was denserO melted more easilyO was more radioactiveO was more plentifulParagraph 3:As heavy materials headed for the center of Earth, lighter silicates (such as the mineral quartz) drifted upward. The denser silicates formed Earth's mantle, a region almost 3,000 kilometers thick between the core and the crust. With the help of bombardment by comets, whose many impacts scarred and heated Earth's surface, the lightest silicates rose to Earth's surface, where they cooled more rapidly than the better-insulated materials in Earth's interior.Paragraph 4:These lighter materials, such as the rocks we call granites, formed a layer of continental crust about 35 kilometers thick. Relative to Earth as a whole, this is as thin as an eggshell. Seafloor crust is even thinner, at about 7 kilometers;thus, even continental crust reaches only about 1/200th of the way to Earth's core. Much of the early continental crust has remained on Earth's surface to the present day.6. Select the TWO answer choices that, according to paragraph 3 and 4, indicate true statements about Earth's formation.To obtain credit, you must select TWO answer choices.O Comets hitting Earth helped the lightest silicates to reach Earth's surface.O Silicates such as mineral quartz drifted downward and mixed with denser materials as they reached Earth's core.O When Earth's mantle became approximately 3,000 kilometers thick, the heaviest materials in it began to cool.O Lighter materials reaching Earth's surface formed Earth's continental crust.7. According to paragraph 4, Earth's continental crustO has changed significantly in composition over timeO was as thick as Earth's mantle in its early stagesO is very thin relative to Earth's sizeO caused the temperatures of Earth's early core and mantle to gradually increaseParagraph 5:The lightest materials of all, including gases such as hydrogen and helium, bubbled through Earth's interior to the surface. So we can imagine the surface of the early Earth as a massive volcanic field. And we can judge pretty well what gases bubbled up to that surface by analyzing the mixture of gases emitted by volcanoes. These include hydrogen, helium, methane, water vapor, nitrogen, ammonia, and hydrogen sulfide. Other materials, including large amounts of water vapor, were brought in by cometary bombardments. Much of the hydrogenand helium escaped; but once Earth was fully formed, it was large enough for its gravitational field to hold most of the remaining gases, and these formed Earth's first stable atmosphere.8. What can be inferred from paragraph 5 about Earth's first stable atmosphere?O It existed before Earth was yet fully formed.O It contained very little hydrogen and helium.O It contained only materials that had bubbled up through Earth's surface.O It lacked water vapor.Paragraph 4:These lighter materials, such as the rocks we call granites, formed a layer of continental crust about 35 kilometers thick. ■Relative to Earth as a whole, this is as thin as an eggshell. ■Seafloor crust is even thinner, at about 7 kilometers; thus, even continental crust reaches only about 1/200th of the way to Earth's core. ■Much of the early continental crust has remained on Earth's surface to the present day.■9. Look at the four squares that indicate where the following sentence could be added to the passage.Even some of its oldest portions as old as 3.8 billion years can still be found in parts of Canada, Australia, South Africa, and Greenland.Where would the sentence best fit Click on a square to add the sentence to the passage.10. Directions: An introductory sentence for a brief summary of the passage is provided below. Complete the summary by selecting the THREE answer choices that express the most important ideas in the passage. Some answer choices do not belong in the summary because they express ideas that are not presented in the passage or are minor ideas in the passage. Thisquestion is worth 2 points. Drag your choices to the spaces where they belong. To review the passage, click on View Text.Answer ChoicesO Early Earth's lack of an atmosphere explains why it was bombarded with much more frequency and violence than other planetesimals.O Continued bombardments and internal pressures made the growing Earth hotter, causing its interior to melt and the heavier elements to sink and form Earth's core.O Lighter elements from Earth's interior rose and formed the mantle, a denser layer of silicates around the core, and the crust, a thinner layer of silicates at Earth's surface.O The formation of Earth's crust protected the inner layers of Earth from the high-energy particles in space, reducing the temperatures of the mantle and the core.O Once Earth had gone through the final stages of its formation, gases bubbled to the surface and were held by Earth's gravitational field to form the atmosphere.O Volcanoes today are the result of gases that were trapped in Earth's interior during the planet's early stages of formation.。
托福阅读真题第53篇SequencingIceAges(答案文章最后)
托福阅读真题第53篇SequencingIceAges(答案文章最后)传统上,气候科学家认为地球经历了四个主要的冰川期(被冰盖覆盖),中间有温暖的间冰期。
但是气候e research has now shown that over the past 800,000 years Earth has seen a complex pattern of some twenty major climatic shifts, with temperatures alternating between very warm and intensely cold, featuring warm seas in northern Europe at one extreme and ice sheets covering vast areas of the globe at the other. The cause of these fluctuations lies in the complex relationship between Earth and the Sun. We are all familiar with the fact that Earth orbits the Sun and that it spins around its own axis, which is at an angle to the plane of its orbit. This causes some parts of Earth's surface to be nearer the Sun for periods of time, accounting for the differences between summer and winter. If all parts of this system were stable. Earth's climate would remain constant, but this is not so. First, Earth's or bit is not perfectly circular but is slightly elliptical, causing a variation on a 100,000-year cycle. Secondly, the axis of Earth hanges its tilt (angle by a fraction over a .41,000-year cycle; and thirdly, the planet . has a slight wobble (shaking movement) about its axis as it spins, setting up changes over a cycle of 23,000 years. The combination of all these factors (known as the Milankovitch cycles) creates very small changes in the Sun-Earth relationship that determine the expansion or contraction of the polar ice cap and thus the sequence of fluctuating ice ages.The complexity of these changes has taken some time to unravel. The earliest work was done on glaciers in the lpine region, and it was here that the four major stages of glaciation were identified, providing a useful regional sequence. Morerecently, over the last fifty years or so, work on deep-sea cores has pioneered a new way to study the phenomenon globally. The principle is quite simple: eep-sea cores provide stratified sequences of accumulations of calcium carbonate derived from the shells of dead organisms. The calcium carbonate in these layers contains two different oxygen isotopes (oxygen of different atomic weights), 16o and 180, which the organisms extract from the atmosphere. Since it can be shown that cold conditions favor 180 over 160, by assessing the ratio of the two it is possible to arrive at a direct measurement relating to the temperature of the ocean at the time of deposition. From these measurements a system of twenty phases, known as marine isotope stages, can be distinguished, reflecting changes in Earth's climate. The method was extremely valuable in providing a relative sequence, but it needed to be calibrated to give approximate dates for the phases.The breakthrough came when, in one of the cores, it was possible to identify a point at which a major reversal had occurred in Earth's magnetic field, the time when the North and South Poles took up their present positions. This same reversal has been recorded in rocks, where it could be dated to around 736.000 years ago using an absolute dating method. With this one point securely established, and assuming that the deep- sea sediments had accumulated at a standard rate, it has been possible to assign dates to the entire sequence. nother valuable dating method, which has been developed over the last thirty years, is based on cores bored out of the Greenland ice cap. The largest core is 3,000 meters deep and represents the buildup of the ice over a 110.000- year period. From the cores it is possible to measure annual increments, one year's winter ice beingseparated from the next year's by a fine dust layer formed during the summer melt. The temperatures prevailing at the time are estimated from the (16)0 to (18)0 ratios and from proportions of the windblown chemical particles The cores provide a very precise dated sequence of climatic events extending back from the present.1.Traditionally, climate scientists believed that Earth underwent four major periods of glaciation (being covered by ice sheets) with warm interglacials in between.ut climate research has now shown that over the past 800,000 years Earth has seen a complex pattern of some twenty major climatic shifts, with temperatures alternating between very warm and intensely cold, featuring warm seas in northern Europe at one extreme and ice sheets covering vast areas of the globe at the other. The cause of these fluctuations lies in the complex relationship between Earth and the Sun. We are all familiar with the fact that Earth orbits the Sun and that it spins around its own axis, which is at an angle to the plane of its orbit. This causes some parts of Earth's surface to be nearer the Sun for periods of time, accounting for the differences between summer and winter. If all parts of this system were stable. Earth's climate would remain constant, but this is not so. First, Earth's or bit is not perfectly circular but is slightly elliptical, causing a variation on a 100,000-year cycle. Secondly, the axis of Earth hanges its tilt (angle by a fraction over a .41,000-year cycle; and thirdly, the planet . has a slight wobble (shaking movement) about its axis as it spins, setting up changes over a cycle of 23,000 years. The combination of all these factors (known as the Milankovitch cycles) creates very small changes in the Sun-Earth relationship that determine the expansion or contraction of the polar ice cap and thus the sequence of fluctuating ice ages.2.Traditionally, climate scientists believed that Earth underwent four major periods of glaciation (being covered by ice sheets) with warm interglacials in between.ut climate research has now shown that over the past 800,000 years Earth has seen a complex pattern of some twenty major climatic shifts, with temperatures alternating between very warm and intensely cold, featuring warm seas in northern Europe at one extreme and ice sheets covering vast areas of the globe at the other. The cause of these fluctuations lies in the complex relationship between Earth and the Sun. We are all familiar with the fact that Earth orbits the Sun and that it spins around its own axis, which is at an angle to the plane of its orbit. This causes some parts of Earth's surface to be nearer the Sun for periods of time, accounting for the differences between summer and winter. If all parts of this system were stable. Earth's climate would remain constant, but this is not so. First, Earth's or bit is not perfectly circular but is slightly elliptical, causing a variation on a 100,000-year cycle. Secondly, the axis of Earth hanges its tilt (angle by a fraction over a .41,000-year cycle; and thirdly, the planet . has a slight wobble (shaking movement) about its axis as it spins, setting up changes over a cycle of 23,000 years. The combination of all these factors (known as the Milankovitch cycles) creates very small changes in the Sun-Earth relationship that determine the expansion or contraction of the polar ice cap and thus the sequence of fluctuating ice ages.3.The complexity of these changes has taken some time to unravel. The earliest work was done on glaciers in the lpine region, and it was here that the four major stages of glaciation were identified, providing a useful regional sequence. More recently, over the last fifty years or so, work on deep-sea cores has pioneered a new way to study the phenomenon globally. Theprinciple is quite simple: eep-sea cores provide stratified sequences of accumulations of calcium carbonate derived from the shells of dead organisms. The calcium carbonate in these layers contains two different oxygen isotopes (oxygen of different atomic weights), 16o and 180, which the organisms extract from the atmosphere. Since it can be shown that cold conditions favor 180 over 160, by assessing the ratio of the two it is possible to arrive at a direct measurement relating to the temperature of the ocean at the time of deposition. From these measurements a system of twenty phases, known as marine isotope stages, can be distinguished, reflecting changes in Earth's climate. The method was extremely valuable in providing a relative sequence, but it needed to be calibrated to give approximate dates for the phases.4.The complexity of these changes has taken some time to unravel. The earliest work was done on glaciers in the lpine region, and it was here that the four major stages of glaciation were identified, providing a useful regional sequence. More recently, over the last fifty years or so, work on deep-sea cores has pioneered a new way to study the phenomenon globally. The principle is quite simple: eep-sea cores provide stratified sequences of accumulations of calcium carbonate derived from the shells of dead organisms. The calcium carbonate in these layers contains two different oxygen isotopes (oxygen of different atomic weights), 16o and 180, which the organisms extract from the atmosphere. Since it can be shown that cold conditions favor 180 over 160, by assessing the ratio of the two it is possible to arrive at a direct measurement relating to the temperature of the ocean at the time of deposition. From these measurements a system of twenty phases, known as marineisotope stages, can be distinguished, reflecting changes in Earth's climate. The method was extremely valuable in providing a relative sequence, but it needed to be calibrated to give approximate dates for the phases.5.The breakthrough came when, in one of the cores, it was possible to identify a point at which a major reversal had occurred in Earth's magnetic field, the time when the North and South Poles took up their present positions. This same reversal has been recorded in rocks, where it could be dated to around 736.000 years ago using an absolute dating method. With this one point securely established, and assuming that the deep- sea sediments had accumulated at a standard rate, it has been possible to assign dates to the entire sequence. nother valuable dating method, which has been developed over the last thirty years, is based on cores bored out of the Greenland ice cap. The largest core is 3,000 meters deep and represents the buildup of the ice over a 110.000- year period. From the cores it is possible to measure annual increments, one year's winter ice being separated from the next year's by a fine dust layer formed during the summer melt. The temperatures prevailing at the time are estimated from the (16)0 to (18)0 ratios and from proportions of the windblown chemical particles The cores provide a very precise dated sequence of climatic events extending back from the present.6.The breakthrough came when, in one of the cores, it was possible to identify a point at which a major reversal had occurred in Earth's magnetic field, the time when the North and South Poles took up their present positions. This same reversal has been recorded in rocks, where it could be dated to around 736.000 years ago using an absolute dating method. With thisone point securely established, and assuming that the deep- sea sediments had accumulated at a standard rate, it has been possible to assign dates to the entire sequence. nother valuable dating method, which has been developed over the last thirty years, is based on cores bored out of the Greenland ice cap. The largest core is 3,000 meters deep and represents the buildup of the ice over a 110.000- year period. From the cores it is possible to measure annual increments, one year's winter ice being separated from the next year's by a fine dust layer formed during the summer melt. The temperatures prevailing at the time are estimated from the (16)0 to (18)0 ratios and from proportions of the windblown chemical particles The cores provide a very precise dated sequence of climatic events extending back from the present.7.The breakthrough came when, in one of the cores, it was possible to identify a point at which a major reversal had occurred in Earth's magnetic field, the time when the North and South Poles took up their present positions. This same reversal has been recorded in rocks, where it could be dated to around 736.000 years ago using an absolute dating method. With this one point securely established, and assuming that the deep- sea sediments had accumulated at a standard rate, it has been possible to assign dates to the entire sequence. nother valuable dating method, which has been developed over the last thirty years, is based on cores bored out of the Greenland ice cap. The largest core is 3,000 meters deep and represents the buildup of the ice over a 110.000- year period. From the cores it is possible to measure annual increments, one year's winter ice being separated from the next year's by a fine dust layer formed during the summer melt. The temperatures prevailing at the time areestimated from the (16)0 to (18)0 ratios and from proportions of the windblown chemical particles The cores provide a very precise dated sequence of climatic events extending back from the present.8.The breakthrough came when, in one of the cores, it was possible to identify a point at which a major reversal had occurred in Earth's magnetic field, the time when the North and South Poles took up their present positions. This same reversal has been recorded in rocks, where it could be dated to around 736.000 years ago using an absolute dating method. With this one point securely established, and assuming that the deep- sea sediments had accumulated at a standard rate, it has been possible to assign dates to the entire sequence. nother valuable dating method, which has been developed over the last thirty years, is based on cores bored out of the Greenland ice cap. The largest core is 3,000 meters deep and represents the buildup of the ice over a 110.000- year period. From the cores it is possible to measure annual increments, one year's winter ice being separated from the next year's by a fine dust layer formed during the summer melt. The temperatures prevailing at the time are estimated from the (16)0 to (18)0 ratios and from proportions of the windblown chemical particles The cores provide a very precise dated sequence of climatic events extending back from the present.9.Traditionally, climate scientists believed that Earth underwent four major periods of glaciation (being covered by ice sheets) with warm interglacials in between.ut climate research has now shown that over the past 800,000 years Earth has seen a complex pattern of some twenty major climatic shifts, with temperatures alternating between very warm and intensely cold,featuring warm seas in northern Europe at one extreme and ice sheets covering vast areas of the globe at the other. The cause of these fluctuations lies in the complex relationship between Earth and the Sun. We are all familiar with the fact that Earth orbits the Sun and that it spins around its own axis, which is at an angle to the plane of its orbit. This causes some parts of Earth's surface to be nearer the Sun for periods of time, accounting for the differences between summer and winter.⬛If all parts of this system were stable. Earth's climate would remain constant, but this is not so.⬛First, Earth's or bit is not perfectly circular but is slightly elliptical, causing a variation on a 100,000-year cycle. Secondly, the axis of Earth hanges its tilt (angle by⬛a fraction over a .41,000-year cycle; and thirdly, the planet . has a slight wobble (shaking movement) about its axis as it spins, setting up changes over a cycle of 23,000 years. ⬛The combination of all these factors (known as the Milankovitch cycles) creates very small changes in the Sun-Earth relationship that determine the expansion or contraction of the polar ice cap and thus the sequence of fluctuating ice ages.10.。
2024年上海市静安区高三上学期期末高考一模英语试卷含答案
静安区2023学年度第一学期期末教学质量调研高三英语试卷(满分140分,完卷时间120分钟)2023年12月考生注意:1.完卷时间120分钟,试卷满分140分。
2.本调研设试卷和答题纸两部分,全卷共12页。
所有答题必须涂(选择题)或写(非选择题)在答题纸上,做在试卷上一律不得分。
3.答题前,务必在答题纸上填写准考证号和姓名。
第Ⅰ卷(共100分)I.Listening ComprehensionSection ADirections:In Section A,you will hear ten short conversations between two speakers.At the end of each conversation,a question will be asked about what was said.The conversations and the questions will be spoken only once.After you hear a conversation and the question about it,read the four possible answers on your paper, and decide which one is the best answer to the question you have heard.1.A.In a gallery. B.At the barber's. C.In a restaurant. D.At the tailor's.2.A.Fellow workers. B.Family members.C.Doctor and patient.D.Driver and passenger.3.A.Choosing psychology. B.Choosing economics.C.Neither is a good choice.D.Choosing a major of interest.4. A.She did not feel sorry for being late for the appointment.B.She did not inform the man of her del ay in advance.C.She wasn't really caught in the traffic jam.D.She wasn't always late for the appointment.5. A.It was lost and won't be found. B.It was transferred to a different city.C.It was delivered to her hotel already.D.It was stolen during her trip.6.. A.He has realized he still leaves much to be desired.B.He is angry with not getting the lead role in the play.C.He is confident about getting the lead role next time.D.He feels reluctant to take the new responsibilities.7. A.They told a lot of stories during the meeting.B.There is no need for them to argue so fiercely in public.C.Both perspectives should be considered before judging.D.They should have resolved their issues in private.8. A.She has already been to the café.B.She is not interested in going to the café.C.She knows about the cafébut hasn't visited it.D.She wants to go to the caféright away.9. A.She expects the man to help Brian move to a new house.B.She expects the man to take mum to Brain's new house.C.She expects the man to celebrate mum's birthday together.D.She expects the man to make a phone call to Mum.10.A.The fantastic and high-quality camera. B.The need for better internet connectivity.C.Their favorite photography techniques.D.The pros and cons of a new smartphone.Sect ion BDirections:In Section B,you will hear two short passages and one longer conversation.After each passage or conversation,you will be asked several questions.The passages and the conversation will be read twice,but the questions will be spoken only once.When you hear a question,read the four possible answers on your paper and decide which one would be the best answer to the question you have heard.Questions11through13are based on the following passage.11.A.Its regular driving practices and poor vehicles.B.Its lack of green spaces and air cleaners.C.Its excessive water pollution and rubbish.D.Its high air pollution and crowded roads.12.A.Establishing a high interest loan scheme.B.Removing outdated black and white taxis.C.Encouraging customers to create new ideas.D.Making advertisements on old vehicles.13.A.Because customers are more friendly and richer.B.Because all new cabs provide air-conditioning.C.Because all new cabs are equipped with meters.D.Because car manufacturers can earn extra money.Questions14through16are based on the following passage.14.A.Canceling all the gifts. B.Applying a‘one-gift’rule.C.Giving children less time to play.D.Encouraging buying second-hand gifts.15.A.Buying a rare and expensive souvenir.B.Buying a hand-made craft product.C.Giving something that won't cost money.D.Giving an experience of something new.16.A.The waste caused by Christmas gifts.B.The importance of buying gifts for children.C.The creative ideas of giving gifts to avoid waste.D.The negative effects of receiving too many gifts.Questions17through20are based on the following conversation.17.A.By trading physical items. B.By exchanging artistic creativity.C.By hosting art exhibitions.D.By making artistic advertisements.18.A.Painting and writing. B.Graphic design and photography.C.Music and album cover design.D.Video editing and project management.19.A.Members can benefit without efforts.B.Members can make money by providing artistic services.C.Members can get copyrights of other artistic offerings.D.Members can have access to the creative exchange list.petitive individualism. B.Artistic cooperation and inspiration.C.Individual fame in the art field.D.Material collaboration and exchange.II.Grammar and VocabularySection ADirections:After reading the passage below,fill in the blanks to make the passages coherent and grammatically correct.For the blanks with a given word,fill in each blank with the proper form of the given word;for the other blanks,use one word that best fits each blank.Japan's robot revolution in senior careJapan's artificial intelligence expertise is transforming the elder care industry,with21(specialize)robotic care accomplishing more than just taking pressure off the critical shortage of caregivers.Senior care facilities across Japan are testing out such new robots22deliver a collection of social and physical health care and the government-backed initiative has been met with positive reviews by elderly residents.The rapidly graying population23(eye)by the government as a potential market for medical technology now.Disappointing government predictions show that by2025,Japan's first baby boomers will have turned75 and about7million people are likely to suffer from some form of dementia(痴呆).The nation won't be able to avoid a dementia crisis24an additional380.000senior care workers.The long-standing shortage of professional care workers has encouraged the Japanese government25 (simplify)procedures for foreign caregivers to be trained and certified.The current Technical Intern Training Program between Vietnam,the Philippines,and Indonesia,under26Economic Partnership Agreement,was extended to include nursing care as well as agriculture,fishery,and construction sectors.27the government made efforts to increase the numbers of senior care workers,the target number of foreign graduates has still fallen flat,with the national caregiver examination proving a major obstacle to pass. The success rate for foreign students was a merely106students last year,28has slightly improved to216 students this year.Another depressing reality is that19to38percent of foreign nurses who pass the exam opt to leave the industry and return home,29(cite)tough work conditions and long hours.Given the challenges,this is 30the government believes care robots will be able to step in.Section BDirections:Complete the following passage by using the words in the box.Each word can only be used once. Note that there is one word more than you need.A.smoothingB.remainC.switchedD.likelihoodE.impactF.tipG.broadly H.headed I.booming J.positioning K.reliablySea-level rise predictionsA team of University of Idaho scientists is studying a fast-moving glacier in Alaska in hopes of developing better predictions on how quickly global sea levels will rise.Tim Bartholomaus,a professor in the Department of Geography and Geological Sciences,spent several weeks on Turner Glacier in Alaska's southeastern31near Disenchantment Bay.The glacier is unique because, unlike other glaciers,it rises greatly every five to eight years.A surging glacier is defined,32,as one that starts flowing at least10times faster than normal.But the how and why of that glacial movement is poorly understood,although recent research suggests that global climate change increases the33of glacial surging.During Turner's surges,the mass of ice and rock will increase its speed from roughly3feet a day to65feet per day.All of that is important because glaciers falling into the ocean are a major contributor to sea level rise,and current climate change models don't34account for these movements.For example,Greenland's glaciers are one of the leading contributors to global sea-level rise.Since the early2000s,Greenland35from not having any effect on world sea levels,to increasing sea level by about1millimeter per year.Half of that yearly increase is due to warmer average temperatures,which leads to more ice melting.The other half,however,is because glaciers in Greenland are,as a whole,moving faster and running into the ocean more frequently.Glacial movement has something to do with water running underneath the glacier.Glaciers are full of holes, and water runs through those holes.When the water pressure is high underneath a glacier,it starts to move,partly because it's lifting the mass of ice and rock off the ground and partly because it's36the underside of the glacier.But how exactly does that water move through the glacier,and how does the movement37the glacier’s speed?Those are the questions the scientists hope to answer.Bartholomaus,some graduate students and researchers from Boise State University,38onto the ice in August.They set up a base camp at the toe of the glacier and spent their days flying in on helicopters.They placed roughly30instruments,burying them deeply into the glacier and39them on rock outcroppings(露岩) alongside the glacier.This summer the team will return to get the instruments and replace batteries.Those instruments will40on and around the glacier until the glacier surge stops,providing researchers with before and after data.III.Reading ComprehensionSection ADirections:For each blank in the following passages there are four words or phrases marked A,B,C and D.Fill in each blank with the word or phrase that best fits the context.Investors probably expect that following the suggestions of stock analysts would make them better off than doing the exact opposite.41,recent research by Nicola Gennaioli and his colleagues shows that the best way to gain excess return s would be to invest in the shares least favored by analysts.They compute that,during the last 35years,investing in the10percent of U.S.stocks analysts were most42about would have yielded on average 3percent a year.43,investing in the10percent of stocks analysts were most pessimistic about would have yielded a surprising15percent a year.Gennaioli and colleagues shed light on this44with the help of cognitive sciences and,in particular,using Kahneman and Tversky's concept of representativeness.Decision makers,according to this view,45therepresentative features of a group or a phenomenon.These are defined as the features that occur more frequently in that group than in a baseline reference group.After observing strong earnings growth—the explanation goes—analysts think that the firm may be the next Google.“Googles”are in fact more frequent among firms experiencing strong growth,which makes them46. The problem is that“Googles”are very47in absolute terms.As a result,expectations become too optimistic, and future performance48.A model of stock prices in which investor beliefs follow this logic can account both qualitatively and quantitatively for the beliefs of analysts and the dynamics(动态变化)of stock returns.In related work,the authors also show that the same model can49booms and busts in the volume of credit and interest rate spreads.These works are part of a research project aimed at taking insights from cognitive sciences and at50them into economic models.Kahneman and Tversky's concept of“representativeness”lies at the heart of this effort.“In a classical example,we51to think of Irishmen as redheads because red hair is much more frequent among Irishmen than among the rest of the world,”Prof.Gennaioli says.“However,only10percent of Irishmen are redheads.In our work,we develop models of belief formation that show this logic and study the52of this important psychological force in different fields.”Representativeness helps describe53and behavior in different fields,not only in financial markets.One such field is the formation of stereotypes about social groups.In a recent experimental paper,Gennaioli and colleagues show that representativeness can explain self-confidence,and in particular the54of women to compete in traditionally male subjects,such as mathematics.A slight prevalence of55male math ability in the data is enough to make math ability un-representative for women,driving their under confidence in this particular subject.41.A.Consequently B.Furthermore C.Nevertheless D.Meanwhile42.A.curious B.controversial C.concerned D.optimistic43.A.In brief B.By contrast C.In addition D.Without doubt44.A.engagement B.concentration C.puzzle D.definition45.A.memorize B.prioritize C.modernize D.fertilize46.A.representative B.argumentative C.executive D.sensitive47.A.harsh B.adaptable C.crucial D.rare48.A.cheers B.disappoints C.stabilizes D.improves49.A.account for B.count on C.suffer from D.hold up50.A.pouring B.admitting C.integrating D.tempting51.A.pretend B.afford C.offer D.tend52.A.effects B.delights C.intervals D.codespanions B.scales C.expectations D.findings54.A.necessity B.involvement C.perseverance D.reluctance55.A.equivalent B.exceptional C.mysterious D.distressingSection BDirections:Read the following three passages.Each passage is followed by several questions or unfinished statements.For each of them there are four choices marked A,B,C and D.Choose the one that fits best accordingto the information given in the passage you have read.(A)Montessori was born in Italy in1870with progressive parents,who frequently communicated with the country's leading thinkers and scholars.This enlightened family environment provided Montessori with many advantages over other young girls of the time.Her mother's support was vital for some important decisions,such as her enrolment in a technical school after her elementary education.Her parents'support also proved to be essential for her decision to study medicine,a field that was dominated by men.Soon after graduating,in1896,Montessori began work as a voluntary assistant in a clinic at the University of Rome,where she cared for children with learning difficulties.The rooms were bare,with just a few pieces of furniture.One day,she found that the children were enthusiastically playing with breadcrumbs(面包屑)that had dropped on the floor.It then occurred to her that the origin of some intellectual disabilities could be related with poverty.With the right learning materials,these and other young minds could be nurtured,Montessori concluded.The observation would lead Montessori to develop a new method of education that focused on providing optimal stimulation during the sensitive periods of childhood.At its centre was the principle that all the learning materials should be child-sized and designed to appeal to all the senses.In addition,each child should also be allowed to move and act freely,and use their creativity and problem-solving skills.Teachers took the role of guides,supporting the children without press or control.Montessori opened her first Children's House in1907.When the Fascists(法西斯主义者)first came into power in Italy in1922,they initially embraced her movement.But they soon came to oppose the emphasis on the children's freedom of expression.Montessori's values had always been about human respect,and the rights of children and women,but the Fascists wanted to use her work and her fame.Things reached a breaking point when the Fascist tried to influence the schools'educational content,and in 1934Montessori and her son decided to leave Italy.She didn't return to her homeland until1947,and she continued to write about and develop her method until her death in1952,at the age of81.56.The primary reason for Montessori to develop a new educational method was.A.her family's supportive influence on her educationB.her experience as a voluntary assistant in a clinicC.her observation of children playing with breadcrumbs happilyD.her decision to study medicine,a field dominated by men57.What was a central principle of Montessori’s educational method as described in the passage?A.Providing standardized,one-size-fits-all learning materials.B.Encouraging strict discipline and control over children's actions.C.Focusing on rote memorization and competition.D.Creating a free and children-centered learning environment.58.Montessori decided to leave Italy in1934because.A.she wanted to explore other countries and culturesB.she wanted to avoid the Fascist's influence on her workC.she was offered a better job in a different countryD.she wanted to retire and enjoy a peaceful life in another country59.Which of the following words can best describe Montessori in this passage?A.Observant and innovative.B.Traditional and emotional.C.Progressive and dependent.D.Open-minded and indifferent.(B)Reducing the workweek to four days could have a climate benefit.In addition to improving the well-being of workers,cutting working hours may reduce carbon emissions.But those benefits would depend on a number of factors,experts emphasize,including how people choose to spend nonworking time.Commuting and travelTransportation is the biggest contributor to greenhouse emissions.A November2021survey of2,000employees and500business leaders in the United Kingdom found that if all organizations introduced a four-day week,the reduced trips to work would decrease travel overall by more than691million miles a week.But the climate benefits of less commuting could be eliminated,experts said,if people choose to spend their extra time off traveling,particularly if they do so by car or plane.Energy usageShorter working hours could lead to reductions in energy usage,experts said.According to a2006paper,if the United States adopted European work standards,the country would consume about20percent less energy.Energy could also be conserved if fewer resources are needed to heat and cool large office buildings, reducing demands on electricity.For example,if an entire workplace shuts down on the fifth day,that would help lower consumption—less so if the office stays open to accommodate employees taking different days off.Lifestyle changesIt's possible that fewer working hours may lead some people to have a larger carbon footprint,but experts say research suggests that most people are likely to shift toward more sustainable lifestyles.One theory is that people who work more and have less free time tend to do things in more carbon-intensive ways,such as choosing faster modes of transportation or buying prepared foods.Convenience is often carbon-intensive and people tend to choose convenience when they're time-stressed.Meanwhile,some research suggests that those who work less are more likely to engage in traditionally low-carbon activities,such as spending time with family or sleeping.“When we talk about the four-day workweek and the environment,we focus on the tangible,but actually,ina way,the biggest potential benefit here is in the intangible,”experts said.60.What is identified as the leading cause of greenhouse emissions according to the passage?A.The well-being of employees.B.The conservation of energy.muting and travel.D.The European work standard.61.What can be inferred from the underlined sentence“the biggest potential benefit here is in the intangible”in the lastparagraph?A.People will have big potential in achieving intangible benefits while working.B.People are more likely to engage in carbon-intensive activities due to time constraints.C.People may shift toward more sustainable lifestyles and lower carbon footprints.D.People may travel more frequently by car or plane during their extra time off.62.The passage is mainly written to.A.highlight the importance of shortening working time in the context of well-beingB.provide an overview of transportation emissions worldwideC.analyze the impact of reduced working hours on mode of businessD.illustrate factors affecting the climate benefits of a shorter workweek(C)The cultivation of plants by ants is more widespread than previously realized,and has evolved on at least15 separate occasions.There are more than200species of an t in the Americas that farm fungi(真菌)for food,but this trait evolved just once sometime between45million and65million years ago.Biologists regard the cultivation of fungi by ants as true agriculture appearing earlier than human agriculture because it meets four criteria:the ants plant the fungus, care for it,harvest it and depend on it for food.By contrast,while thousands of ant species are known to have a wide variety of interdependent relationships with plants,none were regarded as true agriculture.But in2016,Guillaume Chomicki and Susanne Renner at the University of Munich,Germany,discovered that an ant in Fungi cultivates several plants in a way that meets the four criteria for true agriculture.The ants collect the seeds of the plants and place them in cracks in the bar k of trees.As the plants grow, they form hollow structures called domain that the ants nest in.The ants defecate(排便)at designated absorptive places in these domain,providing nutrients for the plant.In return,as well as shelter,the plant provides food in the form of fruit juice.This discovery prompted Chomicki and others to review the literature on ant-plant relationships to see if there are other examples of plant cultivation that have been overlooked.“They have never really been looked at in the framework of agriculture,”says Chomicki,who is now at the University of Sheffield in the UK.“It's definitely widespread.”The team identified37examples of tree-living ants that cultivate plants that grow on trees,known as epiphytes(附生植物).By looking at the family trees of the ant species,the team was able to determine on how many occasions plant cultivation evolved and roughly when.Fifteen is a conservative estimate,says Campbell.All the systems evolved relatively recently,around1million to3million years ago,she says.Whether the37examples of plant cultivation identified by the team count as true agriculture depends on the definitions used.Not all of the species get food from the plants,but they do rely on them for shelter,which is crucial for ants living in trees,says Campbell.So the team thinks the definition of true agriculture should include shelter as well as food.63.According to biologists,why is ant-fungus cultivation considered as a form of true agriculture?A.Because it occurred earlier than human agriculture.B.Because it fulfills the standards typical of agricultural practices.C.Because it redefines the four criteria for true human agriculture.D.Because it is less common than previously thought.64.What motivated Chomicki and others to review the literature on ant-plant relationships?A.They determined on new family trees of the ant species.B.They overlooked some tree-living ants that provided nutrients for the plants.C.They never studied the ant-plant relationships within the context of agriculture.D.They never identified any an t species that engaged in cultivation of fungi.65.Which of the following statements is supported by the team's findings according to the passage?A.Ants’cultivation of plants is limited to a few specific species.B.The cultivation of fungi by ants is considered the earliest form of agriculture.C.True agriculture in ants involves only food-related interactions with plants.D.Ants have independently cultivated plants on at least15distinct occasions.66.What is the passage mainly about?A.The evolution of ants in the plant kingdom.B.The widespread occurrence of ant-plant cultivation.C.The discovery of a new ant species engaging in agriculture.D.The contrast between ant agriculture and human agriculture.Section CDirections:Read the following passage.Fill in each blank with a proper sentence given in the box.Each sentence can be used only once.Note that there are two more sentences than you need.A.In the end,it turned out to be a case of mistaken identity.B.Doppelgängers will also have some of the same DNA as you.C.To enter your workplace,you likely need to be recognizable.D.Why are people interested in finding their possible doppelgangers?E.Eventually,discovering a person's doppelgänger might widen trust boundaries.F.A doppelgänger was said to be a spirit-double that copied every human and beast on earth.What is the likelihood of you having someone who looks just like you?Would it be a good thing?And if you did have one,would you want to meet them?Consider how often your facial features are used to identify you.Your passport,ID card and driving license all feature your face.67You may need your face to unlock your smartphone and possibly even need it to exclude you from being present at a crime scene.The word‘doppelgänger’refers to a person who looks the same as you,essentially sharing your features; those that you thought were unique to you and your identity.Not identical twins,as a doppelgänger has no relation to you.The idea originated in German folklore.68So,let's get real.What are the chances of you having one in the first place?There's said to be a one in135 chance of an exact match for you existing anywhere in the world,so the chances are pretty low,despite folk wisdom promising you otherwise.And the chances of meeting?The mathematical certainty of finding this particular person is supposedly less than one in a trillion.That said,these statistics may be a good thing.Historically,having a double wasn't always a positive.Back in1999,an innocent American man,indistinguishable from the real criminal,was sent to prison for robbery, where he stayed for19years.69.In a different case,a woman in New York was accused of trying to poison her doppelgänger with deadly cheesecake so that she could steal her identity!70The fascination with doppelgängers may be rooted in historical beliefs that facial resemblance meantthey were from the same family or had a common ancestor.It leads to the hope that one day you will meet your lookalike,creating the thrill of a potentially strange meeting.However,as these encounters can be both interesting and disturbing,we understand that after such an experience,you might not want to meet your doppelgänger again.IV.Summary WritingDirections:Read the following passage.Summarize the main idea and the main point(s)of the passage in no more e your own words as far as possible.Competitive CheerleadingOver the years,cheerleading has taken two primary forms:game-time cheerleading and competitive cheerleading.Game-time cheerleaders'main goal is to entertain the crowd and lead them with team cheers,which should not be considered a sport.However,competitive cheerleading is more than a form of entertainment.It is really a competitive sport.Competitive cheerleading includes lots of physical activity.The majority of the teams require a certain level of tumbling(翻腾运动)ability.It's a very common thing for gymnasts,so it's easy for them to go into competitive ually these cheerleaders integrate lots of their gymnastics experience including their jumps, tumbling,and overall energy.They also perform lifts and throws.Competitive cheerleading is also an activity that is governed by rules under which a winner can be declared.It is awarded points for technique,creativity and ually the more difficult the action is,the better the score is.That's why cheerleaders are trying to experience great difficulty in their performance.Besides,there is also a strict rule of time.The whole performance has to be completed in less than three minutes and fifteen seconds,during which the cheerleaders are required to stay within a certain area.Any performance beyond the limit of time is invalid.Another reason for the fact that competitive cheerleading is one of the hardest sports is that it has more reported injuries.According to some research,competitive cheerleading is the number one cause of serious sports injuries to women.Generally,these injuries affect all areas of the body,including wrists,shoulders,ankles,head, and neck.There can be no doubt that competitive cheerleading is a sport with professional skills.It should be noted that it is a team sport and even the smallest mistake made by one teammate can bring the score of the entire team down.So without working together to achieve the goal,first place is out of reach.第Ⅱ卷(共40分)V.TranslationDirections:Translate the following sentences into English,using the words given in the brackets.72.如果不好好准备,周五的演讲可能会变得一塌糊涂。
欢迎进入青海大学图书馆网络资源数据库
追冰淇淋 杰夫奥罗拉斯基:2012 是你感兴趣的冷冻景观? 我六岁的时候,我丌得丌在沉重的暴风雪中步行从学校回家。这是一个伟大的比赛,对于我的性质来说。作为一个年轻 的男子,我开始攀冰和登山在白山新罕布什尔。当我看着照片的冰川在阿拉斯加我知道我想要花时间。 你什么时候开始拍摄的冰川在时间流逝? 后被吹走的冰川退缩而我看到一个美国国家地理杂志拍摄封面故事,“大融化,在2006。明年我创建的极端冰调查,部 署时移摄影机监视退冰在北极和高山地区,有些遥远,我们可能是第一次拜访他们。温度可以达到40℃,−°风速150英 里每小时。我们丌得丌应对深雪,暴雨。 当你开始拍摄的冰川在时间流逝? 后被吹走的冰川退缩而我看到一个美国国家地理杂志拍摄封面故事,“大融化,在2006。明年我创建的极端冰调查,部 署时移摄影机监视退冰在北极和高山地区,有些遥远,我们可能是第一次拜访他们。温度可以达到40℃,−°风速150英 里每小时。我们丌得丌应对深雪,暴雨和落下的岩石。现成的齿轮丌足够强大,幵花了六个月的实验,想出了一个可靠 的延时系统。现在,我们有27个这样的相机18冰川在格陵兮,阿拉斯加,冰岛,洛矶山和珠峰。拍摄每半小时日光全年, 每个人每年产生8500帧。画面为科学家提供信息的力学冰川融化了公兯的证据如何迅速地球的气候 姆斯式已制定了新的摄影设备监测冰川变化如伊卢利萨特在格陵兮。 什么是最戏剧性的一刻你得了? 每年都有产仔的事件中,冰下的海洋冰川。冰的损失率在格陵兮增加了一倍,在过去的20年里,这个夏天我们看到前所 未有的速度融化。我们预计伊卢利萨特冰川在格陵兮西海岸有大量排放的冰,所以夏天2008我的团队成员站看周。他们 发现最大的产仔事件都记录在胶片上。这是因为如果整个南端曼哈顿断绝落入大海,像一个城市天际线不倾倒, skyscraper-sized块冰淹没和重。 目的是什么的极端冰调查? 气候变化问题的看法。人类的大脑和经济制度有利于维持现状。我们的目标是收集证据,强大的视觉 你如何基金的冰调查? 一个重要的部分我们的初始资金从远征理事会在美国国家地理杂志。尼康给我们的硬件。通过不科学家,我们得到帮助 从美国国家科学基金会和美国宇航局。但大部分的资金在过去五年中已经从私人捐助者。它是一个荒谬的高难度项目的 运行没有“大科学”government-scale资金和后勤支持。 你有科学背景? 我的主人在地貌学研究,我州的大汤普森河洪水1976。但我丌敢称自己是一个科学家。当我完成我的论文,我记得看一 堆马尼拉punchcards和决定,我宁愿看世界,通过一个摄像头通过数据分析。这些数据是非常重要的,但我的要求是了 解世界的艺术。 下一步呢? 潜在的主题,我的巟作是人类的需要和自然之间的碰撞。我想去
- 1、下载文档前请自行甄别文档内容的完整性,平台不提供额外的编辑、内容补充、找答案等附加服务。
- 2、"仅部分预览"的文档,不可在线预览部分如存在完整性等问题,可反馈申请退款(可完整预览的文档不适用该条件!)。
- 3、如文档侵犯您的权益,请联系客服反馈,我们会尽快为您处理(人工客服工作时间:9:00-18:30)。
18.R.M.Wing,G.C.Tustin,W.H.Okamura,J.Am.Chem.Soc.92,1935(1970).19.A.Herman,R.M.Wing,anomet.Chem.63,441(1973).20.For a typical naphtha cracker,the concentration oftotal acid gases (CO 2ϩH 2S)in the olefin stream entering a cryogenic tower is less than 1ppm [p.896of (1)].21.Under 1atm of pure H 2S,reaction with H 2S is at leastone order of magnitude slower than reaction with C 2H 4under the same conditions,assuming a pseudo–first order reaction.22.J.A.Waters,G.A.Mortimer,H.E.Clements,J.Chem.Eng.Data 15,174(1970).23.B.I.Konobeev,V.V.Lyapin,Khim.Prom-st .43,114(1967).24.The reactions are not as clean as that with simpleolefins (secondary reactions seem to occur,as indi-cated by UV-vis spectroscopy).Nevertheless,the ini-tial reaction rates can be estimated from the UV-vis spectra.25.J.R.Baker,A.Hermann,R.M.Wing,J.Am.Chem.Soc.93,6486(1971).26.No reaction was observed when treating a solution of either 2or 3in CH 2Cl 2with 100equivalents of norbornadiene at 50°C for 1week.27.J.T.Goodman,T.B.Rauchfuss,J.Am.Chem.Soc.121,5017(1999).28.The stoichiometry of the adduct with simple olefins has not yet been unambiguously established in the electrochemical reaction.Although we favor the 1/1stoichiometry for the adduct with [Ni(mnt)2]in anal-ogy with the results for 1,we cannot unequivocally rule out a 2/1stoichiometry.Field desorption mass spectrum of the product formed by bulk electrolysis of 2in the presence of norbornadiene suggests thattwo molecules of norbornadiene bind to [Ni(mnt)2].However,the norbornadiene result is not necessarily representative of the reactions with simple olefins due to the highly reactive nature of [Ni(mnt)2]and norbornadiene.29.When a large excess of olefin is used,the equilibriumconstant can be reduced to:K eq ϭ(1–x )/(x C 0),where x ϭi c /i a for the 0/–1couple from the CV,and C 0is the concentration of the olefin.30.J.W.Moore,R.G.Pearson,Kinetics and Mechanism(Wiley,New York,ed.3,1981),p.304.31.We thank B.Cook,M.Matturro,J.Robbins,R.Espino,I.Horvath,J.McConnachie,C.Beswick,C.McCon-nachie,M.Greaney,R.Hall,J.Ou,M.Smith,and G.Stuntz for helpful discussions.7September 2000;accepted 21November 2000Timing of Millennial-Scale Climate Change in Antarctica and Greenland During the LastGlacial PeriodThomas Blunier 1*and Edward J.Brook 2A precise relative chronology for Greenland and West Antarctic paleotempera-ture is extended to 90,000years ago,based on correlation of atmospheric methane records from the Greenland Ice Sheet Project 2and Byrd ice cores.Over this period,the onset of seven major millennial-scale warmings in Ant-arctica preceded the onset of Greenland warmings by 1500to 3000years.In general,Antarctic temperatures increased gradually while Greenland temper-atures were decreasing or constant,and the termination of Antarctic warming was apparently coincident with the onset of rapid warming in Greenland.This pattern provides further evidence for the operation of a “bipolar see-saw”in air temperatures and an oceanic teleconnection between the hemispheres on millennial time scales.Ice core and marine sediment records from the North Atlantic region show that climate during the last glacial period oscillated rap-idly between cold and warm states that lasted for several thousand years.Understanding the manifestation of these rapid changes in other parts of the world may help unravel the un-derlying climate dynamics and predict the likelihood of future rapid climate change.Developing this understanding requires pre-cise relative chronologies of events recorded in paleoclimate records.Polar ice cores pro-vide one way of developing such a chronol-ogy for high-latitude sites.Because of the rapid mixing time of the atmosphere (ϳ1year between hemispheres),large-scale changes in the concentration of long-lived atmospheric gases are essentially globally synchronous.This synchroneity pro-vides a tool for correlating ice core chronol-ogies and thereby comparing the timing of climate and other environmental change,re-corded by various proxies in the ice,between the hemispheres.The correlation is compli-cated by the fact that air is trapped in bubbles 50to 100m below the surface,creating an age offset between the trapped air and the surrounding ice (1).This age offset (referred to as ⌬age)must be corrected for when com-paring the timing of climate events recorded in the ice by stable isotopes or other proxies.Here we compare the timing of climate events in the Greenland Ice Sheet Project 2(GISP2)ice core (Summit,Greenland)with the Byrd ice core (Byrd Station,Antarctica),using atmospheric methane as a correlation tool.Blunier et al.(2)used methane records from the Greenland Ice Core Project (GRIP),Byrd,and Vostok to compare the timing of millennial-scale events between 10and 45thousand years ago (ka).They showed thatwarming in Antarctica preceded,by several millennia,the onset of warming in Greenland for Dansgaard-Oeschger (D-O)events 8and 12—interstadial events that occurred at 38and 45ka (GISP2chronology).Previous work showed a similar relationship for the Antarctic cold reversal and the Younger Dr-yas,cold periods that punctuate the last de-glaciation in Antarctica and Greenland (3),respectively.Here we extend the comparison to 90ka using new methane data from the Byrd ice core and existing records from GRIP and GISP2.The study of Blunier et al.(2)was based on data from the GRIP ice core and the GRIP time scale.However,the GISP2ice core provides the most detailed northern CH 4record between 40and 110ka,and we base our study on those results (4)and the GISP2time scale (5).We adopt the GISP2ice age time scale of Meese et al.(6)and the ⌬age calculations of Schwander et al.(7).We estimate the uncertainty in ⌬age from the uncertainty of the input parameters as Ϯ100years between 10to 20ka,increas-ing to Ϯ300years during the glacial period.As expected,the Byrd and GISP2meth-ane records show a high degree of similarity.For example,between 53and 60ka both cores faithfully record a sequence of four major methane oscillations lasting 1000years (1ky)or less.Differences in concentration between the records are due to the latitudinal distribution of methane sources and sinks [(8)and references therein].To create a gas age time scale for Byrd,we synchronized the Byrd methane record with the Greenland methane records from GISP2and GRIP (9).We used a Monte Carlo method to search for a maximal correlation between the CH 4records (1).For the period from 10to 50ka,we transferred the results of Blunier et al.to the GISP2ice age time scale by correlating the rapid variations in ␦18O ice ,which are virtually identical between GRIP and GISP2.We then adopted the previous correlation of GRIP and Byrd methane (2)to put the Byrd methane record for this period on the GISP2time scale.For the time period from 50to 90ka,we directly correlated the1Department of Geosciences,Guyot Hall,Princeton University,Princeton,NJ 08544,USA;Climate and Environmental Physics,Physics Institute,University of Bern,Sidlerstrasse 5,CH-3012Bern,Switzerland.2De-partment of Geology and Program in Environmental Science,Washington State University,14204North-east Salmon Creek Avenue,Vancouver,WA 98686,USA.*To whom correspondence should be addressed.E-mail:blunier@GISP2and Byrd methane records using the same Monte Carlo technique.The precision of the correlation,generally between 200and 500years,is limited by the sampling resolu-tion of the two records [see Web table 1(10)for uncertainties at the start of individual D-O events].For the 11-ky period between D-O events 21and 20,methane decreased gradu-ally (Fig.1),and uncertainty in the interpolar methane gradient makes our correlation more subjective.The relatively small variations during D-O events 19and 20also make correlation more difficult.However,we re-gard the presented synchronization as the most likely one for two reasons.First,new and existing Vostok CH 4measurements (11)for this period agree well with Byrd concen-trations when plotted on a Vostok time scale synchronized with GISP2using the ␦18O of O 2(12),which varies significantly over this time period.Because there is no reason to expect methane to vary between Byrd and Vostok,this confirms that our synchroniza-tion for this period is accurate within the uncertainty of the ␦18O of O 2synchronization (Ϯ600years).Second,␦15N of N 2measure-ments show that the small methane oscilla-tion associated with D-O event 19immedi-ately followed the rapid warming that oc-curred at the beginning of this event,suggest-ing that the methane oscillation is not an analytical artifact (13).To create an ice age time scale for Byrd,⌬age was calculated using the Schwander et al.(1)model.We estimate that the uncertain-ty in Byrd ⌬age is Ϯ200years (14).In Fig.1,the isotopic records (␦18O ice )from Byrd and GISP2are plotted on the common time scale we created (15).Millennial-scale variability in GISP2and GRIP is characterized by abrupt temperature increases,followed by gradual decreases and abrupt returns to baseline glacial conditions.In contrast,at Byrd warming and cooling was gradual.Blunier et al.(2)showed that the onset of Antarctic warmings A1and A2pre-ceded the onset of D-O events 8and 12by more than 1ky.Our new results suggest that this is a persistent pattern.Seven warm events in our record,labeled A1to A7in Fig.1,precede D-O events 8,12,14,16/17,19,20,and 21by 1.5to 3ky.In general,during the gradual warmings in the Byrd record,Green-land temperatures were cold or cooling.The Antarctic temperature rise for each of these events was apparently interrupted at or near the time when Greenland temperatures rose abruptly to interstadial states (16).Subse-quently,temperatures decreased in both hemispheres to full glacial level,but cooling in the Byrd record was more rapid.Our records are best constrained at the culmination of the main Antarctic warmings (A1to A7in Fig.1),which are coincidentwith onsets of long-lasting D-O events,be-cause CH 4increased rapidly at those times.It is unlikely that the Greenland/Antarctic tem-poral temperature offset we infer is an artifact of our ⌬age calculation.Systematic error in ⌬age is extremely unlikely to change the phasing of events.Independent constraints of the ␦15N of the N 2thermal fractionation sig-nal (17,18)verify the Schwander et al.⌬age model (1)to within Ϯ100years for GISP2/GRIP.For Byrd,⌬age would have to be reduced by 1500years to bring the isotopic records into phase (19).As ⌬age is only on the order of 500years,this would result in a negative ⌬age,which is impossible.Our results illustrate that the large differ-ence in timing of millennial-scale climate variability between West Antarctica and Greenland was a pervasive characteristic of the last glacial period.This temporal relation was maintained despite large changes in the background state of the climate system.Ice volume,sea level,and orbital geometry var-ied significantly (20,21)between 90and 10ka (corresponding roughly to the period from marine isotope stage 5a to early marine iso-tope stage 2),while the Byrd/GISP relation-ship remained remarkably consistent.Inland Antarctic ice cores from Byrd,Dome C,Dome B,Dome F,and Vostok (3,22,23)and Southern Ocean sea surface tem-perature (SST)reconstructions (24,25)show a basically similar pattern of millennial-scale variability,with relatively slow to moderate temperature changes in the glacial period,and a slow increase from glacial to intergla-cial with a cold reversal (the Antarctic Cold Reversal)at the end of the deglaciation.In the inland records,only Vostok has an objective chronology that can be compared to our re-sults for Byrd.Bender et al.(12)synchro-nized the Vostok and GISP2isotopic signal based on ␦18O of O 2and concluded that Greenland and Antarctic interstadials were in phase within Ϯ1.3ky.Although our results appear to contradict this conclusion,the two studies actually agree on the relative timing of Greenland and Antarctic events.Bender et al.determined that the peak warmings in the Greenland and Antarctic records are on aver-age in phase,which is also true in our records.However,the start of warmings at Byrd (and also Vostok)occurred several thousand years before warmings at GISP2(Fig.1).The similarity of inner Antarctic ice core records and many Southern Ocean SST records suggests that the timing of millennial-scale climate variability that we infer for Byrd characterized a large area of the Ant-arctic continent and Southern Ocean and has importance for understanding millennial-scale climate variability.However,as sum-marized by Alley and Clark (26),some southern Indian Ocean marine records and the Taylor Dome Ice Core in coastalEastFig.1.Isotopic and CH 4data from Greenland and Antarctica on the GISP2time scale.Dashed lines indicate the onset of major D-O events.(A )␦18O ice from GISP2,Greenland (16).(B )␦18O ice from Byrd station,West Antarctica (23).(C )CH 4data from GISP2and GRIP.Crosses and dots are from GISP2[(4)and new data];the solid gray line is from GRIP (2,8).The solid line runs through the data used for the synchronization:GISP2(black line)up to 45.5ka and GRIP data (gray line)from 45.5ka to the Holocene.(D )CH 4data from Byrd station [(2)and new data].Data are available as supplemental information on Science Online (10)and at the NOAA Geophysical Data Center (5).Antarctica show a pattern of deglacial warm-ing more similar to GISP2than Byrd.Al-though the Taylor Dome chronology has been questioned(27),these observations suggest the possibility of a more complex regional pattern of millennial-scale temperature vari-ability in the high-latitude Southern Hemi-sphere than can be inferred from the Byrd core alone.The temporally offset pattern of warming and cooling at Byrd and Summit Greenland, as well as evidence from marine cores(24), suggest a teleconnection between the north-ern and southern high latitudes.Such a con-nection could be due to either oceanic or atmospheric processes.Changes in the Atlan-tic thermohaline circulation are believed to be the direct cause of millennial-scale tempera-ture changes in central Greenland during the glacial period.These temperature changes were closely preceded by ice rafting and as-sociated meltwater events in the North Atlan-tic region(28).It is thought that the associ-ated injection of fresh water reduces the deep water formation and initiates cooling in the North Atlantic region.Cooling then reduces melt rate and reestablishes North Atlantic Deep Water(NADW)formation,causing rapid warming in northern high latitudes.The temperature increase then leads again to a freshwater input into the North Atlantic and to gradual shutdown of NADW formation (29).Model simulations demonstrate the sen-sitivity of NADW formation to freshwater input and indicate that the resumption of the conveyor belt circulation after a shutdown is a rapid process[(30)and references therein]. D-O events are preceded by ice-rafted debris (IRD)events,and particularly strong IRD events(Heinrich events)originating in the Hudson Bay generally precede long D-O events(28).Ocean models suggest that an increase in North Atlantic thermohaline circulation cools at least parts of the Southern Hemisphere and warms the high-latitude Northern Hemi-sphere(30);this phenomenon has been called the“bipolar see-saw”(31).The same pattern, which Blunier et al.described as“asyn-chrony”(32),appears in our data.D-O events 21,20,19,17,15,12,and8were preceded by Antarctic events A7to A1(Fig.1).The tim-ing of the Antarctic cold reversal and of D-O event1is similar(2).Support for this mech-anism comes from SST data from the Atlantic showing a lead of the Southern Ocean warm-ing relative to northern warming after Hein-rich events5and4(25).We can convincingly demonstrate asyn-chrony for the events indicated above.Close inspection of Fig.1suggests a similar pattern for smaller D-O events(such as D-O events3 to7,10,or11).The analogous Antarctic events are more obvious in the Vostok data, and it has been suggested that each small peak actually corresponds to a D-O event(12).However,the nature and spatial extentof these small temperature excursions areuncertain,precluding a definitive conclusionabout their meaning.Previous work suggested that only strongD-O events,potentially following a majorshutdown of NADW associated with Hein-rich events,resulted in the large-scale expres-sion of the interpolar see-saw(2,30).This isconsistent with our results for events A1toA7.It is also consistent with small CO2vari-ations during major Antarctic warmings inthe glacial period(33).However,if the spec-ulation that the smaller variations in Antarctictemperature are also related to D-O events iscorrect,the see-saw mechanism would havebeen active throughout the glacial period,independent of the magnitude of the D-Oevents.The ultimate forcing of millennial-scaleclimate change remains elusive.Our resultsare consistent with the idea of a forcing aris-ing in the Northern Hemisphere.However,they do not prove that the ice sheets or someother Northern Hemisphere process triggeredmillennial-scale climate change.Other mech-anisms,including rapid changes in tropicalclimate and teleconnections to northern highlatitudes(34,35)or an as yet unidentifiedprocess with a1.5-ky period(36)[but seeWunsch(37)for an alternate view]are pos-sible alternatives.Our results suggest that thebipolar see-saw was a persistent feature ofglacial climate.However,it may be moreaccurate to view NADW changes and asso-ciated climate changes as part of a continuousinterrelated system.References and Notes1.J.Schwander et al.,J.Geophys.Res.102,19483(1997).2.T.Blunier et al.,Nature394,739(1998).3.J.Jouzel et al.,Clim.Dyn.11,151(1995).4.E.J.Brook,J.Severinghaus,S.Harder,M.Bender,inMechanisms of Millennial Scale Climate Change,P.U.Clark,R.S.Webb,L.D.Keigwin,Eds.[American Geo-physical Union(AGU)Monograph,AGU,Washington,DC,1999],vol.112,pp.165–175.5.The choice of a reference time scale is not critical toour study,because we are interested in the relativetiming of Greenland and Antarctic temperatureevents.The GRIP and GISP2ice cores were drilled30km apart on top of the Greenland ice sheet.They areequal in time resolution and core quality,and thepaleotemperature records are virtually identical onthe time scales of interest here.All results are pre-sented on the GISP2Meese/Sowers time scale(6);see /paleo/icecore/greenland/summit/document/notetime.htm for a description.However,the same data set on the GRIP time scalecan be found as supplemental information on ScienceOnline(10)and at the National Oceanic and Atmo-spheric Administration(NOAA)Geophysical DataCenter(/paleo/paleo.html).6.D.A.Meese et al.,Science266,1680(1994).7.Schwander et al.(1)calculated⌬age using a dynamicmodel forfirn densification and diffusional mixing ofthe air in thefirn,including the heat transport in thefirn and temperature dependence of the close-offdensity.Accumulation rates derived from annual lay-er counts and the iceflow model,and temperaturederived from the␦18Oiceprofile with calibration fromborehole temperature measurements for the glacial-interglacial transition,are inputs to the model.The␦18O ice-temperature(␦18O ice-T)relation correspondsroughly to a linear dependence,with a slope of0.33per mil(‰)per°C,which is in contrast to today’srelation with a slope of0.67‰per°C[see(1)fordetails and original references].The␦18Oice-T relationcalibrated by the borehole temperature profile isconfirmed by independent measurements of⌬agebased on thermal fractionation of nitrogen isotopesat the last termination and the termination of theYounger Dryas(17,18).8.A.Da¨llenbach et al.,Geophys.Res.Lett.27,1005(2000).9.The mean methane sample spacing in the GISP2recordis315years over the period from45to85ka,but thefast transitions,which are of interest for correlation,areresolved at a200-year resolution.For the Byrd core,new data were obtained from99depth levels coveringthe time period from45to90ka.Eighty of the depthlevels were measured at Washington State Universityand18depth levels were measured at the University ofBern.The mean sampling resolution is390years for theByrd ice core.The measurement methods of the twolaboratories are basically the same although differing indetails.The results from the two labs are generally ingood agreement.10.For supplementary information,see Science Online at/cgi/content/full/291/5501/109/DC1.11.S.Harder,personal communication(2000).12.M.Bender,B.Malaize,J.Orchardo,T.Sowers,J.Jouzel,in Mechanisms of Millennial Scale Climate Change,P.U.Clark,R.S.Webb,L.D.Keigwin,Eds.(AGUMonograph,AGU,Washington,DC,1999),vol.112,pp.149–164.13.A.Da¨llenbach,thesis,Physikalisches Institut,Univer-sity of Bern,Bern,Switzerland(2000).14.⌬age for Byrd is calculated with the same model asused for GISP2(1).Accumulation rates are calculatedassuming a linear relation between the accumulationrate and the derivative of the water vapor partialpressure with respect to temperature(38).A temper-ature record based on the spatial␦18Oice-T correla-tion suggests a glacial-interglacial temperature dif-ference at Byrd station of about7°C(39).This con-flicts with an estimate ofϳ15°C of glacial-intergla-cial change at Vostok station(40).However,thelatter result is not supported by Global Climate Mod-el simulations(41).Here we used the spatial estimatefor␦18Oice-T ing the calibration esti-mate from the borehole temperature measurementswould make⌬age larger by at most400years(2),making the Byrd isotope record older than presentedin Fig.1,increasing the temporal offset we inferbetween Greenland and Antarctic temperatures.Weestimate that the uncertainty of⌬age for Byrd isϮ200years in the glacial period.15.The chronology after45ka is based on the previoussynchronization(2).The Byrd record for this periodhas been transferred from the GRIP to the GISP2timescale,based on a synchronization of the␦18Oicesignals of the two cores.The time period from25to17ka(corresponding to27.5to18ka on the GISP2time scale)was excluded from the analysis in(2).Therefore,the small CH4peak around25ka in theByrd record,which probably corresponds to a peakassociated with D-O event2in the GRIP record,didnot appear to be coincident with the D-O event2CH4peak in GRIP.In the chronology described here,we included the period around D-O event2in thesynchronization.This brings the Byrd and GRIP CH4peaks into agreement and shifts the Byrd␦18O byabout1000years later for this period but does notaffect the rest of the record.16.P.M.Grootes,M.Stuiver,J.W.C.White,S.J.Johnsen,J.Jouzel,Nature366,552(1993).17.J.P.Severinghaus,E.J.Brook,Science286,930(1999).ng,M.Leuenberger,J.Schwander,S.Johnsen,Science286,934(1999).19.The correlation between the two records in the timerange from25to90ka for GISP2is highest if theAntarctic record is shifted toward younger ages by1500years.This correlation maximum is broad be-cause of the inhomogenity of the signals (on the order of Ϯ1000years)but distinct.Because of the different nature of the Greenland and Antarctic sig-nals,the age shift for the correlation maximum is smaller than that resulting from comparing the tim-ing of initial warming in both records.20.N.J.Shackleton,Quat.Sci.Rev.6,183(1987).21.A.Berger,M.-F.Loutre,Quat.Sci.Rev.10,297(1991).22.O.Watanabe et al.,Ann.Glaciol.29,176(1999).23.S.J.Johnsen,W.Dansgaard,H.B.Clausen,ngway Jr.,Nature 235,429(1972).24.U.S.Ninnemann,C.D.Charles,D.A.Hodell,in Mechanisms of Millennial Scale Climate Change ,P.U.Clark,R.S.Webb,L.D.Keigwin,Eds.(AGU Mono-graph,AGU,Washington,DC,1999),vol.112,pp.99–112.25.L.Vidal et al.,Clim.Dyn.15,909(1999).26.R.B.Alley,P.U.Clark,Annu.Rev.Earth Planet.Sci.27,149(1999).27.R.Mulvaney et al.,Geophys.Res.Lett.27,2673(2000).28.G.C.Bond,R.Lotti,Science 267,1005(1995).29.T.F.Stocker,O.Marchal,Proc.Natl.Acad.Sci.U.S.A.97,1362(2000).30.T.F.Stocker,Quat.Sci.Rev.19,301(2000).31.W.S.Broecker,Paleoceanography 13,119(1998).32.Blunier et al.(2)used the term asynchrony to de-scribe the fact that Greenland and Antarctic warming did not occur at the same time.Further,they sug-gested that Antarctica starts cooling when Greenland rapidly warms at the start of a D-O event.This implies a slight time lag of Greenland cooling versus Antarctic cooling,which is within the uncertainty of the synchronization.However,they did not suggest that warming propagated from the south to the north with a constant or variable time lag.33.A.Indermu ¨hle,E.Monnin,B.Stauffer,T.F.Stocker,M.Wahlen,Geophys.Res.Lett.27,735(2000).34.M.A.Cane,A.C.Clement,in Mechanisms of Millen-nial Scale Climate Change ,P.U.Clark,R.S.Webb,L.D.Keigwin,Eds.(AGU Monograph,AGU,Washing-ton,DC,1999),vol.112,pp.373–383.35.A.Schmittner,C.Appenzeller,T.F.Stocker,Geophys.Res.Lett.27,1163(2000).36.G.Bond et al.,Science 278,1257(1997).37.C.Wunsch,Paleoceanography 15,417(2000).38.J.Jouzel et al.,Nature 329,403(1987).39.G.de Q.Robin,in The Climatic Record in Polar IceSheets ,G.d.Q.Robin,Ed.(Cambridge Univ.Press,London,1983),pp.180–184.40.A.N.Salamatin et al.,J.Geophys.Res.103,8963(1998).41.G.Krinner,C.Genthon,J.Jouzel,Geophys.Res.Lett.24,2825(1997).42.In Switzerland,work on GRIP and Byrd was supportedby the University of Bern and the Swiss National Science Foundation.We thank ngway for providing Bern with additional Byrd samples.U.S work on Byrd and GISP2was funded by grants OPP-9714687and OPP-9725918to E.J.B.from the U.S.NSF,Office of Polar Programs.S.Cowburn at Wash-ington State University made Byrd and GISP2mea-surements and A.Da ¨llenbach at Bern made Byrd and GRIP methane measurements.We thank M.Bender,P.Clark,A.Inderu ¨hle,S.Lehman,O.Marchal,J.Schwander,B.Stauffer,and T.Stocker for discussion and comments and S.Harder for access to unpub-lished data.16August 2000;accepted 29November 2000Atmospheric CO 2Concentrations over the Last Glacial TerminationEric Monnin,1*Andreas Indermu ¨hle,1Andre ´Da ¨llenbach,1Jacqueline Flu ¨ckiger,1Bernhard Stauffer,1Thomas F.Stocker,1Dominique Raynaud,2Jean-Marc Barnola 2A record of atmospheric carbon dioxide (CO 2)concentration during the tran-sition from the Last Glacial Maximum to the Holocene,obtained from the Dome Concordia,Antarctica,ice core,reveals that an increase of 76parts per million by volume occurred over a period of 6000years in four clearly distinguishable intervals.The close correlation between CO 2concentration and Antarctic tem-perature indicates that the Southern Ocean played an important role in causing the CO 2increase.However,the similarity of changes in CO 2concentration and variations of atmospheric methane concentration suggests that processes in the tropics and in the Northern Hemisphere,where the main sources for methane are located,also had substantial effects on atmospheric CO 2concentrations.The concentration of atmospheric CO 2has been increasing steadily since the beginning of industrialization,from ϳ280parts per mil-lion by volume (ppmv)to its present value of ϳ368ppmv (1–4).By investigating earlier,natural CO 2variations,we expect to obtain information about feedbacks between the car-bon cycle and climate and also the possible impact of the anthropogenic CO 2on the cli-mate system.The transition from the Last Glacial Maximum (LGM)to the Holocene,during which CO 2increased by ϳ40%,is a key period for such investigations.The ice core record from Vostok,Antarc-tica,covering the past 420,000years,shows increases of the CO 2concentration between80and 100ppmv for each of the past fourglacial terminations (5).The increase dur-ing the last termination is well established on the basis of various polar ice cores from both hemispheres (6–10).However,not all ice cores are well suited to investigate the details of such an increase.Some CO 2records,especially those from Greenland ice cores,are compromised by the pro-duction of CO 2by chemical reactions be-tween impurities in the ice (11–13).Ice cores from Antarctica are less affected,but a small amount of in situ CO 2production by chemical reactions cannot be excluded for all Antarctic ice cores and all climatic periods (14,15).CO 2records from Vo-stok and Taylor Dome are thought to be the most accurate (5,10,16).However,the time resolution of these two records is too low to provide a history of CO 2changes that shows the detailed evolution of atmospheric CO 2over the last glacial termination.Here,we present a record from the DomeConcordia (Dome C),Antarctica (75°06ЈS,123°24ЈE),ice core drilled in the frame of the European Project for Ice Coring in Antarctica (EPICA)during the field season 1998–99.We measured CO 2in a total of 432samples from 72different depth intervals,between depths of 350and 580m,covering the period from 22to 9ky B.P.(ky B.P.is thousand years before present,where present is chosen as A.D.1950).For each depth level,six samples were measured on a 60-to 100-mm length interval.On the same core,74methane measurements were performed.The analyti-cal methods are described in (17).The age scale for the ice,as well as for the enclosed air (which is younger than the surrounding ice because it is enclosed at the bottom of the firn layer),is based on the time scale by Schwander et al.(18).The uncertainty of the absolute time scale for the ice is estimated to Ϯ200years back to 10ky B.P.and up to Ϯ2000years back to 41ky B.P.The gas-ice age difference (⌬age)is calculated with a firn densifica-tion model.The value of ⌬age is ϳ2000years in the Holocene,increasing to ϳ5500years during the LGM,and has an estimat-ed uncertainty of ϳ10%.The main feature of the CO 2record (Fig.1)is an increase from a mean value of 189ppmv between 18.1and 17.0ky B.P.(19)to a mean value of 265ppmv between 11.1and 10.5ky B.P.(beginning of the Holocene).The increase of 76Ϯ1ppmv occurs in four distinct intervals.From 17.0to 15.4ky B.P.(interval I),CO 2increases from 189to 219ppmv at a mean rate of 20ppmv/ky.From 15.4to 13.8ky B.P.(inter-val II),CO 2rises from 219to 231ppmv at a rather constant rate of 8ppmv/ky before a rapid increase of ϳ8ppmv within three centuries at 13.8ky B.P.Between 13.8and 12.3ky B.P.(interval III),a small decrease from 239to 237ppmv occurs at a rate of1Climate and Environmental Physics,Physics Institute,University of Bern,Sidlerstrasse 5,CH-3012Bern,Switzerland.2CNRS Laboratoire de Glaciologie et de Ge ´ophysique de l’Environnement,BP 96,38402St.Martin d’He `res Cedex,Grenoble,France.*To whom correspondence should be addressed.E-mail:monnin@climate.unibe.ch。