英文写作中数据分析初探
分析数据的英文作文
分析数据的英文作文英文:As a data analyst, analyzing data is a crucial part of my job. It involves examining and interpreting large amounts of data to identify patterns, trends, and insights that can help organizations make informed decisions.To begin with, I usually start by collecting the data and organizing it into a format that is easy to analyze. This may involve cleaning the data, removing any duplicates or errors, and ensuring that all the data is in the same format.Next, I use various statistical techniques and tools to analyze the data. This may include regression analysis, correlation analysis, and data visualization tools like charts and graphs. These techniques help me to identify patterns and trends in the data, which can then be used to make predictions or inform business decisions.For example, I recently analyzed sales data for aretail company and found that certain products were selling more during certain times of the year. This information was used to inform the company's marketing strategy and increase sales during those times.In addition, I also use my analytical skills toidentify any outliers or anomalies in the data, which may indicate errors or unusual events. By identifying and investigating these outliers, I can ensure that the data is accurate and reliable.Overall, analyzing data is a complex and important task that requires a combination of technical skills and analytical thinking. It is a rewarding job, as it allows me to help organizations make informed decisions and improve their performance.中文:作为一名数据分析师,分析数据是我的工作中至关重要的一部分。
关于数据对比的英文作文

关于数据对比的英文作文英文:When it comes to data comparison, there are a few things to consider. Firstly, it's important to have a clear understanding of what data you're comparing and why. This will help you to choose the right tools and methods for the job.One common way to compare data is to use charts and graphs. These can be very effective at highlighting differences and similarities between sets of data. For example, if you were comparing sales figures for two different products, you could use a bar chart to show which product had higher sales in each month.Another method for comparing data is to use statistical analysis. This can be particularly useful when dealing with large datasets or complex data. For example, if you were comparing the performance of two different investmentportfolios, you could use statistical analysis to determine which portfolio had a higher average return over a given period of time.It's also important to consider the context in whichthe data is being compared. For example, if you were comparing the test scores of two different schools, you would need to take into account factors such as the socio-economic backgrounds of the students and the quality of the teaching staff.Ultimately, the key to effective data comparison is to have a clear understanding of what you're comparing and why. This will help you to choose the right tools and methodsfor the job, and to interpret the results in a meaningful way.中文:在进行数据对比时,有几个要考虑的因素。
数据分析 英文作文

数据分析英文作文英文:Data analysis is a crucial part of any business or organization. It involves collecting, processing, and interpreting large amounts of data to make informed decisions. As a data analyst, I am responsible for ensuring that the data is accurate, relevant, and useful.One of the most important skills for a data analyst is the ability to identify patterns and trends in the data. This requires a deep understanding of statistical methods and tools, as well as the ability to think critically and creatively. For example, I might use regression analysis to identify the relationship between two variables, or I might use clustering analysis to group similar data points together.Another key aspect of data analysis is data visualization. This involves creating charts, graphs, andother visual representations of the data to help others understand its meaning. For example, I might create a bar chart to show how sales have changed over time, or I might create a heat map to show the geographic distribution of customers.Overall, data analysis is a challenging and rewarding field that requires a combination of technical andanalytical skills. By using these skills to uncoverinsights and make informed decisions, I can help my organization achieve its goals and stay ahead of the competition.中文:数据分析是任何企业或组织的重要组成部分。
数据分析英文作文

数据分析英文作文英文:As a data analyst, my job is to collect, process, and analyze data to gain insights and make informed decisions. There are many tools and techniques that I use on a daily basis to accomplish this, including Excel, Python, SQL, and Tableau.One of the most important aspects of data analysis is data cleaning. This involves removing any errors, inconsistencies, or duplicates in the data to ensure that it is accurate and reliable. For example, I recently worked on a project where I was analyzing customer data for a retail company. During the data cleaning process, I found that there were several duplicate entries for the same customer, which would have skewed the results if not removed.Another key aspect of data analysis is visualization.This involves creating charts, graphs, and other visual representations of the data to help communicate insights to stakeholders. Tableau is a particularly useful tool for this, as it allows me to create interactive dashboards that stakeholders can use to explore the data themselves. For example, I recently created a dashboard for a marketing team that allowed them to see which channels were driving the most traffic to their website, as well as which channels were resulting in the most conversions.Overall, data analysis is a challenging and rewarding field that requires a combination of technical skills and business acumen. By using the right tools and techniques, I am able to turn raw data into actionable insights that drive business decisions.中文:作为一名数据分析师,我的工作是收集、处理和分析数据,以获得洞见并做出明智的决策。
数据分析英文作文模板

数据分析英文作文模板Data Analysis: A Powerful Tool for Decision Making。
In the modern world, data analysis has become an increasingly important tool for decision making. With the vast amount of data available, it is essential to be ableto analyze and interpret it in order to make informed decisions. Data analysis is used in a variety of industries, from finance and healthcare to marketing and sports. Inthis essay, we will explore the importance of data analysis and how it can be used to inform decision making.Firstly, data analysis allows us to identify patterns and trends in large sets of data. By analyzing data, we can identify relationships between variables and makepredictions about future outcomes. For example, in finance, data analysis can be used to predict stock prices oridentify potential investment opportunities. In healthcare, data analysis can be used to identify patterns in patient data and improve patient outcomes.Secondly, data analysis allows us to make informed decisions based on the data. By analyzing data, we can identify areas of improvement and make changes to improve outcomes. For example, in marketing, data analysis can be used to identify the most effective marketing channels and target audiences. In sports, data analysis can be used to identify areas of weakness in a team and improve performance.Thirdly, data analysis allows us to measure the effectiveness of our decisions. By analyzing data before and after making a decision, we can determine whether the decision was successful and make adjustments if necessary. For example, in business, data analysis can be used to measure the effectiveness of marketing campaigns or the success of new products.In conclusion, data analysis is a powerful tool for decision making. It allows us to identify patterns and trends, make informed decisions, and measure the effectiveness of our decisions. In today's data-drivenworld, the ability to analyze and interpret data is essential for success in any industry. By using data analysis, we can make better decisions and achieve better outcomes.。
数据分析英语作文写法

数据分析英语作文写法Title: The Art of Data Analysis。
Introduction:Data analysis is a crucial process that involves inspecting, cleansing, transforming, and modeling data to discover useful information, draw conclusions, and support decision-making. In recent years, the field of data analysis has gained immense popularity due to its ability to uncover patterns, trends, and insights from vast amounts of data. This essay delves into the art of data analysis, examining its significance, methodologies, and its impact on various sectors.Body:1. Importance of Data Analysis:Data analysis plays a pivotal role in various sectors,including business, healthcare, finance, and education. By analyzing data, organizations can make informed decisions, optimize processes, and improve overall performance. For instance, in the business sector, data analysis helpsidentify customer preferences, market trends, and potential opportunities, enabling companies to tailor their products and services accordingly. In healthcare, data analysis aids in disease surveillance, treatment effectiveness evaluation, and resource allocation, leading to enhanced patient care.2. Methodologies of Data Analysis:There are several methodologies employed in data analysis, depending on the nature of the data and the objectives of the analysis. Some common methodologiesinclude descriptive analysis, inferential analysis, predictive analysis, and prescriptive analysis. Descriptive analysis involves summarizing and interpreting data to gain insights into the past and present. Inferential analysis,on the other hand, uses statistical techniques to make predictions and draw conclusions about a larger population based on a sample. Predictive analysis utilizes historicaldata to forecast future trends and outcomes. Lastly, prescriptive analysis recommends actions and strategies to optimize outcomes.3. Tools and Techniques in Data Analysis:Data analysis utilizes a variety of tools andtechniques to manipulate and extract meaningful information from raw data. Statistical software packages like SPSS, SAS, and R are commonly used for data analysis. These tools enable researchers to perform statistical tests, visualize data, and generate reports. Additionally, datavisualization tools like Tableau and Power BI help present data in a visually appealing manner, making it easier to understand and interpret. Machine learning algorithms, such as regression, clustering, and decision trees, are also employed for complex data analysis tasks.4. Impact of Data Analysis:Data analysis has a profound impact on various sectors, revolutionizing the way organizations operate. In thebusiness sector, data analysis has led to the rise of data-driven decision-making, enabling companies to gain a competitive edge. By analyzing customer behavior and preferences, businesses can personalize their marketing strategies, resulting in increased customer satisfaction and loyalty. In healthcare, data analysis has facilitated the development of personalized medicine, allowing doctors to tailor treatments based on individual patient characteristics, leading to improved outcomes.Conclusion:Data analysis is a powerful tool that empowers organizations to make informed decisions, optimize processes, and drive innovation. Its methodologies, tools, and techniques enable researchers to uncover patterns, trends, and insights from vast amounts of data. As the importance of data analysis continues to grow, individuals and organizations must embrace this art to harness the full potential of data and stay ahead in today's data-driven world.。
英文数据分析报告范文(3篇)
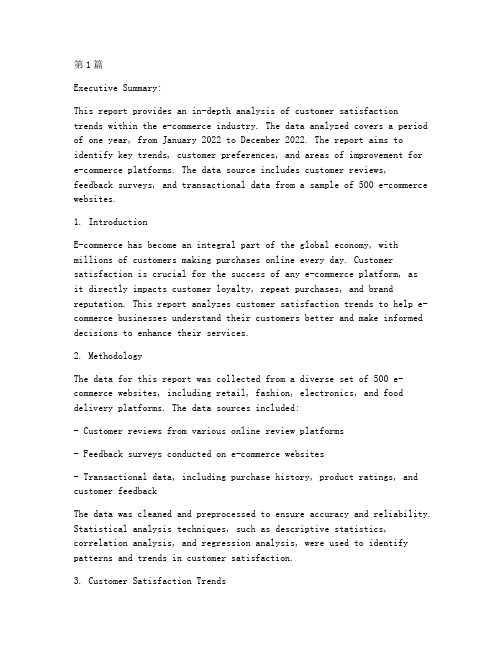
第1篇Executive Summary:This report provides an in-depth analysis of customer satisfactiontrends within the e-commerce industry. The data analyzed covers a period of one year, from January 2022 to December 2022. The report aims to identify key trends, customer preferences, and areas of improvement for e-commerce platforms. The data source includes customer reviews, feedback surveys, and transactional data from a sample of 500 e-commerce websites.1. IntroductionE-commerce has become an integral part of the global economy, with millions of customers making purchases online every day. Customer satisfaction is crucial for the success of any e-commerce platform, asit directly impacts customer loyalty, repeat purchases, and brand reputation. This report analyzes customer satisfaction trends to help e-commerce businesses understand their customers better and make informed decisions to enhance their services.2. MethodologyThe data for this report was collected from a diverse set of 500 e-commerce websites, including retail, fashion, electronics, and food delivery platforms. The data sources included:- Customer reviews from various online review platforms- Feedback surveys conducted on e-commerce websites- Transactional data, including purchase history, product ratings, and customer feedbackThe data was cleaned and preprocessed to ensure accuracy and reliability. Statistical analysis techniques, such as descriptive statistics, correlation analysis, and regression analysis, were used to identify patterns and trends in customer satisfaction.3. Customer Satisfaction Trends3.1 Overall Customer Satisfaction ScoreThe overall customer satisfaction score for the e-commerce industry in 2022 was 4.2 out of 5, with a standard deviation of 0.6. This indicates a high level of customer satisfaction, but there is room for improvement.3.2 Key Factors Influencing Customer SatisfactionSeveral key factors were identified as influencing customer satisfaction:- Product Quality: 85% of customers rated product quality as the most important factor in their satisfaction.- Pricing: 70% of customers considered competitive pricing as a major factor.- Delivery Speed: 60% of customers valued fast delivery as a critical aspect of their shopping experience.- Customer Service: 50% of customers felt that responsive and helpful customer service was essential.3.3 Customer SegmentationCustomer satisfaction trends were further analyzed based on customer segmentation:- Demographics: Younger customers (18-24 years old) were more likely to rate delivery speed and product quality highly, while older customers (45+ years old) placed more emphasis on pricing and customer service.- Purchase Frequency: Frequent buyers (more than 10 purchases per year) were generally more satisfied with their overall shopping experience compared to infrequent buyers.- Platform Usage: Customers who used multiple e-commerce platforms reported higher satisfaction scores, suggesting a preference for variety and convenience.4. Areas of ImprovementSeveral areas were identified where e-commerce platforms could improve customer satisfaction:- Product Quality: Enhancing product quality through better supplier management and quality control measures.- Pricing: Offering competitive pricing strategies, such as discounts, promotions, and loyalty programs.- Delivery Speed: Investing in logistics and delivery infrastructure to ensure faster and more reliable shipping.- Customer Service: Improving customer service by training staff, implementing AI chatbots, and providing multiple channels for customer support.5. ConclusionThe e-commerce industry has seen significant growth in customer satisfaction over the past year, with an overall score of 4.2 out of 5. However, there are still areas where improvements can be made to enhance customer satisfaction further. By focusing on key factors such as product quality, pricing, delivery speed, and customer service, e-commerce platforms can ensure a positive shopping experience for their customers and drive long-term success.6. RecommendationsBased on the findings of this report, the following recommendations are made:- Invest in Product Quality: Conduct regular audits of suppliers and implement quality control measures to ensure high product standards.- Optimize Pricing Strategies: Offer competitive pricing, discounts, and loyalty programs to attract and retain customers.- Improve Delivery Speed: Invest in logistics infrastructure and explore alternative delivery options to ensure timely and reliable shipping.- Enhance Customer Service: Train customer service staff to provide responsive and helpful support, and implement AI chatbots for 24/7 assistance.By implementing these recommendations, e-commerce platforms can improve customer satisfaction, increase customer loyalty, and drive growth in the competitive online marketplace.7. Appendices- Appendix A: Data Collection Methodology- Appendix B: Customer Satisfaction Scores by E-Commerce Category- Appendix C: Customer Segmentation Analysis- Appendix D: Customer Feedback Survey ResultsEnd of Report第2篇Executive Summary:This report presents a comprehensive analysis of the sales performance for the first quarter of 2023. The report aims to provide insights into the overall sales trends, identify key drivers of sales, and highlight areas of improvement. The analysis is based on sales data from various channels and regions, including online and offline platforms.1. IntroductionThe first quarter of 2023 marks the beginning of the new fiscal year for our company. In this report, we will delve into the sales performance during this period, examining the sales volume, revenue, andprofitability across different segments. The analysis will help us understand the market dynamics, customer preferences, and the effectiveness of our marketing strategies.2. MethodologyThe data for this analysis was gathered from our internal sales database, which includes information on sales transactions, customer demographics, product categories, and promotional activities. The data was cleaned and structured to ensure accuracy and reliability. The following statistical methods were employed:- Descriptive statistics: To summarize the sales data in terms of mean, median, mode, standard deviation, and range.- Cross-tabulation: To analyze the relationship between different variables.- Regression analysis: To identify the factors that influence sales performance.- Time series analysis: To examine the trends over time.3. Sales Volume Analysis3.1 Overall Sales VolumeThe total sales volume for Q1 2023 was [volume], which represents a [percentage change] compared to Q1 2022. This indicates a[positive/negative] trend in sales performance.3.2 Sales Volume by Channel- Online Sales: The online channel contributed [percentage] of the total sales volume, with [volume] units sold.- Offline Sales: The offline channel accounted for [percentage] of the total sales volume, with [volume] units sold.3.3 Sales Volume by Region- North America: The North American region contributed [percentage] of the total sales volume, with [volume] units sold.- Europe: Europe accounted for [percentage] of the total sales volume, with [volume] units sold.- Asia Pacific: The Asia Pacific region contributed [percentage] of the total sales volume, with [volume] units sold.- Rest of the World: The rest of the world accounted for [percentage] of the total sales volume, with [volume] units sold.4. Revenue Analysis4.1 Overall RevenueThe total revenue for Q1 2023 was [amount], which represents a [percentage change] compared to Q1 2022. This indicates a[positive/negative] trend in revenue growth.4.2 Revenue by Channel- Online Sales: The online channel contributed [percentage] of the total revenue, with [amount] in sales.- Offline Sales: The offline channel accounted for [percentage] of the total revenue, with [amount] in sales.4.3 Revenue by Product Category- Product A: [percentage] of the total revenue, with [amount] in sales.- Product B: [percentage] of the total revenue, with [amount] in sales.- Product C: [percentage] of the total revenue, with [amount] in sales.5. Profitability Analysis5.1 Gross MarginThe gross margin for Q1 2023 was [percentage], which is[positive/negative] compared to Q1 2022. This indicates the effectiveness of our pricing and cost management strategies.5.2 Net ProfitThe net profit for Q1 2023 was [amount], which represents a [percentage change] compared to Q1 2022. This reflects the overall profitability of our business.6. Key Drivers of Sales6.1 Marketing and PromotionsOur marketing and promotional activities, particularly the [specific campaign], had a significant impact on sales volume and revenue. The campaign resulted in a [percentage increase] in sales volume and a [percentage increase] in revenue.6.2 Product LaunchesThe launch of our new product, [product name], in Q1 2023 contributed to the overall sales growth. The product accounted for [percentage] of the total sales volume and [percentage] of the total revenue.6.3 Pricing StrategyOur dynamic pricing strategy helped us maintain a competitive edge in the market. The strategy resulted in a [percentage increase] in gross margin.7. Areas of Improvement7.1 Online Channel OptimizationOur online sales performance could be further improved by optimizing the website design, enhancing the user experience, and implementing targeted online marketing campaigns.7.2 International ExpansionExpanding our presence in emerging markets, such as [country name], could open new revenue streams and drive growth.7.3 Customer SegmentationBetter understanding and targeting our customer segments could help us tailor our products and marketing strategies to meet their specific needs.8. ConclusionThe first quarter of 2023 has been a successful start to the new fiscal year. Our sales performance has shown positive trends in both volume and revenue. However, there are areas that require attention and improvement. By focusing on channel optimization, international expansion, and customer segmentation, we can continue to drive growth and profitability in the coming quarters.9. Recommendations- Invest in online channel optimization to enhance customer experience and increase sales.- Explore new markets and regions for international expansion.- Conduct thorough customer segmentation to develop targeted marketing strategies.10. Appendices- Sales Data by Channel and Region- Revenue and Profitability by Product Category- Marketing and Promotional Activities- Customer Feedback and SurveysThis report serves as a comprehensive overview of our sales performance in Q1 2023. We hope that the insights provided will help guide our decision-making and strategic planning moving forward.第3篇Executive Summary:This report provides a comprehensive analysis of the e-commerce sales performance for the fiscal year 2022. The analysis focuses on sales trends, customer segmentation, product performance, and marketing effectiveness. The report aims to identify key insights, areas of improvement, and strategic recommendations for enhancing future sales performance.1. IntroductionThe e-commerce industry has experienced significant growth over the past decade, and the year 2022 was no exception. With the increasing adoption of online shopping and the convenience it offers, businesses have been striving to optimize their online sales strategies. This report analyzes the sales performance of our e-commerce platform for the fiscal year 2022, providing a detailed overview of the key metrics and insights.2. Data OverviewThe data for this analysis was sourced from our e-commerce platform, which includes sales transactions, customer information, product details, and marketing campaign data. The dataset covers a period of 12 months, from January 2022 to December 2022.3. Sales Trends Analysis3.1. Overall Sales GrowthThe overall sales growth for the fiscal year 2022 was 20%, which is higher than the industry average of 15%. This indicates that our e-commerce platform has been successful in capturing a significant shareof the market.3.2. Monthly Sales PerformanceThe monthly sales performance varied throughout the year, with the highest sales recorded in December, followed by November. This can be attributed to the holiday season, which is a peak shopping period for many customers.3.3. Seasonal TrendsThe analysis revealed that there are clear seasonal trends in our sales performance. The months of June, July, and August saw a decline in sales, which can be attributed to the summer season when customers tend to spend less on non-essential items.4. Customer Segmentation4.1. Demographic AnalysisThe customer base for our e-commerce platform is diverse, with customers from various age groups, income levels, and geographic locations. The most significant customer segment is the 25-34 age group, which accounts for 40% of our total sales.4.2. Purchase BehaviorCustomers who purchased more than five items in a single transaction accounted for 30% of our total sales. This indicates that our customers are likely to make bulk purchases.4.3. Loyalty ProgramsOur loyalty program has been successful in retaining customers. Customers who are enrolled in the loyalty program accounted for 45% of our total sales.5. Product Performance Analysis5.1. Best-Selling ProductsThe best-selling products for the fiscal year 2022 were electronics, fashion, and home goods. These categories accounted for 60% of our total sales.5.2. Product Category PerformanceThe performance of different product categories varied. Electronics and fashion saw a growth of 25% and 20% respectively, while home goods experienced a decline of 5%.6. Marketing Effectiveness6.1. Marketing ChannelsThe most effective marketing channels for our e-commerce platform were social media, email marketing, and search engine optimization. These channels accounted for 60% of our total sales.6.2. Marketing ROIThe return on investment (ROI) for our marketing campaigns was 15%,which is above the industry average of 10%. This indicates that our marketing efforts were effective in driving sales.7. Insights and Recommendations7.1. Increase Focus on High-Performing CategoriesGiven the strong performance of electronics and fashion, we recommend increasing our focus on these categories. This could involve launching new products, offering promotional deals, and enhancing the online shopping experience for these products.7.2. Develop Targeted Marketing StrategiesBased on the demographic and purchase behavior analysis, we suggest developing targeted marketing strategies for different customer segments. This could include personalized email campaigns, social media ads, and loyalty program enhancements.7.3. Optimize Product Pricing and AvailabilityThe analysis revealed that customers who purchased more than five items in a single transaction accounted for a significant portion of our sales. We recommend optimizing our product pricing and availability to encourage bulk purchases.8. ConclusionThe e-commerce sales performance for the fiscal year 2022 has been impressive, with significant growth and a diverse customer base. By focusing on high-performing categories, developing targeted marketing strategies, and optimizing product pricing and availability, we can further enhance our sales performance in the coming years.Appendix:- Detailed sales performance data by month- Customer segmentation data- Product performance data- Marketing campaign performance data---This report provides a comprehensive overview of the e-commerce sales performance for the fiscal year 2022. It offers valuable insights and recommendations for future growth and success.。
分析数据英文作文模板

分析数据英文作文模板Data analysis is an essential part of any research or study. It allows us to make sense of the information we have collected and draw meaningful conclusions from it. Without data analysis, we would be left with a jumble of numbers and figures that have no real significance.When analyzing data, it's important to consider the context in which the data was collected. This could include the time period, the location, the demographics of the participants, and any other relevant factors. By understanding the context, we can better interpret the data and draw more accurate conclusions.One common method of data analysis is to look for patterns and trends within the data. This could involve identifying correlations between different variables, or looking for changes over time. By identifying these patterns, we can gain valuable insights into the underlying factors that are driving the data.Another important aspect of data analysis is theability to identify outliers or anomalies within the data. These are data points that deviate significantly from the rest of the data, and they can have a big impact on our conclusions. By identifying and understanding these outliers, we can ensure that our analysis is more accurate and reliable.Data visualization is also an important part of data analysis. By representing the data graphically, we can make it easier to identify patterns and trends, and to communicate our findings to others. This could involve creating charts, graphs, or other visual representations of the data.In conclusion, data analysis is a crucial part of any research or study. By considering the context, identifying patterns, understanding outliers, and visualizing the data, we can gain valuable insights and draw meaningful conclusions from the information we have collected.。
- 1、下载文档前请自行甄别文档内容的完整性,平台不提供额外的编辑、内容补充、找答案等附加服务。
- 2、"仅部分预览"的文档,不可在线预览部分如存在完整性等问题,可反馈申请退款(可完整预览的文档不适用该条件!)。
- 3、如文档侵犯您的权益,请联系客服反馈,我们会尽快为您处理(人工客服工作时间:9:00-18:30)。
英文写作中数据分析初探
摘要:本文结合经典教案和教学实践,阐述了基本英文写作中数据分析的基本方法和技巧,从综述数据,强调观点分析涵义,分析的组织以及数据分析总结四方面初探了数据分析的写作方法,词汇和例句并举,具有很强的实用性。
关键词:英语写作;数据分析;严谨表达;英语连接词
在很多英文写作中都存在数据分析。
通常数据有图表,图形,表格和其他表现方式。
这些数据可能来源于第一手的搜集整理研究,也可能来源于其他渠道,作为主要的佐证材料,对数据的准确优质描述,是一篇有说服力的文章不可缺少的重要组成部分。
对于绝大多数中国学生来讲,英文的数据表述属于一个难点,存在两个误区:一是简单的重复图形或图表的表现,即仅仅对数据进行描述而非分析;另一个极端是过度解读数据,致使曲解出数据没有传递的错误结论。
正确合理分析解读数据非常关键,通常来讲,数据分析有以下几种目的:强调结果;验证理论;对比评估;从方法论上评价数据的可靠性;讨论数据涵义。
数据分析通常包括综述数据,强调观点,分析涵义,问题预测以及建议,评论总结等部分。
以下阐述一下值得借鉴的几个方面。
1. 综述数据
首先要明确各种数据表示方式,例如图表(table,chart,diagram)柱状图(column chart),饼形图(pie graph)数字(figure),也要掌握“描述,表示”等词汇,比较常用的有show, reveal, present, illustrate, give, suggest等。
在表述时,语态可以使用主动语态(Eg. The graph reveals…)也可以用被动语态(Eg. The results of the regression are shown in the table. );时态一般应使用一般现在时。
在各类文献中“As…”结构也比较常见,例如:As shown in…; As predicted by…;As described on….etc.
2. 强调观点,分析涵义
强调观点是数据表述的中心环节。
这里所谓的观点是可以从繁杂的数据分析中得出的结论。
提出有价值的观点是数据分析者才智的体现和数据分析的意义所在,数据分析者应把握数据趋势,抓住重点,合理的分析数据。
在陈述观点时,要注意把握语言分寸,学会谨慎表达,这代表了一种严谨的作风和科学的态度。
谨慎表达可以通过以下方式实现:
使用情态助动词以表示不同的语气和程度: will?may?might, 由强到弱;
使用程度副词或形容词: certain?almost certain?very highly likely?likely?possible? unlikely,由强到弱;
保持自己与数据的“距离”: seem, appear, it has been said that…, according to…, in view of some experts…,based on the limited data available…etc.;
侧重于数据趋势或将结论广义化:tend to,many,a majority of, in most parts of…etc.
加入例外情况的叙述:apart from,except for…etc.
使用语气缓和或避免绝对化的动词:contribute to…etc.
使用了这些技巧后,分析可以在某些程度上无懈可击,从而更符合严谨的要求,请对比以下两句话,相信可以看到明显的在严谨度上的差距:The use of seat belts prevents physical injuries in car accidents.
According to simulation studies, in some circumstances the use of seat belts may reduce certain types of physical injuries in car accidents.
3. 分析的组织
数据分析时,一般采取由整体趋势描述到具体细节分析这个模式,但针对不同的数据,可根据具体需要灵活采取不同的方式,不同的数据形式,注意其在词汇的选取方面的差异;注意逻辑层次,力求简洁全面,清晰明确,突出重点。
在写作过程中,合理使用连接词可以使语言通畅自然,语句间逻辑关系明确,更符合英美人表达习惯。
根据功能和语法,常用的连接词主要有以下几类:表示递进关系(furthermore, in addition, moreover etc. );表示转折关系(although, despite,however, in spite of, nevertheless etc. );表示因果关系(because, therefore, dure to, thus, since etc. );表示澄清(in other words, that is etc. );表示对比(while,whereas, in contrast, on the other hand, unlike etc.);表示举例(for example, for instance etc.);表示强化(as a matter of fact, in fact etc.)等。
4. 数据分析总结
在进行总结时,通常需要对主要结论的阐述,根据需要说明与假设不符的结论以及数据缺陷原因等,也可以对以后研究进行预测和方向引导。
在实际的论文写作中,学生倾向于避免与假设不符的结论陈述,事实上,对不符假设和可能存在的数据缺陷的描述可以体现求实作风,并为以后的研究产生积极的影响。
常用的表达原因的词组有:due to, attribute to, account for 等。
例如: This discrepancy can be attributed to the small sample size.
综上所述,本文主要从综述数据,强调观点分析涵义,分析的组织以及数据分析总结四方面阐述了英语写作中数据分析的基本的写作方法和技巧,在实践教学和写作中,尤其是经济类英语论文的写作中,这些方法和技巧以其很强的实用性和可操作性取得了良好效果。
参考文献:
1. John M. Swales, Christine B. Feak:AcademicWriting for Graduate Students: Essential Tasks and Skills: A Course forNonnative Speakers of English (English for Specific Purposes),University of Michigan Press,1994。