会计学原理英文教案AccountingforMerchandisingOperations
Accounting会计学教程与案例讲义中英文对照Ch04第四章
2
The Account
Device used for calculating net change Simplest form is T-account. Increases listed on one side; decreases listed on other side. Balanced periodically. 用于计算净变化的设备 最简单的形式是丁字式帐户。 在一边的增加;减少在其他方面的上市。 定期平衡。
4-12
要真正理解“借”“贷”的含义,必须了解借贷 记账法账户的结构。 (二)借贷记账法的账户结构 账户的基本结构和资金变动方向的两种情况(增 加和减少)相适应,分为两部份,左边用“借”表 示,称为借方;右边用“贷”表示,称为贷方。 究竟哪一部分记增加,哪一部分记减少,要根据 账户的性质确定。 对于资产、负债、所有者权益账户,借贷
不同的部分形成了记账符号。 记账符号表示将经济业务记入账户的方向。“借” 表示记入账户的左边;“贷”表示记入账户的右边。 而账户的方向又和“增加”,“减少”相联系。 将一项资产记入“借”方,表示资产增加;记入“贷” 方,表示资产的减少。 “借”“贷”作为单纯的记账符号已经失去了其文字本 身的含义,即不能按汉语词典对“借”“贷”的解释来 理解作为记账符号的“借”“贷”的含义。
Chapter 4 Accounting Records and Systems 会计记录和系统
1
Why learn basic record keeping procedures? 为什么要学习基本的记录保存程 序?
Accounting
is best learned by doing. Debit-credit mechanism provides an analytical framework. 会计是最好的学习方法。 债务信用机制提供了一个分析框架。
会计学原理23版 英文版教学书册Wild FAP 23e Ch24 IRM
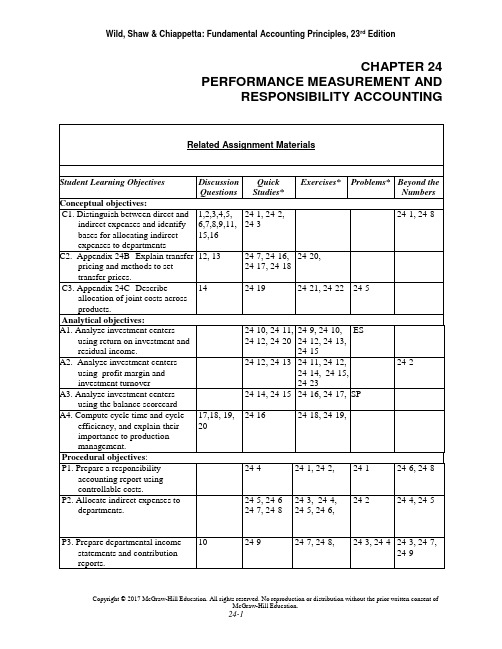
CHAPTER 24 PERFORMANCE MEASUREMENT AND RESPONSIBILITY ACCOUNTING*See additional information on next page that pertains to these quick studies, exercises and problems. SP refers to the Serial ProblemES refers to Excel SimulationsAdditional Information on Related Assignment MaterialConnectA vailable on the instructor’s course-specific website) repeats all numerical Quick Studies, all Exercises and Problems Set A. Connect also provides algorithmic versions for Quick Study, Exercises and Problems. It allows instructors to monitor, promote, and assess student learning. It can be used in practice, homework, or exam mode.Connect InsightThe first and only analytics tool of its kind, Connect Insight is a series of visual data displays that are each framed by an intuitive question and provide at-a-glance information regarding how an instructor’s class is performing. Connect Insight is available through Connect titles.The Serial Problem (SP) for Success Systems continues in this chapter.General LedgerAssignable within Connect, General Ledger (GL) problems offer students the ability to see how transactions post from the general journal all the way through the financial statements. Critical thinking and analysis components are added to each GL problem to ensure understanding of the entire process. GL problems are auto-graded and provide instant feedback to the student.Excel SimulationsAssignable within Connect, Excel Simulations allow students to practice their Excel skills—such as basic formulas and formatting—within the context of accounting. These questions feature animated, narrated Help and Show Me tutorials (when enabled). Excel Simulations are auto-graded and provide instant feedback to the student. Synopsis of Chapter RevisionsNEW opener—Ministry of Supply and entrepreneurial assignment.Reorganized chapter.Revised discussion of performance evaluation and decentralization.Revised discussion of Kraft Heinz responsibility centers.Revised exhibit on responsibility accounting.Revised discussion of responsibility accounting reports.Added NTKs on responsibility accounting, cost allocations, and balanced scorecard.Revised discussion of indirect expense allocations.New exhibit and discussion of general model of expense allocation.New exhibit on common allocation bases for indirect expenses.Revised discussion of preparing departmental income.New exhibit and formula for computing departmental income.Added short section on transfer pricing to the chapter.New Sustainability section with discussion of General Mills, Target and performance reporting, and Ministry of Supply example.Chapter OutlineNotes I.Responsibility AccountingA. Performance Evaluationrge companies are easier to manage if divided into smallerunits called divisions, segments, or departments.2.In decentralized organizations, decisions are made by unitmanagers rather than top management.3.In responsibility accounting, unit managers are evaluated onlyon what they are responsible for.4.The methods of performance evaluation vary for cost centers,profit centers and investment centers.a.Cost center−incurs cost or expenses without directlygenerating revenues (e.g. manufacturing department andservice department).b.Profit center−incurs costs and generates revenues (e.g.product centers).c.Investment center−incurs costs, generates revenues and isresponsible for effectively using center assets.5.Basis for evaluating performance:a.Cost center managers are evaluated on their success incontrolling costs compared to budgeted costs. Profit center:ability to generate more revenue than expenses.b.Profit center managers are evaluated on their success ingenerating income.c.Investment center managers are evaluated on their use ofinvestment-center assets to generate income.II.Controllable versus Uncontrollable CostsA.Controllable Costs -1.Those which a manager has the power to determine or at leastsignificantly affect the amount incurred.B. Uncontrollable costs –1.Are not within the manager’s control.2. A manager’s performance is evaluated using responsibilityreports that describe the department’s activities in terms ofcontrollable costs3.Distinguishing between controllable and uncontrollable costsdepends on the particular manager and the time period underanalysis.4.All costs are controllable at some level of management if the timeperiod is sufficiently long;5.Good judgment is required when identifying controllable costs.Chapter OutlineNotesC.Responsibility Accounting Performance Report1.Reports actual expenses that a manager is responsible for andtheir budgeted amounts.a.Management’s analysis of differences between actual andbudget often results in corrective actions.ed by upper management to evaluate effectiveness oflower-level managers in controlling costs.c.Recognizes that control over costs and expenses belongs toseveral layers of management.2.Responsibility Accounting Reporta.Provide relevant information for each management level.b.At lower levels, managers have limited responsibilities andtherefore fewer controllable costs.c.Responsibility and control broaden for higher-levelmanagers.III.Profit CentersA.The responsibility report focuses on how well each departmentcontrolled costs and generated revenues.B.The departmental income statement is a common way to reportprofit center performance.C.When computing department profits, two key accounting challengesinvolve allocating expenses:1.How to allocate indirect expenses, such as rent and utilities whichbenefit several departments.2.How to allocate service department expenses, such as payroll orpurchasing, that perform services that benefit severaldepartments.D.Direct and Indirect Expenses1.Direct Expenses are readily traced to a department.a.Incurred for sole benefit of that one department; no allocationrequired.b.Often, but not always, controllable costs.2.Indirect Expenses are incurred for joint benefit of more than onedepartment; can’t be readily traced to just one department.a.Allocated across departments benefiting from them.b.Ideally allocated using a cause-effect relation or, if cause-effect relation cannot be identified, allocated on a basisapproximating the benefit received by each department.c.Typically considered uncontrollable costs.Chapter OutlineNotesE.General Model – indirect and service department expenses areallocated across departments benefiting from them. Allocated using acause-effect relation. Sometimes hard to identify.1.Allocated Cost = Total Cost to Allocate x Percentage ofAllocation Base Used.F.Allocating Indirect Expenses – allocation bases vary acrossdepartments and organizations. Managers must use careful judgmentin developing allocation bases. Commonly used allocation bases:1.Wages and salaries –allocated using relative amount of hoursworked in each department.2.Rent and Utilities allocated based on portion of floor spaceoccupied. More valuable location may charge department higherrate.3.Advertising – allocated using a percentage of total sales.4.Depreciation – allocated using hours of depreciable asset used.G.Service Department expenses –provide support to an organization’soperating departments. Common allocation bases:1.Office, personnel, and payroll expenses – allocated based onnumber of employees in each department.2.Purchasing costs – allocated based on dollar amount of purchasesor number of purchase orders processed.3.Maintenance expenses – allocated based on square footage.H.Departmental Income Statements1.Departmental income is computed using the following formula:Departmental income = Dept. sales – Dept. direct expenses –Allocated indirect expenses – Allocated service dept. expenses.2.Four Steps for allocating costs and preparing departmentalincome statements:a.Step one – accumulate revenues and direct and indirectexpenses by department. Involves collecting the necessarydata from general company and departmental accounts.i.Direct and indirect expenses include salaries, depreciationand supplies expenses.b.Step two – allocate indirect expenses across both service andoperating departments.i. Uses a departmental expense allocation spreadsheetshown in Exhibit 24.10.ii.After selecting allocation bases, indirect expenses arerecorded in company accounts and allocated to bothoperating and service departments.Chapter OutlineNotesc.Step three – allocate service department expenses tooperating departments using a departmental expenseallocation spreadsheet. After service department costs areallocated, no expenses remain in the service departments.d.Step four – prepare departmental income statements using thedepartmental expense allocation spreadsheet.i. Actual service department expenses are compared withbudgeted amounts to help assess cost center performance.ii.Amounts in the operating department columns are used toprepare departmental income statements. (Exhibit 24.15)I.Departmental Contribution to Overhead (see Exhibit 24.12)1.Departmental income statements not always best for evaluatingeach profit center’s performance especially when indirectexpenses are a large portion of total expenses.2.Evaluate using departmental contributions to overhead a reportof the amount of sales less direct expenses.3.Behavioral Aspects of Departmental Performance Reports –a.Indirect expenses are typically uncontrollable, so a better wayto evaluate is using departmental contribution to overhead.b.Including indirect expenses in department manager’sperformance evaluation can lead to the manager being morecareful in using service departments.c.Some companies allocate budgeted service department costsso operating departments are not held responsible forexcessive costs from service departments.IV.Investment CenterA.Financial Performance Evaluation Measures include:1.Return on investment, return on assets, computed as investmentcenter income / by investment center average invested assets.2.Residual income – Expressed in dollars. Encourages divisionmanagers to accept all opportunities that return more than targetincome. Computed as investment center income – targetinvestment center income.3.Profit margin and investment turnover – split return oninvestment into two measures – profit margin and investmentturnover.a.Profit margin measures income earned per dollar of salescomputed as investment center income divided by investmentcenter sales. Usually use income before tax. Expressed as apercent.b.Investment turnover measures how efficiently an investmentcenter generates sales from its invested assets. Calculated asinvestment center sales divided by investment center averageassets. Expressed as the number of times assets wereconverted into sales.Chapter OutlineNotes4.Nonfinancial Performance Evaluation Measures –using solelyfinancial measures has limitations. Companies can considernonfinancial measures to help in evaluating division manager’sperformance.5.Balanced Scorecard: system of performance measures,including nonfinancial measures used to assess company anddivision manager performance. Requires managers to think oftheir company from four perspectives.a.Customer: what do they think of us?b.Internal process: which of our operations are critical?c.Innovation and learning: how can we improve?d.Financial: what do our owners think of us?V.Decision Analysis Cycle Time and Cycle EfficiencyA.As lean manufacturing practices help companies move toward justin time manufacturing it is important for companies to reduce thetime it takes to manufacture its products and improve efficiency.1.Cycle time measures the time element which describes the timeit takes to produce a product or service.Cycle time = Process + Inspection + Move + WaitTime Time Time Timea.Process time is considered value-added time – it is the onlyactivity in cycle time that adds value to the product from thecustomer’s perspective. The other three activities areconsidered non-value-added time: they add no value to thecustomer.2.Cycle Efficiency measures production efficiency. It is the ratioof value added time to total cycle time.Cycle Efficiency = Value added timecycle timea.If the cycle efficiency is low, the company should evaluatethe production process to see if it can identify ways toreduce the non-value added activities.VI.Appendix 24A – Cost Allocations uses the general model of costallocation to show how the cost allocations in Exhibits 24.10 and 24.11for A-1 Hardware. Rent expense, utilities expense, advertising expenseand insurance expense are allocated first. Then, the two servicedepartment’s expenses are allocated to the three operating departments.Chapter OutlineNotes VII.Appendix 24B – Transfer PricingThe price used to record transfers between divisions in the samecompany is called a transfer price. Can be used in cost, profit andinvestment centers.A.If there is no excess capacity, the internal supplier will not accept atransfer price less than the market price. This is called market basedtransfer pricing.B.If there is excess capacity, the internal supplier should accept a pricebetween the costs to manufacturer the part and the market price.This is called cost based transfer pricing.C.Other issues to consider in determining transfer prices include:1.Market price may not exist2.Cost controls3.Division managers’ negotiation4.Nonfinancial factors to consider include: quality control,reduced lead times and impact on employee morale.III.Appendix 24C – Joint CostsA.Joint Costs−the costs incurred to produce or purchase two or moreproducts at the same time; similar to indirect expense in that it’sshared across more than one cost object.1.Ignored when deciding to sell product as is or process further.2.Allocated to different products produced from it when total costof each product must be estimated (e.g., preparation of GAAPfinancial statements).3.Allocation basesa.Physical basis−allocates joint costs using physicalcharacteristics such as ratio of pounds, cubic feet or gallonsof each joint product to the total pounds, cubic feet orgallons of all joint products flowing from the cost; does notreflect the extra value flowing into some products or theinferior value flowing into others. Not the preferred method.b.Value basis−allocates joint cost in proportion to the salesvalue of the output produced by the process at the “split-offpoint”.Chapter 24 Alternate Demo ProblemJack and Susan Roberts own a farm that produces potatoes. Based on a review of the income statement shown below, Jack remarked that they should have fed the No. 3 potatoes to the pigs; then they would have avoided the loss from the sale of the those potatoes.JACK AND SUSAN ROBERTSIncome from the Production and Sale of PotatoesFor Year Ended December 31, 20xxResults by GradeSales by grades:No. 1, 300,000 lbs. $0.045 per lb.No. 2, 500,000 lbs. $0.04 per lb.No. 3, 200,000 lbs. $0.03 per lb.CombinedCosts:Land preparation, seed,planting,cultivating @ $0.01422 per lb.Harvesting, sorting, grading@ $0.01185 per lb.Marketing @ $0.00415 per lb.Total costsNet income (or loss)Jack and Susan divided their costs among the grades on a per pound basis, because their records do not show cost per grade. However, their records did show that $4,020 of the $4,150 of marketing costs represented the cost of placing the No. 1 and No. 2 potatoes in bags and hauling them to the warehouse of the produce buyer. Bagging and hauling costs were the same for both grades. The remaining $130 represented the cost of loading the No.3 potatoes into the trucks of the potato starch factory that bought these potatoes in bulk and picked them up at the farm.Required:Prepare an income statement that will better show the results of producing and marketing the each of the grades of potatoes.Chapter 24 Alternate Demo Problem: SolutionJACK AND SUSAN ROBERTSIncome from the Production and Sale of PotatoesFor Year Ended December 31, 20xxRevenue from sales:Costs:Land preparation, seed,planting, cultivatingHarvesting, sorting, gradingMarketingTotal costsNet incomeCOST ALLOCATIONSLand preparation, seed, planting, andcultivating:No. 1: $13,500 / $39,500 x $14,220 = No. 2: $20,000 / $39,500 x $14,220 = No. 3: $ 6,000 / $39,500 x $14,220 = $ 4,8607,2002,160 $14,220Harvesting, sorting, and grading:No. 1: $13,500 / $39,500 x $11,850 = No. 2: $20,000 / $39,500 x $11,850 = No. 3: $ 6,000 / $39,500 x $11,850 = $ 4,0506,0001,800 $11,850Marketing:No. 1: $13,500 / $33,500 x $4,020 = No. 2: $20,000 / $33,500 x $4,020 = $1,620 2,400Subtotal bagging and hauling costs 4,020 No. 3: Loading costs 130$4,150。
会计英语备课教案
会计英语备课教案《会计英语》备课教案Unit OneI. Preview Q:What is accounting?Is it different with bookkeeping?II. Language Points:1. Accounting: 会计,会计学 Accountancy: 英国⽤词,与accounting词义相同Accountant: 会计员,会计师 Account: 账户,会计科⽬Oxford Dictionary of Accounting: The process of identifying, measuring, recording, and communicating economic transactions. Measurement is normally made in monetary terms.Textbook: Accounting is an information system necessitated by the great complexity of modern business.会计是由于现代企业的巨⼤复杂性⽽成为必要的信息系统Textbook: Accounting is often described as an information system. It isthe system that measures business activities, processesinformation into reports and communicates these findings todecision makersDong Cai Textbook: Accounting is a process of recording, classifying, summarizing, and interpreting of those business activities that can be expressed in monetary terms. 2.Specialize: 专门研究 n. Specialist: 专家3.Qualified: adj.1) Having the appropriate qualifications for an office, a position, or a task. 有资格的Are you qualified to doctor? 你有资格当医⽣吗?2) Limited, restricted, or modified 有限的,受限制的,有条件的She gave qualified agreement. 她表⽰有条件的同意。
会计学原理英文ppt课件Chapter_05Accounting for Merchandising Opera
Credit Terms
Discount Period
Credit Period
Time
Amount Due
Due: Invoice price minus
discount
Date of
Invoice
Due: Full Invoice Price
McGraw-Hill/Irwin
Slide 11
P1
Quantity sold Price per unit Total Less 30% discount Invoice price
1,000 $ 5.25
5,250 (1,575) $ 3,675
Slide 9
P1
Invoice
Main Source, Inc.
Invoice
614 Tech Avenue Nashville, TN 37651
C3
INVENTORY SYSTEMS
Beginning inventory
+
Net cost of purchases
= Merchandise available for sale
Ending inventory
McGraw-Hill/Irwin
+
Cost of goods sold
Slide 6
P.O. Date Salesperson 4/25/2009 #25
Terms 2/10,n/30
Freight FOB Destination
ViaSFheipdExGoods
Item AC417
Description 250 Backup System
Total invoice Quanity Price
会计学原理(英文)

《会计学原理(英文)》教学大纲王燕祥编写工商管理专业课程教学大纲610 目录Chapter 1 Accounting in Action 第一章会计实践活动 (613)学习目标 (613)Teaching and homework hours 教学与作业时间 (613)Reading and References 学生必读和参考书目 (613)Chapter 2 The Recording Process 第二章记录过程 (615)学习目标 (615)Teaching and homework hours 教学与作业时间 (615)Reading and References 学生必读和参考书目 (615)Chapter 3 Adjusting the Accounts 第三章调整账户 (617)学习目标 (617)Teaching and homework hours 教学与作业时间 (617)Reading and References 学生必读和参考书目 (617)Chapter 4 Completion of the Accounting Cycle 第四章完成会计循环 (619)学习目标 (619)Teaching and homework hours 教学与作业时间 (619)Reading and References 学生必读和参考书目 (619)Chapter 5 Accounting for Merchandising Operations 第五章商品经营活动的会计核算 (621)学习目标 (621)Teaching and homework hours 教学与作业时间 (621)Reading and References 学生必读和参考书目 (621)Chapter 6 Inventories 第六章存货 (623)学习目标 (623)Teaching and homework hours 教学与作业时间 (624)Reading and References 学生必读和参考书目 (624)Chapter 7 Accounting Information Systems 第七章会计信息系统 (626)学习目标 (626)Teaching and homework hours 教学与作业时间 (626)Reading and References 学生必读和参考书目 (626)Chapter 8 Internal Control and Cash 第八章内部控制和现金 (628)学习目标 (628)Teaching and homework hours 教学与作业时间 (628)Reading and References 学生必读和参考书目 (628)Chapter 9 Accounting for Receivables 第九章应收款项的会计核算 (630)学习目标 (630)Teaching and homework hours 教学与作业时间 (630)Reading and References 学生必读和参考书目 (630)Chapter 10 Plant Assets, Natural Resources, and Intangible Assets 第十章厂场资产、自然资源和无形资产 (632)会计学原理(英文)学习目标 (632)Teaching and homework hours 教学与作业时间 (632)Reading and References 学生必读和参考书目 (633)Chapter 11 Current Liabilities and Payroll Accounting 第十一章流动负债和工资的核算 (634)学习目标 (634)Teaching and homework hours 教学与作业时间 (634)Reading and References 学生必读和参考书目 (634)Chapter 12 Accounting Principles 第十二章会计原则 (636)学习目标 (636)Teaching and homework hours 教学与作业时间 (636)Reading and References 学生必读和参考书目 (636)Chapter 13 Accounting for Partnerships 第十三章合伙企业的会计核算 (638)学习目标 (638)Teaching and homework hours 教学与作业时间 (638)Reading and References 学生必读和参考书目 (638)Chapter 14 Corporations: Organization and Capital Stock Transactions 第十四章公司:组织和股本交易 (640)学习目标 (640)Teaching and homework hours 教学与作业时间 (640)Reading and References 学生必读和参考书目 (640)Chapter 15 Corporations: Dividends, Retained Earnings, and Income Reporting 第十五章股利、保留盈余和收益报告 (642)学习目标 (642)Teaching and homework hours 教学与作业时间 (642)Reading and References 学生必读和参考书目 (642)Chapter 16 Long-Term Liabilities 第十六章长期负债 (644)学习目标 (644)Teaching and homework hours 教学与作业时间 (644)Reading and References 学生必读和参考书目 (644)Chapter 17 Investments 第十七章投资 (646)学习目标 (646)Teaching and homework hours 教学与作业时间 (646)Reading and References 学生必读和参考书目 (646)Chapter 18 The Statement of Cash Flows 第十八章现金流量表 (648)学习目标 (648)Teaching and homework hours 教学与作业时间 (648)Reading and References 学生必读和参考书目 (648)Chapter 19 Financial Statement Analysis 第十九章财务报表分析 (650)学习目标 (650)Teaching and homework hours 教学与作业时间 (650)Reading and References 学生必读和参考书目 (650)Chapter 20 Managerial Accounting 第二十章管理会计 (652)611工商管理专业课程教学大纲612 学习目标 (652)Teaching and homework hours 教学与作业时间 (652)Reading and References 学生必读和参考书目 (652)Chapter 21 Job Order Cost Accounting 第二十一章分批成本法 (654)学习目标 (654)Teaching and homework hours 教学与作业时间 (654)Reading and References 学生必读和参考书目 (654)Chapter 22 Process Cost Accounting 第二十二章分步成本法 (656)学习目标 (656)Teaching and homework hours 教学与作业时间 (656)Reading and References 学生必读和参考书目 (657)Chapter 23 Cost-V olume-Profit Relationships 第二十三章本量利分析 (658)学习目标 (658)Teaching and homework hours 教学与作业时间 (658)Reading and References 学生必读和参考书目 (659)Chapter 24 Budgetary Planning 第二十四章编制预算 (660)学习目标 (660)Teaching and homework hours 教学与作业时间 (660)Reading and References 学生必读和参考书目 (660)Chapter 25 Budgetary Control and Responsibility Accounting 第二十五章预算控制和责任会计 662 学习目标 (662)Teaching and homework hours 教学与作业时间 (662)Reading and References 学生必读和参考书目 (662)Chapter 26 Performance Evaluation through Standard Costs 第二十六章利用标准成本进行业绩评价 (664)学习目标 (664)Teaching and homework hours 教学与作业时间 (664)Reading and References 学生必读和参考书目 (664)Chapter 27 Incremental Analysis and Capital Budgeting 第二十七章增量分析和资本预算 (666)学习目标 (666)Teaching and homework hours 教学与作业时间 (667)Reading and References 学生必读和参考书目 (667)会计学原理(英文)Chapter 1 Accounting in Action第一章会计实践活动STUDY OBJECTIVESAfter studying this chapter you should be able to:1.Explain what accounting is.2.IDENTIFY THE USERS AND USES OF ACCOUNTING.3.UNDERSTAND WHY ETHICS IS A FUNDAMENTAL BUSINESS CONCEPT.4.EXPLAIN THE MEANING OF GENERALLY ACCEPTED ACCOUNTING PRINCIPLESAND THE COST PRINCIPLE.5.EXPLAIN THE MEANING OF THE MONETARY UNIT ASSUMPTION AND THE ECONOMIC ENTITY ASSUMPTION.6.STATE THE BASIC ACCOUNTING EQUATION AND EXPLAIN THE MEANING OF ASSETS, LIABILITIES, AND OWNER’S EQUITY.7.ANALYZE THE EFFECT OF BUSINESS TRANSACTIONS ON THE BASIC ACCOUNTING EQUATION.8.Understand what the four financial statements are and how they are prepared.学习目标学完本章之后,学生应该能够达到以下目标:1.解释什么是会计。
会计学原理23版 英文版教学书册Wild FAP 23e Ch24 IRM
CHAPTER 24 PERFORMANCE MEASUREMENT AND RESPONSIBILITY ACCOUNTING*See additional information on next page that pertains to these quick studies, exercises and problems. SP refers to the Serial ProblemES refers to Excel SimulationsAdditional Information on Related Assignment MaterialConnectA vailable on the instructor’s course-specific website) repeats all numerical Quick Studies, all Exercises and Problems Set A. Connect also provides algorithmic versions for Quick Study, Exercises and Problems. It allows instructors to monitor, promote, and assess student learning. It can be used in practice, homework, or exam mode.Connect InsightThe first and only analytics tool of its kind, Connect Insight is a series of visual data displays that are each framed by an intuitive question and provide at-a-glance information regarding how an instructor’s class is performing. Connect Insight is available through Connect titles.The Serial Problem (SP) for Success Systems continues in this chapter.General LedgerAssignable within Connect, General Ledger (GL) problems offer students the ability to see how transactions post from the general journal all the way through the financial statements. Critical thinking and analysis components are added to each GL problem to ensure understanding of the entire process. GL problems are auto-graded and provide instant feedback to the student.Excel SimulationsAssignable within Connect, Excel Simulations allow students to practice their Excel skills—such as basic formulas and formatting—within the context of accounting. These questions feature animated, narrated Help and Show Me tutorials (when enabled). Excel Simulations are auto-graded and provide instant feedback to the student. Synopsis of Chapter RevisionsNEW opener—Ministry of Supply and entrepreneurial assignment.Reorganized chapter.Revised discussion of performance evaluation and decentralization.Revised discussion of Kraft Heinz responsibility centers.Revised exhibit on responsibility accounting.Revised discussion of responsibility accounting reports.Added NTKs on responsibility accounting, cost allocations, and balanced scorecard.Revised discussion of indirect expense allocations.New exhibit and discussion of general model of expense allocation.New exhibit on common allocation bases for indirect expenses.Revised discussion of preparing departmental income.New exhibit and formula for computing departmental income.Added short section on transfer pricing to the chapter.New Sustainability section with discussion of General Mills, Target and performance reporting, and Ministry of Supply example.Chapter OutlineNotes I.Responsibility AccountingA. Performance Evaluationrge companies are easier to manage if divided into smallerunits called divisions, segments, or departments.2.In decentralized organizations, decisions are made by unitmanagers rather than top management.3.In responsibility accounting, unit managers are evaluated onlyon what they are responsible for.4.The methods of performance evaluation vary for cost centers,profit centers and investment centers.a.Cost center−incurs cost or expenses without directlygenerating revenues (e.g. manufacturing department andservice department).b.Profit center−incurs costs and generates revenues (e.g.product centers).c.Investment center−incurs costs, generates revenues and isresponsible for effectively using center assets.5.Basis for evaluating performance:a.Cost center managers are evaluated on their success incontrolling costs compared to budgeted costs. Profit center:ability to generate more revenue than expenses.b.Profit center managers are evaluated on their success ingenerating income.c.Investment center managers are evaluated on their use ofinvestment-center assets to generate income.II.Controllable versus Uncontrollable CostsA.Controllable Costs -1.Those which a manager has the power to determine or at leastsignificantly affect the amount incurred.B. Uncontrollable costs –1.Are not within the manager’s control.2. A manager’s performance is evaluated using responsibilityreports that describe the department’s activities in terms ofcontrollable costs3.Distinguishing between controllable and uncontrollable costsdepends on the particular manager and the time period underanalysis.4.All costs are controllable at some level of management if the timeperiod is sufficiently long;5.Good judgment is required when identifying controllable costs.Chapter OutlineNotesC.Responsibility Accounting Performance Report1.Reports actual expenses that a manager is responsible for andtheir budgeted amounts.a.Management’s analysis of differences between actual andbudget often results in corrective actions.ed by upper management to evaluate effectiveness oflower-level managers in controlling costs.c.Recognizes that control over costs and expenses belongs toseveral layers of management.2.Responsibility Accounting Reporta.Provide relevant information for each management level.b.At lower levels, managers have limited responsibilities andtherefore fewer controllable costs.c.Responsibility and control broaden for higher-levelmanagers.III.Profit CentersA.The responsibility report focuses on how well each departmentcontrolled costs and generated revenues.B.The departmental income statement is a common way to reportprofit center performance.C.When computing department profits, two key accounting challengesinvolve allocating expenses:1.How to allocate indirect expenses, such as rent and utilities whichbenefit several departments.2.How to allocate service department expenses, such as payroll orpurchasing, that perform services that benefit severaldepartments.D.Direct and Indirect Expenses1.Direct Expenses are readily traced to a department.a.Incurred for sole benefit of that one department; no allocationrequired.b.Often, but not always, controllable costs.2.Indirect Expenses are incurred for joint benefit of more than onedepartment; can’t be readily traced to just one department.a.Allocated across departments benefiting from them.b.Ideally allocated using a cause-effect relation or, if cause-effect relation cannot be identified, allocated on a basisapproximating the benefit received by each department.c.Typically considered uncontrollable costs.Chapter OutlineNotesE.General Model – indirect and service department expenses areallocated across departments benefiting from them. Allocated using acause-effect relation. Sometimes hard to identify.1.Allocated Cost = Total Cost to Allocate x Percentage ofAllocation Base Used.F.Allocating Indirect Expenses – allocation bases vary acrossdepartments and organizations. Managers must use careful judgmentin developing allocation bases. Commonly used allocation bases:1.Wages and salaries –allocated using relative amount of hoursworked in each department.2.Rent and Utilities allocated based on portion of floor spaceoccupied. More valuable location may charge department higherrate.3.Advertising – allocated using a percentage of total sales.4.Depreciation – allocated using hours of depreciable asset used.G.Service Department expenses –provide support to an organization’soperating departments. Common allocation bases:1.Office, personnel, and payroll expenses – allocated based onnumber of employees in each department.2.Purchasing costs – allocated based on dollar amount of purchasesor number of purchase orders processed.3.Maintenance expenses – allocated based on square footage.H.Departmental Income Statements1.Departmental income is computed using the following formula:Departmental income = Dept. sales – Dept. direct expenses –Allocated indirect expenses – Allocated service dept. expenses.2.Four Steps for allocating costs and preparing departmentalincome statements:a.Step one – accumulate revenues and direct and indirectexpenses by department. Involves collecting the necessarydata from general company and departmental accounts.i.Direct and indirect expenses include salaries, depreciationand supplies expenses.b.Step two – allocate indirect expenses across both service andoperating departments.i. Uses a departmental expense allocation spreadsheetshown in Exhibit 24.10.ii.After selecting allocation bases, indirect expenses arerecorded in company accounts and allocated to bothoperating and service departments.Chapter OutlineNotesc.Step three – allocate service department expenses tooperating departments using a departmental expenseallocation spreadsheet. After service department costs areallocated, no expenses remain in the service departments.d.Step four – prepare departmental income statements using thedepartmental expense allocation spreadsheet.i. Actual service department expenses are compared withbudgeted amounts to help assess cost center performance.ii.Amounts in the operating department columns are used toprepare departmental income statements. (Exhibit 24.15)I.Departmental Contribution to Overhead (see Exhibit 24.12)1.Departmental income statements not always best for evaluatingeach profit center’s performance especially when indirectexpenses are a large portion of total expenses.2.Evaluate using departmental contributions to overhead a reportof the amount of sales less direct expenses.3.Behavioral Aspects of Departmental Performance Reports –a.Indirect expenses are typically uncontrollable, so a better wayto evaluate is using departmental contribution to overhead.b.Including indirect expenses in department manager’sperformance evaluation can lead to the manager being morecareful in using service departments.c.Some companies allocate budgeted service department costsso operating departments are not held responsible forexcessive costs from service departments.IV.Investment CenterA.Financial Performance Evaluation Measures include:1.Return on investment, return on assets, computed as investmentcenter income / by investment center average invested assets.2.Residual income – Expressed in dollars. Encourages divisionmanagers to accept all opportunities that return more than targetincome. Computed as investment center income – targetinvestment center income.3.Profit margin and investment turnover – split return oninvestment into two measures – profit margin and investmentturnover.a.Profit margin measures income earned per dollar of salescomputed as investment center income divided by investmentcenter sales. Usually use income before tax. Expressed as apercent.b.Investment turnover measures how efficiently an investmentcenter generates sales from its invested assets. Calculated asinvestment center sales divided by investment center averageassets. Expressed as the number of times assets wereconverted into sales.Chapter OutlineNotes4.Nonfinancial Performance Evaluation Measures –using solelyfinancial measures has limitations. Companies can considernonfinancial measures to help in evaluating division manager’sperformance.5.Balanced Scorecard: system of performance measures,including nonfinancial measures used to assess company anddivision manager performance. Requires managers to think oftheir company from four perspectives.a.Customer: what do they think of us?b.Internal process: which of our operations are critical?c.Innovation and learning: how can we improve?d.Financial: what do our owners think of us?V.Decision Analysis Cycle Time and Cycle EfficiencyA.As lean manufacturing practices help companies move toward justin time manufacturing it is important for companies to reduce thetime it takes to manufacture its products and improve efficiency.1.Cycle time measures the time element which describes the timeit takes to produce a product or service.Cycle time = Process + Inspection + Move + WaitTime Time Time Timea.Process time is considered value-added time – it is the onlyactivity in cycle time that adds value to the product from thecustomer’s perspective. The other three activities areconsidered non-value-added time: they add no value to thecustomer.2.Cycle Efficiency measures production efficiency. It is the ratioof value added time to total cycle time.Cycle Efficiency = Value added timecycle timea.If the cycle efficiency is low, the company should evaluatethe production process to see if it can identify ways toreduce the non-value added activities.VI.Appendix 24A – Cost Allocations uses the general model of costallocation to show how the cost allocations in Exhibits 24.10 and 24.11for A-1 Hardware. Rent expense, utilities expense, advertising expenseand insurance expense are allocated first. Then, the two servicedepartment’s expenses are allocated to the three operating departments.Chapter OutlineNotes VII.Appendix 24B – Transfer PricingThe price used to record transfers between divisions in the samecompany is called a transfer price. Can be used in cost, profit andinvestment centers.A.If there is no excess capacity, the internal supplier will not accept atransfer price less than the market price. This is called market basedtransfer pricing.B.If there is excess capacity, the internal supplier should accept a pricebetween the costs to manufacturer the part and the market price.This is called cost based transfer pricing.C.Other issues to consider in determining transfer prices include:1.Market price may not exist2.Cost controls3.Division managers’ negotiation4.Nonfinancial factors to consider include: quality control,reduced lead times and impact on employee morale.III.Appendix 24C – Joint CostsA.Joint Costs−the costs incurred to produce or purchase two or moreproducts at the same time; similar to indirect expense in that it’sshared across more than one cost object.1.Ignored when deciding to sell product as is or process further.2.Allocated to different products produced from it when total costof each product must be estimated (e.g., preparation of GAAPfinancial statements).3.Allocation basesa.Physical basis−allocates joint costs using physicalcharacteristics such as ratio of pounds, cubic feet or gallonsof each joint product to the total pounds, cubic feet orgallons of all joint products flowing from the cost; does notreflect the extra value flowing into some products or theinferior value flowing into others. Not the preferred method.b.Value basis−allocates joint cost in proportion to the salesvalue of the output produced by the process at the “split-offpoint”.Chapter 24 Alternate Demo ProblemJack and Susan Roberts own a farm that produces potatoes. Based on a review of the income statement shown below, Jack remarked that they should have fed the No. 3 potatoes to the pigs; then they would have avoided the loss from the sale of the those potatoes.JACK AND SUSAN ROBERTSIncome from the Production and Sale of PotatoesFor Year Ended December 31, 20xxResults by GradeSales by grades:No. 1, 300,000 lbs. $0.045 per lb.No. 2, 500,000 lbs. $0.04 per lb.No. 3, 200,000 lbs. $0.03 per lb.CombinedCosts:Land preparation, seed,planting,cultivating @ $0.01422 per lb.Harvesting, sorting, grading@ $0.01185 per lb.Marketing @ $0.00415 per lb.Total costsNet income (or loss)Jack and Susan divided their costs among the grades on a per pound basis, because their records do not show cost per grade. However, their records did show that $4,020 of the $4,150 of marketing costs represented the cost of placing the No. 1 and No. 2 potatoes in bags and hauling them to the warehouse of the produce buyer. Bagging and hauling costs were the same for both grades. The remaining $130 represented the cost of loading the No.3 potatoes into the trucks of the potato starch factory that bought these potatoes in bulk and picked them up at the farm.Required:Prepare an income statement that will better show the results of producing and marketing the each of the grades of potatoes.Chapter 24 Alternate Demo Problem: SolutionJACK AND SUSAN ROBERTSIncome from the Production and Sale of PotatoesFor Year Ended December 31, 20xxRevenue from sales:Costs:Land preparation, seed,planting, cultivatingHarvesting, sorting, gradingMarketingTotal costsNet incomeCOST ALLOCATIONSLand preparation, seed, planting, andcultivating:No. 1: $13,500 / $39,500 x $14,220 = No. 2: $20,000 / $39,500 x $14,220 = No. 3: $ 6,000 / $39,500 x $14,220 = $ 4,8607,2002,160 $14,220Harvesting, sorting, and grading:No. 1: $13,500 / $39,500 x $11,850 = No. 2: $20,000 / $39,500 x $11,850 = No. 3: $ 6,000 / $39,500 x $11,850 = $ 4,0506,0001,800 $11,850Marketing:No. 1: $13,500 / $33,500 x $4,020 = No. 2: $20,000 / $33,500 x $4,020 = $1,620 2,400Subtotal bagging and hauling costs 4,020 No. 3: Loading costs 130$4,150。
会计学原理英文课件 (3)
LO 1
Accrual- versus Cash-Basis Accounting
Accrual-Basis Accounting
Learning Objective 2
Explain the accrual basis of accounting.
Transactions recorded in the periods in
3-12
LO 2
ETHICS INSIGHT
Cooking the Books?
Why Accuracy Krispy Kreme (USA) Matters
Allegations of abuse of the revenue recognition principle have become all too common in recent years. For example, it was alleged that Krispy Kreme (USA) sometimes doubled the number of doughnuts shipped to wholesale customers at the end of a quarter to boost quarterly results. The customers shipped the unsold doughnuts back after the beginning of the next quarter for a refund. Conversely, Computer Associates International (USA) was accused of backdating sales—that is, reporting a sale in one period that did not actually occur until the next period in order to achieve the earlier period’s sales targets.
基础会计英文版教学设计
基础会计英文版教学设计1. IntroductionThe teaching of accounting is vital in today’s fast-paced business environment. Students need to understand the basic concepts and principles of accounting and develop critical thinking skills to apply the theories to various real-life scenarios. This document outlines a teaching plan for basic accounting in an English language environment.2. ObjectivesThe objectives of this course are to:1.Introduce students to the basic principles ofaccounting2.Develop students’ analytical s kills to interpretfinancial statements3.Develop students’ communication skills inexpressing accounting concepts in English4.Apply the concepts and theories covered in thecourse to practical business scenarios5.Enhance students’ understanding of the account ingprofession and its ethical considerations3. Course Outline3.1 Course OverviewThis course ms to provide students with a solid understanding of fundamental accounting concepts and techniques. The course will cover the following topics: •The accounting equation•Recording financial transactions•The trial balance•Adjusting entries•Financial statements•The statement of cash flows•Inventory valuation•Depreciation and amortization•Liabilities and equity•Revenues and expenses•Financial statement analysis•Accounting ethics and professionalism3.2 Course ScheduleWeek Topic RequiredReading SupplementaryMaterialsAssignments1 Introduction to Chapter 1 Business News QuizReading Materials Accounting Articles2 The AccountingEquation Chapter 2 Real-lifefinancialstatementsHomework3 RecordingFinancialTransactionsChapter 3 Case studies Quiz4 The Trial Balance Chapter 4 VideotutorialsHomework5 Adjusting Entries Chapter 5 Business NewsArticlesQuiz6 FinancialStatements Chapter 6 Real-lifefinancialstatementsHomework7 The Statement ofCash FlowsChapter 7 Case studies Quiz8 InventoryValuation Chapter 8 VideotutorialsHomework9 Depreciation andAmortization Chapter 9 Business NewsArticlesQuizReading Materials10 Liabilities andEquity Chapter10Real-lifefinancialstatementsHomework11 Revenues andExpenses Chapter11Case studies Quiz12 FinancialStatementAnalysis Chapter12VideotutorialsHomework13 Accounting EthicsandProfessionalism Chapter13Business NewsArticlesQuiz14 Review andEvaluation ReviewallchaptersReviewquestions andexercisesFinal exam4. Teaching Strategies4.1 LecturesLectures will be used to introduce new concepts and theories. These will be conducted in English to enhance students’ language skills and familiarity with accounting terminology.4.2 Case StudiesCase studies will be used to analyse and interpret real-life business scenarios. These cases will be designed to stimulate critical thinking and problem-solving skills.4.3 HomeworkHomework assignments will be used to reinforce the concepts and theories covered in class. These assignmentswill be graded and contribute to the final course grade.4.4 QuizzesQuizzes will be given after each topic to ensure students have a strong understanding of the concepts covered. These quizzes will be graded and contribute to the final course grade.4.5 Final ExamThe final exam will cover all topics covered in the course and will test students’ understanding and application of accounting concepts in English.5. AssessmentThe assessment will include a range of methods to evaluate students’ understanding of the course material, includinghomework assignments, quizzes, and a final exam. The breakdown of grades is as follows:Assessments WeightingHomework Assignments 30%Quizzes 30%Final Exam 40%6. ConclusionThis teaching plan ms to provide students with a comprehensive understanding of fundamental accounting concepts and techniques. The course will be conducted in English to enhance students’ language skills and familiarity with accounting terminology. A range of teaching strategies will be employed to stimulate critical thinking and problem-solving skills. The assessment will be based on a combination of homework assignments, quizzes, and a final exam.。
- 1、下载文档前请自行甄别文档内容的完整性,平台不提供额外的编辑、内容补充、找答案等附加服务。
- 2、"仅部分预览"的文档,不可在线预览部分如存在完整性等问题,可反馈申请退款(可完整预览的文档不适用该条件!)。
- 3、如文档侵犯您的权益,请联系客服反馈,我们会尽快为您处理(人工客服工作时间:9:00-18:30)。
Slide 9
P1
Invoice
Main Source, Inc.
Invoice
614 Tech Avenue Nashville, TN 37651
S o l d
T
o
Date
5/4/09
Number 358-BI
Name: Barbee, Inc.
Attn: Tom Bell
Address: One Willow Plaza
McGraw-Hill/Irwin
Slide 8
P1
TRADE DISCOUNTS
Used by manufacturers and wholesalers to offer better prices for greater quantities purchased.
Example
Z-Mart offers a 30% trade discount on orders of 1,000 units or more of their popular
Examples: sporting goods, clothing, and auto parts stores
Net Sales
Minus
Cost of Equals
Goods Sold
Gross Profit
Minus
Expenses
Equals Net
Income
Merchandising Company Income Statement
On November 2, Z-Mart purchased $1,200 of merchandise inventory for cash.
Nov 2
Merchandise Inventory Cash
Purchase merchandise for cash
Dr. 1,200
Cr. 1,200
Examples: Accounting firms, law firms and plumbing services
Revenues
Minus
Equals Expenses
Net income
McGraw-Hill/Irwin
Slide 2
C1
MERCHANDISING ACTIVITIES
Merchandising Companies
product Racer. Each Racer has a list price of $5.25.
McGraw-Hill/Irwin
Quantity sold Price per unit Total Less 30% discount Invoice price
1,000 $ 5.25
5,250 (1,575) $ 3,675
Slide 6
C3
PERPETUAL AND PERIODIC
INVENTORY SYSTEMS
Perpetual systems
continually update accounting records for merchandising transactions
Periodic systems
Cookeville, Tennessee
38501
Seller Invoice date Purchaser Order date Credit terms Freight terms
P.O. Date Salesperson 4/25/2009 #25
Terms 2/10,n/30
Cash Sale
Purchases
Credit Sale
Cash collection
Purchases
Cash sales
Account receivable
Merchandise inventory
McGraw-Hill/Irwin
Merchandise inventory
Credit sales
ACCOUNTING FOR MERCHANDISING OPERATIONS
Chapter 5
© 2009 The McGraw-Hill Companies, Inc.,
SERVICE COMPANIES
Service organizations sell time to earn revenue.
Slide 5
C3
INVENTORY SYSTEMS
Beginning inventory
+
Net cost of purchases
= Merchandise available for sale
Ending inventory
McGraw-Hill/Irwin
+
Cost of goods sold
Manufacturer
Wholesaler
ler
Customer
McGraw-Hill/Irwin
Slide 3
C1
REPORTING INCOME FOR A
MERCHANDISER
Merchandising companies sell products to earn revenue.
For Year Ended December 31, 2009
McGraw-Hill/Irwin
Net sales Cost of goods sold Gross profit Operating expenses Net income
$ 150,000 80,000
$ 70,000 46,500
Freight FOB Destination
ViaSFheipdExGoods
Item AC417
Description 250 Backup System
$ 23,500
Slide 4
C2
OPERATING CYCLE FOR A
MERCHANDISER
Begins with the purchase of merchandise and ends with the collection of cash from the
sale of merchandise.
accounting records relating to merchandise transactions are updated only at the end of the accounting period
McGraw-Hill/Irwin
Slide 7
P1
MERCHANDISE PURCHASES