nike,costofcapital资本成本分析案例
cost of capital acca 计算
cost of capital acca 计算成本资本是指企业为了筹集资金所要支付的利息和股息的成本。
ACCA考试中的成本资本题目主要涉及到成本资本的计算和应用。
本文将通过解释成本资本的概念、计算方法以及应用案例,详细说明ACCA考试中与成本资本有关的内容。
首先,我们来了解成本资本的概念。
成本资本是企业为了融资所要支付的成本,它是企业投入资本的机会成本。
成本资本通常由债务和股权的成本构成。
债务的成本是企业支付借款利息所产生的成本,而股权的成本则是企业支付股息所产生的成本。
企业需要知道自己的成本资本,以便在决策过程中对不同项目进行评估和决策。
其次,我们要了解成本资本的计算方法。
成本资本的计算可以采用权益成本法和加权平均成本法。
权益成本法是基于股权的成本计算方法,它通过计算股息和股权市场价格得出成本资本。
加权平均成本法是基于债务和股权的比例计算方法,它通过将债务和股权的成本加权平均得出成本资本。
在ACCA考试中,一般会给出具体的数据,要求学员使用特定的计算方法来计算成本资本。
最后,我们来看一下成本资本在实际案例中的应用。
成本资本的使用通常涉及到投资决策、资本预算和市场估值。
企业在做投资决策时需要比较项目的收益率与成本资本的大小,以判断该项目的可行性。
同时,在资本预算过程中,企业也需要考虑成本资本,以确定投资项目的优先次序。
另外,市场估值也需要考虑成本资本,投资者通常会使用成本资本来计算股票的内在价值。
在ACCA考试中,成本资本经常出现在资本预算和投资决策的题目中。
学员需要掌握成本资本的概念和计算方法,以便在考试中准确回答相关问题。
此外,了解成本资本的应用案例也能帮助学员更好地理解和应用这一概念。
总结起来,ACCA考试中的成本资本题目涉及到成本资本的计算和应用。
学员需要掌握成本资本的概念、计算方法和应用案例,以便在考试中准确回答问题。
通过学习和理解这些内容,学员可以更好地应对ACCA考试中关于成本资本的题目。
资本成本问题研究TheCostofCapital
绝大部分分析者运用5%到 6.5%的 比率作 为市场风险补偿 (RPM)
贝他值的估计在资本资产定价模型中是一 个至关紧要的数据. 美国的有关贝他值数 据请登陆网站浏览 .
我国上市公司贝他值(β)的估计还不是 很规范,但通过有关证券分析机构可以获 得此类数据。
Coca-Cola (KO)
6.9 33.8%
H.J. Heinz (HNZ)
6.5 74.9%
Georgia-Pacific (GP)
5.9 69.9%
9-5
资本成本与企业财务管理
公司总资本成本 12%
A子公司资本成本 10%
B子公司资本成本 12%
C子公司资本成本 14%
甲项目资本成本 8%
乙项目资本成本 12%
9 - 12
债务成本
方法 1: 咨询投资银行适用于新增债务上 的利率水平.
方法 2: 以其他类似信用评级债券的利率 水平作为债务成本.
方法 3: 计算、估计公司债券的报酬率.
9 - 13
债务资本成本的估计
如果实际的融资成本不是很高,则可以 契约中商定的利率水平作为税前资本成 本。银行贷款等的资本成本大体可以这 样计算。
投资者选择问题
9 - 25
invest
S h a re ho ld e r
in ve st
F ir m
return
re tu rn
Financial M arket
P ro je c t
只有当企业投资项目的期望报酬率高于同等级风险的金融投资的报酬 率水平(即投资者的要求报酬率)的时候,股票投资者才会希望将资 金投入到企业中.
9 - 41
股利增长模型方法的优劣势
nike案例分析
Her risk free rate comes from 20-year T-bond rate Cohen uses average beta from 1996 to July 2001, 0.80. Cohen uses a geometric mean of market risk premium 5.9%
The WACC
Thus, my calculation of the WACC is as follow:
4.44%*0.101 + 9.81%*0.899 = 9.27%
What should Kimi Ford recommend regarding an investment in Nike?
Cost of debt
The WACC is used for discounting cash flows in the future, thus all components of cost must reflect firm’s concurrent or future abilities in raising capital. Cohen mistakenly uses the historical data in estimating the cost of debt. She divided the interest expenses by the average balance of debt to get 4.3% of before tax cost of debt. It may not reflect Nike’s current or future cost of debt.
Comments on cost of equity – The market risk premium
耐克公司案例中文版
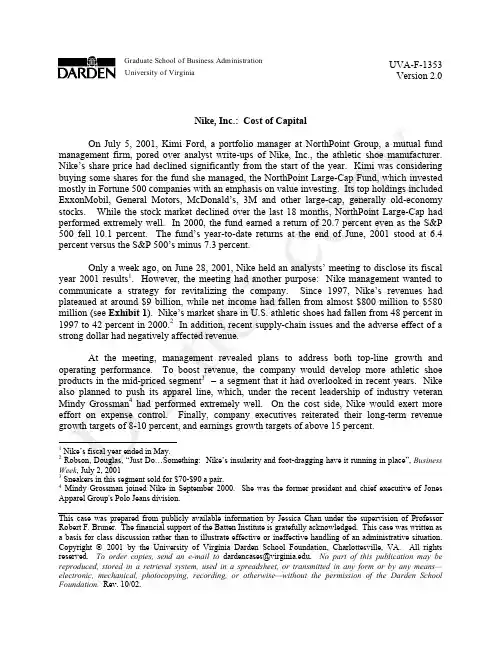
耐克公司:资本成本2001年7月5日,KIMI FORD,NORTHPOINT 集团(实际是一家基金管理公司)的portforlio经理,仔细思考着分析人员关于耐克公司的积极评论。
耐克的股票价格从年初开始显著下跌。
FORD正在考虑为她管理的NORTHPOINT 大资本基金公司购买一些股份,这家基金公司主要投资财富杂志世界500强企业,其重点是价值投资。
它持有最多的股份包括埃克森公司、通用公司、麦当劳、3M及其它大企业,通常是经济历史悠久的股票。
虽然股票市场在过去18个月下跌,NORTHPOINT大资本基金公司却表现极好。
2000年,这家基金回报率20.7%,而S&P500甚至下跌了10.1%。
到2001年6月底,这家基金的YEAR-TO-DATE回报率为6.4%,而S&P500为7.3%。
一个星期前的2001年6月28日,耐克公司组织了分析人员会议,发布2001财政年度业绩(耐克的财务年度结束于每年5月份)。
不过,这次会议还有另外一个目的:耐克公司管理层希望沟通重振公司的战略。
1997年以来,耐克公司的总收入上升并稳定于90亿美元左右,而净收入从8亿美元左右下跌到5.8亿美元左右(见表一)。
耐克在美国运动鞋市场的市场份额从1997年的48%下降到2000年的42%。
此外,最近的供应链问题及美元升值的负面影响对收产生的负面影响。
会上,管理层公布了致力于既首先要关注增长,同时也注重经营成效的计划。
为了提高收入,公司将在中等价位产品类别内(这一类别的运动鞋每双售价为70-90美元)开发更多的运动鞋产品,而耐克公司近年来忽视了这一类别。
耐克公司也计划推动它的服装产品部门,这一部门在服装行业老将MINDY CROSSMAN (MINDY CROSSMAN在2000年9月加入耐克公司,她是JONES 服装集团的POLO牛崽裤部门的前任董事长及首席执行官)的领导下表现极佳。
在成本方面,耐克公司将在费用控制上作出更大努力。
Nike, Cost of Capital 资本成本分析案例 PPT
该内在价值高于股票现价42.09美元,因此,股票价格被低估。可以进行投资。
案例问题
3
• Joanna计算的WACC有哪些错误? • 正确的计算方法是什么? • 计算正确的WACC • 计算每股的内在价值
什么是WACC
4
加权平均资本成本:英文Weighted Average Cost of Capital的缩写。WACC代表公司整体平均资金 成本,
Joanna的错误有哪些?
正确的WACC算法
7
其中,T取38%,则可计算得: RWACC=90%*7.661%+10%*7.167%*(1-38%)=7.333%
每股内在价值
8
每股的内在价值需要先计算出公司的内在价值,扣除负债得到股东权益价值, 再通过股东权益价值除去流通股数量。 本案例报告使用现金流量法来估算NIKE公司的内在价值。
1 Nike,inc:cost of cApital
案例背景
2
NorthPoint集团是美国一家基金公司,主要投资 于财富杂志评出的世界500强企业。Kimi Rord是 NorthPoint集团的一名证券投资部经理, 正在考 虑是否投资Nike公司的股份。Joanna Cohen, 作 为Kimi的助理,向Kimi提交了她的资本成本评估 报告。
Nike 1964年由Philip H. Knight在奥勒冈州 (Beaverton,Oregon.)创立,是一家美国体育用 品生产商,主要生产运动鞋、运动服装、体育 用品,以自己的品牌销售,分销商遍布全球。 Nike成立以来发展迅速,已成为全球体育用品的 代表性品牌。但1997年-2001年以来,公司经营 业绩较差,因此部分投资者持观望态度。
Nike Inc., Cost of Capital案例原文
Graduate School of Business Administration University Version 2.0 of VirginiaUVA-F-1353 Version 2.0Nike, Inc.: Cost of Capital On July 5, 2001, Kimi Ford, a portfolio manager at NorthPoint Group, a mutual fund management firm, pored over analyst write-ups of Nike, Inc., the athletic shoe manufacturer. Nike’s share price had declined significantly from the start of the year. Kimi was considering buying some shares for the fund she managed, the NorthPoint Large-Cap Fund, which invested mostly in Fortune 500 companies with an emphasis on value investing. Its top holdings included ExxonMobil, General Motors, McDonald’s, 3M and other large-cap, generally old-economy stocks. While the stock market declined over the last 18 months, NorthPoint Large-Cap had performed extremely well. In 2000, the fund earned a return of 20.7 percent even as the S&P 500 fell 10.1 percent. The fund’s year-to-date returns at the end of June, 2001 stood at 6.4 percent versus the S&P 500’s minus 7.3 percent. Only a week ago, on June 28, 2001, Nike held an analysts’ meeting to disclose its fiscal year 2001 results1. However, the meeting had another purpose: Nike management wanted to communicate a strategy for revitalizing the company. Since 1997, Nike’s revenues had plateaued at around $9 billion, while net income had fallen from almost $800 million to $580 million (see Exhibit 1). Nike’s market share in U.S. athletic shoes had fallen from 48 percent in 1997 to 42 percent in 2000.2 In addition, recent supply-chain issues and the adverse effect of a strong dollar had negatively affected revenue. At the meeting, management revealed plans to address both top-line growth and operating performance. To boost revenue, the company would develop more athletic shoe products in the mid-priced segment3 – a segment that it had overlooked in recent years. Nike also planned to push its apparel line, which, under the recent leadership of industry veteran Mindy Grossman4 had performed extremely well. On the cost side, Nike would exert more effort on expense control. Finally, company executives reiterated their long-term revenue growth targets of 8-10 percent, and earnings growth targets of above 15 percent.Nike’s fiscal year ended in May. Robson, Douglas, “Just Do…Something: Nike’s insularity and foot-dragging have it running in place”, Business Week, July 2, 2001 3 Sneakers in this segment sold for $70-$90 a pair. 4 Mindy Grossman joined Nike in September 2000. She was the former president and chief executive of Jones Apparel Group's Polo Jeans division.2 1This case was prepared from publicly available information by Jessica Chan under the supervision of Professor Robert F. Bruner. The financial support of the Batten Institute is gratefully acknowledged. This case was written as a basis for class discussion rather than to illustrate effective or ineffective handling of an administrative situation. Copyright 2001 by the University of Virginia Darden School Foundation, Charlottesville, VA. All rights reserved. To order copies, send an e-mail to dardencases@. No part of this publication may be reproduced, stored in a retrieval system, used in a spreadsheet, or transmitted in any form or by any means— electronic, mechanical, photocopying, recording, or otherwise—without the permission of the Darden School Foundation. Rev. 10/02.-2-UVA-F-1353Analyst reactions were mixed. Some thought the financial targets to be too aggressive; others saw significant growth opportunities in apparel and in Nike’s international businesses. Kimi Ford read all the analyst reports that she could find about the June 28 meeting, but the reports gave her no clear guidance: a Lehman Brothers report recommended a ‘Strong Buy’ while UBS Warburg and CSFB analysts expressed misgivings about the company and recommended a ‘Hold’. Kimi decided instead to develop her own discounted-cash-flow forecast to come to a clearer conclusion. Her forecast showed that at a discount rate of 12 percent, Nike was overvalued at its current share price of $42.09 (see Exhibit 2). However, she had done a quick sensitivity analysis that revealed Nike was undervalued at discount rates below 11.2 percent. Since she was about to go into a meeting, she requested her new assistant, Joanna Cohen, to estimate Nike’s cost of capital. Joanna immediately gathered all the data she thought she might need (Exhibits 1 through 4) and set out to work on her analysis. At the end of the day, she submitted her cost of capital estimate and a memo (Exhibit 5) explaining her assumptions to Ms. Ford.-3-UVA-F-1353Exhibit 1 Nike, Inc.: Cost of Capital Consolidated Income StatementsYear Ended May 31 (In millions except per share data) Revenues Cost of goods sold Gross profit Selling and administrative Operating income Interest expense Other expense, net Restructuring charge, net Income before income taxes Income taxes Net income Diluted earnings per common share Average shares outstanding (diluted) Growth (%) Revenue Operating income Net income Margins (%) Gross margin Operating margin Net margin Effective tax rate (%)* 1995 1996 1997 1998 1999 2000 20014,760.8 2,865.3 1,895.6 1,209.8 685.8 24.2 11.7 649.9 250.2 399.7 1.36 294.06,470.6 3,906.7 2,563.9 1,588.6 975.3 39.5 36.7 899.1 345.9 553.2 1.88 293.69,186.5 5,503.0 3,683.5 2,303.7 1,379.8 52.3 32.3 1,295.2 499.4 795.8 2.68 297.09,553.1 6,065.5 3,487.6 2,623.8 863.8 60.0 20.9 129.9 653.0 253.4 399.6 1.35 296.08,776.9 5,493.5 3,283.4 2,426.6 856.8 44.1 21.5 45.1 746.1 294.7 451.4 1.57 287.58,995.1 5,403.8 3,591.3 2,606.4 984.9 45.0 23.2 (2.5) 919.2 340.1 579.1 2.07 279.89,488.8 5,784.9 3,703.9 2,689.7 1,014.2 58.7 34.1 921.4 331.7 589.7 2.16 273.335.9 42.2 38.442.0 41.5 43.94.0 (37.4) (49.8)(8.1) (0.8) 13.02.5 15.0 28.35.5 3.0 1.839.6 15.1 8.5 38.540.1 15.0 8.7 38.636.5 9.0 4.2 38.837.4 9.8 5.1 39.539.9 10.9 6.4 37.039.0 10.7 6.2 36.0*The U.S. statutory tax rate was 35%. The state tax varied yearly from 2.5% to 3.5%. Source: Company's 10-K SEC filing, UBS Warburg-4Exhibit 2 Nike, Inc.: Cost of Capital Discounted Cash Flow Analysis2002 Assumptions: Revenue growth (%) COGS/Sales (%) S&A/Sales (%) Tax rate (%) Current assets/Sales (%) Current liabilities/Sales (%) Yearly depreciation and capex equal each other. Cost of capital (%) Terminal value growth rate (%) Discounted Cash Flow Operating income Taxes NOPAT Capex, net of depreciation Change in NWC Free cash flow Terminal value Total flows Present value of flows Enterprise value Less: current outstanding debt Equity value Current shares outstanding Equity value per share at 12% Sensitivity of equity value to discount rate: Discount rate 8.00% 8.50% 9.00% 9.50% 10.00% 10.50% 11.00% 11.17% 11.50% 12.00% 2003 2004 2005 2006 2007 2008 2009UVA-F-1353201020117.0 60.0 28.0 38.0 38.0 11.5 12.0 3.06.5 60.0 27.5 38.0 38.0 11.56.5 59.5 27.0 38.0 38.0 11.56.5 59.5 26.5 38.0 38.0 11.56.0 59.0 26.0 38.0 38.0 11.56.0 59.0 25.5 38.0 38.0 11.56.0 58.5 25.0 38.0 38.0 11.56.0 58.5 25.0 38.0 38.0 11.56.0 58.0 25.0 38.0 38.0 11.56.0 58.0 25.0 38.0 38.0 11.51,218.4 463.0 755.4 8.8 764.1 764.1 682.3 11,415.7 1,296.6 10,119.1 271.5 $ 37.271,351.6 513.6 838.0 (174.9) 663.1 663.1 528.61,554.6 590.8 963.9 (186.3) 777.6 777.6 553.51,717.0 652.5 1,064.5 (198.4) 866.2 866.2 550.51,950.0 741.0 1,209.0 (195.0) 1,014.0 1,014.0 575.42,135.9 811.7 1,324.3 (206.7) 1,117.6 1,117.6 566.22,410.2 915.9 1,494.3 (219.1) 1,275.2 1,275.2 576.82,554.8 970.8 1,584.0 (232.3) 1,351.7 1,351.7 545.92,790.1 1,060.2 1,729.9 (246.2) 1,483.7 1,483.7 535.02,957.5 1,123.9 1,833.7 (261.0) 1,572.7 17,998.7 19,571.5 6,301.5Current share price:$42.09Note: Terminal value is estimated using the constant growth model: Equity value $ 75.80 67.85 61.25 55.68 50.92 46.81 43.22 42.09 40.07 37.27 TV = FCF10 * (1 + Terminal value growth rate) WACC - g TV = $1,572.7 * (1.03) 12% - 3%-5Exhibit 3 Nike, Inc.: Cost of Capital Consolidated Balance SheetsMay 31, As of (In millions) Assets Current Assets: Cash and equivalents Accounts receivable Inventories Deferred income taxes Prepaid expenses Total current assets Property, plant and equipment, net Identifiable intangible assets and goodwill, net Deferred income taxes and other assets Total assets Liabilities and shareholders' equity Current Liabilities: Current portion of long-term debt Notes payable Accounts payable Accrued liabilities Income taxes payable Total current liabilities Long-term debt Deferred income taxes and other liabilities Redeemable preferred stock Shareholders' equity: Common stock, par Capital in excess of stated value Unearned stock compensation Accumulated other comprehensive income Retained earnings Total shareholders' equity Total liabilities and shareholders' equity 2000 2001UVA-F-1353$254.3 1,569.4 1,446.0 111.5 215.2 3,596.4$304.0 1,621.4 1,424.1 113.3 162.5 3,625.31,583.4 410.9 266.2 $ 5,856.91,618.8 397.3 178.2 $ 5,819.6$50.1 924.2 543.8 621.9 2,140.0 470.3 110.3 0.3$5.4 855.3 432.0 472.1 21.9 1,786.7 435.9 102.2 0.32.8 369.0 (11.7) (111.1) 2,887.0 3,136.0 $ 5,856.92.8 459.4 (9.9) (152.1) 3,194.3 3,494.5 $ 5,819.6Source: Company 10-K SEC filing.-6-UVA-F-1353Exhibit 4 Nike, Inc.: Cost of Capital Capital Market and Financial Information On or Around July 5, 2001Current yields on U.S. Treasuries 3-month 6-month 1-year 5-year 10-year 20-year 3.59% 3.59% 3.59% 4.88% 5.39% 5.74%Nike Share Price Performance Relative to S&P500: January 2000 to July 5, 20011.3 1.2 1.1 1.0 0.9 0.8 0.7 0.6 0.5 0.4 Feb-00 Aug-00 May-00 Sep-00 Feb-01 May-01 Nov-00 Jan-00 Jun-00 Jan-01 Jun-01 Jul-00 Mar-00 Apr-00 Mar-01 Dec-00 Oct-00 Apr-01 Jul-01Historical Equity Risk Premiums (1926-1999) Geometric mean 5.90% Arithmetic mean 7.50% Current Yield on Publicly Traded Nike Debt* Coupon 6.75% paid semi-annually Issued 07/15/96 Maturity 07/15/21 Current Price $ 95.60 Nike Historic Betas 1996 1997 1998 1999 2000 YTD 06/30/00 AverageNikeS&P 5000.98 0.84 0.84 0.63 0.83 0.69 0.80Nike share price on July 5, 2001: Dividend History and Forecasts Paymt Dates 31-Mar 30-Jun 1997 0.10 0.10 1998 0.12 0.12 1999 0.12 0.12 2000 0.12 0.12 2001 0.12 0.12$42.0930-Sep 0.10 0.12 0.12 0.1231-Dec 0.10 0.12 0.12 0.12Total 0.40 0.48 0.48 0.48Consensus EPS estimates: FY 2002 FY 2003 $ 2.32 $ 2.67Value Line Forecast of Dividend Growth from '98-00 to '04-'06: 5.50%* Data have been modified for teaching purposes. Sources of data: Bloomberg Financial Services, Ibbotson Associates Yearbook 1999, Value Line Investment Survey, IBES-7Exhibit 5 Nike, Inc.: Cost of Capital Joanna’s Analysis TO: FROM: DATE: SUBJECT: Kimi Ford Joanna Cohen July 6, 2001 Nike’s Cost of CapitalUVA-F-1353Based on the following assumptions, my estimate of Nike’s cost of capital is 8.4 percent: I. Single or Multiple Costs of Capital? The first question I considered was whether to use single or multiple costs of capital given that Nike has multiple business segments. Aside from footwear, which makes up 62 percent of revenue, Nike also sells apparel (30 percent of revenue) that complement its footwear products. In addition, Nike sells sport balls, timepieces, eyewear, skates, bats, and other equipment designed for sports activities. Equipment products account for 3.6 percent of revenue. Finally, Nike also sells some non-Nike branded products such as Cole-Haan dress and casual footwear, and ice skates, skate blades, hockey sticks, hockey jerseys and other products under the Bauer trademark. Non-Nike brands account for 4.5 percent of revenue. I asked myself whether Nike’s business segments had different enough risks from each other to warrant different costs of capital. Were their profiles really different? I concluded that it was only the Cole-Haan line that was somewhat different; the rest were all sports-related businesses. However, since Cole-Haan makes up only a tiny fraction of revenues, I did not think it necessary to compute a separate cost of capital. As for the apparel and footwear lines, they are sold through the same marketing and distribution channels and are often marketed in "collections" of similar design. I believe they face the same risk factors, as such, I decided to compute only one cost of capital for the whole company. II. Methodology for Calculating the Cost of Capital: WACC Since Nike is funded with both debt and equity, I used the Weighted Average Cost of Capital (WACC) method. Based on the latest available balance sheet, debt as a proportion of total capital makes up 27.0 percent and equity accounts for 73.0 percent:-8Capital sources Book Values Debt Current portion of long-term debt $ 5.4 Notes payable 855.3 Long-term debt 435.9 $ 1,296.6 Equity III. Cost of Debt $3,494.5UVA-F-135327.0% of total capital 73.0% of total capitalMy estimate of Nike’s cost of debt is 4.3 percent. I arrived at this estimate by taking total interest expense for the year 2001 and dividing it by the company’s average debt balance.5 The rate is lower than Treasury yields but that is because Nike raised a portion of its funding needs through Japanese yen notes, which carry rates between 2.0 percent to 4.3 percent. After adjusting for tax, the cost of debt comes out to 2.7 percent. I used a tax rate of 38 percent, which I obtained by adding state taxes of 3 percent to the U.S. statutory tax rate. Historically, Nike’s state taxes have ranged from 2.5 percent to 3.5 percent. IV. Cost of Equity I estimated the cost of equity using the Capital Asset Pricing Model (CAPM). Other methods such as the Dividend Discount Model (DDM) and the Earnings Capitalization Ratio can be used to estimate the cost of equity. However, in my opinion, CAPM is the superior method. My estimate of Nike’s cost of equity is 10.5 percent. I used the current yield on 20-year Treasury bonds as my risk-free rate, and the compound average premium of the market over Treasury bonds (5.9 percent) as my risk premium. For beta I took the average of Nike’s beta from 1996 to the present. V. Putting it All Together Inputting all my assumptions into the WACC formula, my estimate of Nike’s cost of capital is 8.4 percent. WACC = Kd (1-t) * D/(D+E) + Ke * E/(D+E) = 2.7% * 27.0% + 10.5% * 73.0% = 8.4%5Debt balances as of May 31, 2000 and 2001 were $1,444.6 and $1,296.6 respectively.。
Nike企业管理分析
历经峥嵘的”JIST DO IT””JIST DO IT",是美国著名的运动鞋生产商Nike的企业口号,也是其文化个性鲜明的体现——“体育、表演、洒脱自由的运动员的精神”,这一反传统观念的企业形象的树立与发扬,甚至输出国际,都要从其创办人菲利浦·奈特的汽车行李箱里诞生Nike的传奇性故事开始。
第一集Nike的崛起如果要问是谁造就了Nike的今天,很多人会指向Nike公司创建者和CEO菲利浦·奈特,但最根本的我认为是阿迪达斯的嚣张。
由于阿迪达斯的高价位使很多热爱运动的穷人望而却步,具有商业头脑的奈特抓住了最广大的群体,又随着“慢跑热"的兴起,在商业巨头的眼皮底下跑步进入了运动服饰的市场,开始了传奇的谱写。
一个故事的开始肯定会有一个主旨贯穿全文,而奈特的目标很简单——干掉阿迪达斯。
但是想把拥有市场三分之一的阿迪达斯并非易事,不光要有勇气,还有上帝的青睐。
为了能在运动产品市场站住脚,奈特并没有过度激进的与当时的三巨头正面对决(当然他也没有那个实力),他抓住了当时的社会趋势——运动的普及。
随着运动的大众化,专业领域的产品便显得有些过时,市场要求更富有美感和多元化的产品,所以奈特便从最普通的跑鞋下手,打造出符合大众的跑鞋。
因此确立了Nike的首要一个战略目标—-占据美国市场。
树立了目标之后,接下来便要围绕这个目标进行战略分析,了解内外部环境是第一步。
1。
外部环境当时的美国的市场大部分由Adidas,Puma,Tiger三家瓜分,怎样做才能占有一席之地呢?先由最为经典的SWOT分析法对Nike的市场开拓进行分析:2。
内部环境Nike创建初期,各种制度不完善,资金不足,很容易导致资本的流失,仅仅凭借自己的专利技术想在市场站稳脚是不可能的,必须寻找一个切实的突破口,才能打进市场。
但是这正是Nike早起能迅速崛起的一个动因,由于制度的不健全,菲尔·奈特和鲍尔曼才能控制Nike的全部运营,在企业行为反应较快的情况下能将设想迅速变成现实,这是Nike初期内部环境的一大优势。
Nike
计算税后债务资本成本资Fra bibliotek三本案例中无数据表明应付票据带息,即不会对债务资本成本产生影响, 所以债务资本仅含一个营业周期内到期的长期负债和长期负债。 而Joanna Cohen将应付票据计入债务,不合理。
重新计算:2000年末债务=50.1+470.3=520.4 2001年末债务=5.4+435.9=441.3 2001年平均债务=(520.4+441.3)/2=480.85
计算税后债务资本成本
资料一
计算权益资本成本
资料四
计算综合资本成本
资料三
公司带息债务的市场价值D为5.4+435.9=441.3 公司权益的市场价值Joanna Cohen采用的是合并资
产负债表中的3494.5,不能反映未来的情况。
计算综合资本成本
资 料 二
耐克案例分析
耐克公司:资本成本案例分析一案例背景1997年以来,耐克公司的总收入上升并稳定于90亿美元左右,而净收入从8亿美元左右下跌到5.8亿美元左右(见表一)。
耐克在美国运动鞋市场的市场份额从1997年的48%下降到2000年的42%。
2001年6月28日,耐克公司发布2001财政年度业绩(耐克的财务年度结束于每年5月份)。
借此次会议,公司管理层希望沟通重振公司的战略。
会上,管理层公布了致力于既首先要关注增长,同时也注重经营成效的计划。
为了提高收入,公司将在中等价位产品类别内(这一类别的运动鞋每双售价为70-90美元)开发更多的运动鞋产品,同时计划推动它的服装产品部门。
在成本方面,耐克公司将在费用控制上作出更大努力。
最后,公司总裁重申了他们的收入增长8-10%,利润增长15%以上的长远目标。
KIMI FORD,NORTHPOINT 集团(实际是一家基金管理公司)的portforlio 经理,正在考虑为她管理的NORTHPOINT 大资本基金公司购买一些耐克公司的股份。
而不同的分析人员所提供的报告,给了她完全相反的建议。
一份LEHMAN BROTHERS的分析报告建议“强力买入”,而UBS WARBURG及CSFB的分析人员则表达了对耐克公司的忧虑并建议“观望”。
于是,FORD请她的新助理,JOANNA,COHEN,帮助估计耐克公司的资本成本。
COHEN立即收集了她认为可能需要的所有资料(表1.2.3.4)并开始分析工作,并得出了耐克公司的资本成本为8.3%的结论。
二案例分析我们组经过数次认真的讨论,对JOANNA 用以估计耐克公司资本成本的每一步骤进行了论证,一致不同意她关于耐克资本成本的计算方法及结果。
下面简要分述我组的分析结果。
1资本成本是单重或多重:在这个问题上我们同意JOANNA的分析结果。
耐克公司虽然有多个业务划分,占销售收入62%的鞋类,30%的服装类以及3.6%的运动设备,由此可见95.6%的产品都是与运动相关的业务,他们都是通过同样的市场和分销渠道来销售,而至于Cole-Haan服装及休闲服以及BAUER商标下的其它产品等非耐克商标仅占销售收入的4.5%,不足以因此影响整个公司的资本成本,所以我组也认为耐克公司应该以一个资本成本进行计算2计算资本成本方法:WACC和大部分的公司一样,耐克公司的资本主要来源于:债务资本和权益资本。
成本领先案例范文
成本领先案例范文成本领先是企业在同行业中以较低的成本生产产品或提供服务的能力。
它是企业获得竞争优势的一种重要方式,可以通过降低成本来提高利润率或以更低的价格销售产品,从而吸引更多的顾客。
以下是一些成功的成本领先案例:1. 沃尔玛(Wal-Mart):沃尔玛是全球最大的零售商之一,其成本领先地位是其成功的关键之一、沃尔玛通过建立高度有效的供应链管理系统,在采购、库存管理和物流等方面实现了规模经济,从而降低了成本。
此外,沃尔玛还通过大规模采购来获得更好的价格,并通过精确的定价策略来确保其产品的竞争力。
2. 耐克(Nike):作为世界领先的运动鞋和运动服饰制造商之一,耐克通过与供应商建立长期合作伙伴关系,实现了成本领先。
耐克通过全球范围内的供应链网络,将制造成本最小化,并通过技术创新和研发投资来提高生产效率。
此外,耐克还通过合理的定价、品牌营销和渠道管理来确保其产品的市场占有率和利润率。
3. 亚马逊(Amazon):作为全球最大的电子商务公司之一,亚马逊通过高效的物流和配送系统实现了成本领先。
亚马逊通过在全球建立大型仓库和物流中心,实现了规模经济,并通过自动化技术和先进的物流管理系统,提高了物流和配送效率。
此外,亚马逊还通过高度优化的网站和智能算法来提供个性化的购物体验,从而吸引更多的顾客。
4. 海尔(Haier):作为中国最大的家电制造商之一,海尔通过减少成本和提高效率来实现了成本领先。
海尔通过优化供应链和生产流程,实现了规模经济,并通过智能制造和自动化技术来提高生产效率。
此外,海尔还通过全球化战略和多品牌战略来扩大市场份额,并通过创新的销售模式和服务模式来提高利润率。
5. 麦当劳(McDonald's):作为全球最大的连锁快餐公司之一,麦当劳通过高效的供应链和标准化的菜单来实现了成本领先。
麦当劳通过与供应商建立长期合作伙伴关系,以大量采购来获得更好的价格,并通过自动化设备和流程来提高餐厅的生产效率。
- 1、下载文档前请自行甄别文档内容的完整性,平台不提供额外的编辑、内容补充、找答案等附加服务。
- 2、"仅部分预览"的文档,不可在线预览部分如存在完整性等问题,可反馈申请退款(可完整预览的文档不适用该条件!)。
- 3、如文档侵犯您的权益,请联系客服反馈,我们会尽快为您处理(人工客服工作时间:9:00-18:30)。
1. What is the WACC and why is it important to estimate a firm’s cost of capital Do you agree with Joanna Cohen’s WACC calculation Why or why notThe definition of WACCWeighted average cost of capital(WACC), is a weighted-computational method of analyzing the cost of capital based on the whole capital structure of a firm. The result of WACC is the rate a firm use to monitor the application of the current assets because it represents the return the firm MUST get. For example this rate could be used as the discount rate of evaluating an investment, and maintaining the price of firm’s stock.Analysis of Johanna Cohen’s calculationWe analyzed the process of Johanna Cohen’s calculation, and found some flaws we believe caused computational mistakes.i. When using the WACC method, the book value of bond is availableas the market value since bonds are not quite active in the market, but the book value of equity isn’t. Instead of Johanna’s using equity’s book value, we should mult iply th e current price of Nike’s stock price by the numbers of shares outstanding.ii. When calculating the YTM of the firm’s bond, Johanna only used the interest expense of the year divided by the average debt balance, which fully ignored the discounted cash flow of the cost of debt.2. If you do not agree with Cohen’s analysis, calculate your own WACC for Nike and be prepared to justify your assumptions.Combining the analysis above, we now give our own WACC calculation as following:The value of debt(based on EXIHIBIT 3).Since the book value of debt may represent the market value, we merely need to sum up the values of Long-term debt, Notes payable, and the Current portion of long-term debt:++=$1, mThe cost of debt (based on EXIHIBIT 4):PV:FV: 100n: 40Pmt: 2= (as it pays semiannually)So, we get the YTM is i*2=*2=%The value of equity (based on EXIHIBIT 1&4):Price of stock * numbers of shares outstanding= *=$11, The cost of equity (based on EXIHIBIT 4):E(Ri ) = Rf+【E(Rm) - Rf】* βiBecause the government bond yield is %, Geometrical historical risk premium is %, and the average historical βof Nike is , then we get:E(Ri)= %+%* =%Weights of each security (based on &Weight of debt=1,(1,+11,=%Weight of equity=(1,+11,=%Cost of capital by WACC method (based above):Cost of capital = Weight of debt * Cost of debt * (1 –Tax rate) + Weight of equity * Cost of equity = % * %* + % * % = %3. Calculate the costs of equity using CAPM, the dividend discount model, and the earnings capitalization ratio. What are the advantages and disadvantages of each method Calculating the costs of equity by CAPM, and its advantages & disadvantagesi. Calculation:According to , we have already got the result of CAPM, which is %.ii. AdvantagesFirst, because CAPM is a theory based on the whole market, it obviously includes the effects between the market as the integrity and each individual stock. Second, with the counterbalance among each stock in the entire market, CAPM only needs the consideration of systematic risk, which much simplifies the calculation. Third, CAPM also bypasses the specific values of future cash flow because the equation is actually the relation between systematic risk and return rate, which is also another simplification of calculating.Fourth, merely depending on the systematic risk, CAPM could offer the investors a reliable discounting rate to assess the value of a certain investment.iii. Disadvantages:First, involving the counterbalance among the entire market, CAPM acquiesces an effective, active and healthy market environment. Second, comparing the consideration of market risk, CAPM may omit the subtle risk differences among each single firm.Third, the crucial systematic risk, the beta coefficient, is obviously hard to calculate.Calculating the costs of equity by DDM, and its advantages & disadvantagesi. Calculation (based on EXIHIBIT 4)::Based on the dividend discount model, P0 = D* (1+g) /(k – g), then we get the return rate (the cost of equity) k = D0 * (1+g) / P+ g = * (1 + / + = %ii. AdvantagesFirst, DDM fully considers the time value of consistent cash flow of an investment. Second, it is pretty easy to get the necessary historical data. Third DDM is flexible enough for the adjustment of any future situation. Fourth, once the growth pattern is confirmed, it is very straightforward to get the discount rate of assessing an investment.iii. DisadvantagesFirst, without enough consideration of risk cost, DDM may underestimate the equity cost. Second, all of the data is based on historical record, so the result is not reliable considering of the future situations. Third, with the predetermined growth rate, it is obviously practical for the stock investors to estimate the possible profit, but may mislead the stock issuing firm froma better budgeting decision to a comparatively unsubstantialinvestment.Calculating the costs of equity by the earnings capitalization ratio, and its advantages & disadvantagesi. Calculation (based on EXIHIBIT 1&4)According to the earnings capitalization model, we have costof equity = E1 / P= / = %ii. AdvantagesFirst, it’s very e asy to calculate and understand. Second, it’s easy to get the necessary accounting dataiii. DisadvantagesWithout any consideration of the risk and the growth of the firm, it doesn’t reflect the true value of an investment or the cost of the budgeting at all.4. What should Kimi Ford recommend regarding an investment in NikeAccording to EXIHIBIT 2, the market’s forecasting sensitivity of equity value of Nike is %. But based on our own analysis by WACC, we believe the discount rate of Nike is around %. That means the market underestimated the value of Nike. So we recommend the Northpoint to purchase the stock of Nike.。