计量经济学(英文)重点知识点考试必备
计量经济学重点知识整理

计量经济学重点知识整理计量经济学是经济学中重要的一个分支,主要研究经济现象和经济理论的数理化方法。
本文将整理计量经济学中的重点知识,帮助读者系统地理解和掌握这门学科。
一、计量经济学简介计量经济学是运用统计方法和经济模型对经济问题进行定量分析的学科。
它利用数理统计学的工具,根据经济理论和实证研究的需要,对经济现象进行测度和解释。
计量经济学方法的特点是同时考虑了外生性和内生性变量之间的关系,能够揭示其中的因果关系。
二、计量经济学的基本原理1. 线性回归模型线性回归模型是计量经济学中最基本的模型之一,用于描述因变量与自变量之间的线性关系。
常见的线性回归模型有简单线性回归模型和多元线性回归模型。
对于简单线性回归模型,可以通过最小二乘法估计模型参数,求得最佳拟合曲线。
而多元线性回归模型则通过矩阵运算推导出参数的估计公式。
2. 假设检验在计量经济学中,假设检验是一种重要的统计方法,用于验证经济理论的假设。
常见的假设检验包括 t 检验、F 检验和卡方检验等。
通过构建原假设和备择假设,并计算相应的统计量,可以对经济理论提出的假设进行检验,从而得出结论。
3. 时间序列分析时间序列分析是计量经济学中的一个重要分支,用于研究随时间变化的经济现象。
常见的时间序列分析方法包括自相关函数(ACF)和偏自相关函数(PACF)的计算,以及平稳性检验、白噪声检验、单位根检验等。
这些方法可以帮助我们了解时间序列数据的性质,并进行有效的预测。
4. 面板数据分析面板数据是计量经济学中常用的一种数据类型,指同一时期内多个个体或单位的多个观测数据。
面板数据分析方法可以更好地解决普通截面数据和时间序列数据的缺陷,提高分析的效果。
常见的面板数据模型包括固定效应模型和随机效应模型,通过估计模型参数,可以得到各个因素对经济变量的影响。
三、计量经济学的应用领域1. 消费者行为分析计量经济学方法可以应用于消费者行为的分析,通过对消费者支出和收入等因素的测度和分析,揭示消费者行为背后的规律。
计量经济学英语专业词汇

• • • •
•
• • • •
模型设定正确假设。The regression model is correctly specified. 线性回归假设。The regression model is linear in the parameters。 与随机项不相关假设。The covariances between Xi and μi are zero. 观测值变化假设。X values in a given sample must not all be the same. 无完全共线性假设。There is no perfect multicollinearity among the explanatory variables. 0均值假设。The conditional mean value of μi is zero. 同方差假设。The conditional variances of μi are identical.(Homoscedasticity) 序列不相关假设。The correlation between any two μi and μj is zero. 正态性假设。The μ’s follow the normal distribution.
• 方程的显著性检验(F检验) Testing the Overall Significance of a Multiple Regression (the F test) • 假设检验(Hypothesis Testing)变量的显著性检验(t检 验) Testing the Significance of Variables (the t test) • 参数的置信区间 Confidence Interval of Parameter • 置信系数(置信度)(confidence coefficient) • 置信限(confidence limit) • 恩格尔曲线(Engle curves) • 菲利普斯曲线(Pillips cuves)
《计量经济学英文版》课件

2 ARMA模型
介绍ARMA模型的基本原 理和参数估计方法,以及 ARMA模型在经济数据分 析中的应用。
3 GARCH模型
讲解GARCH模型的原理 和估计方法,以及 GARCH模型在金融市场 波动预测中的应用。
计量经济模型的应用
金融市场分析
应用计量经济模型进行金融市 场的预测和分析。
政策评估
利用计量经济模型评估政策的 效果和影响。
面板数据模型
1
面板数据概述
介绍面板数据的特点和应用领域,以及面板数据模型的基本概念。
2
固定效应模型
讲解固定效应模型的估计和推断方法,以及固定效应模型的优缺点。
3
随机效应模型
介绍随机效应模型的估计和推断方法,以及随机效应模型与固定效应模型的比较。
时间序列模型
1 时间序列数据基本特
征
描述时间序列数据的基本 特征,如趋势、季节性和 周期性。
《计量经济学英文版》 PPT课件
本课程介绍了计量经济学的基本概念和分析方法。涵盖了经济数据与计量分 析、经典线性回归模型、面板数据模型、时间序列模型和计量经济模型的应 用。
课程概述
本节将概述本课程的内容,包括学习目标和涵盖的主要内容。通过本课程的学习,您将掌握计量经济学的基本 理论和实际应用。
经济数据与计量分析
企业ቤተ መጻሕፍቲ ባይዱ策
运用计量经济模型辅助企业的 决策制定。
总结
通过本课程的学习,您将获得计量经济学分析的基本知识和技能,能够应用计量经济模型进行实证研究,并在 实际问题中运用计量经济学的方法和工具。
• 经济数据的概念与特点 • 统计概率基础 • 经济计量分析的目的与意义
经典线性回归模型
普通最小二乘法
计量经济学考试重点整理

计量经济学考试重点整理计量经济学考试重点整理第一章:计量经济学是指用数学方法探讨经济学的一门学科,由统计学、经济理论和数学三者结合而成。
它不同于经济统计学和一般经济理论,也不是数学应用于经济学的同义语。
三者结合起来,才能构成计量经济学的力量。
理论模型的设计包含三个主要部分:选择变量、确定变量之间的数学关系和拟定模型中待估计参数的数值范围。
常用的样本数据有时间序列、截面和虚拟变量数据。
样本数据的质量应具备完整性、准确性、可比性和一致性。
模型的检验包括经济意义检验、统计检验、计量经济学检验和模型预测检验。
其中,计量经济学检验包括异方差性检验、序列相关性检验和共线性检验。
计量经济学模型的成功要素包括理论、方法和数据。
应用方面,计量经济学模型可用于结构分析、经济预测、政策评价和理论检验与发展。
其中,结构分析主要采用弹性分析、乘数分析和比较静力分析等方法。
经济预测是计量经济学模型的一个主要应用领域,它是从用于经济预测,特别是短期预测而发展起来的。
对于非稳定发展的经济过程和缺乏规范行为理论的经济活动,计量经济学模型预测功能可能失效。
政策评价是指从许多不同的政策中选择较好的政策予以实行,或者说不同的政策对经济目标所产生的影响的差异。
计量经济学模型可以起到“经济政策实验室”的作用,将经济目标作为被解释变量,经济政策作为解释变量,评价各种不同政策对目标的影响。
最后,实践是检验真理的唯一标准,计量经济学模型的理论方法需要不断发展以适应预测的需要。
任何经济学理论只有在成功解释过去的情况下才能被人们所接受。
计量经济学模型提供了一种检验经济理论的好方法,通过对理论假设的检验可以发现和发展理论。
相关分析主要研究随机变量间的相关形式及相关程度,适用于所有统计关系。
但相关分析有其局限性,不能说明变量间的具体相关关系形式,也不能从一个变量推测另一个变量的具体变化。
回归分析则是研究一个变量关于另一个或几个变量的具体依赖关系的计算方法和理论,目的是根据已知的解释变量的数值去估计被解释变量的平均值。
计量经济学复习资料

计量经济学复习资料1、费里希(R.Frish)是经济计量学的主要开拓者和奠基人。
2、经济计量学与数理经济学和树立统计学的区别的关键之点是“经济变量关系的随机性特征”。
3、经济计量学识以数理经济学和树立统计学为理论基础和方法论基础的交叉科学。
它以客观经济系统中具有随机性特征的经济关系为研究对象,用数学模型方法描述具体的经济变量关系,为经济计量分析工作提供专门的指导理论和分析方法。
4、时序数据即时间序列数据。
时间序列数据是同一统计指标按时间顺序记录的数据列。
5、横截面数据是在同一时间,不同统计单位的相同统计指标组成的数据列。
6、对于一个独立的经济模型来说,变量可以分为内生变量和外生变量。
内生变量被认为是具有一定概率分布的随机变量,它们的数值是由模型自身决定的;外生变量被认为是非随机变量,它们的数值是在模型之外决定的。
7、对于模型中的一个方程来说,等号左边的变量称为被解释变量,等号右边被称为解释变量。
在模型中一个方程的被解释变量可以是其它方程的解释变量。
被解释变量一定是模型的内生变量,而解释变量既包括外生变量,也包括一部分内生变量。
8、滞后变量与前定变量。
有时模型的设计者还使用内生变量的前期值作解释变量,在计量经济学中将这样的变量程为滞后变量。
滞后变量显然在求解模型之前是已知量,因此通常将外生变量与滞后变量合称为前定变量。
9、控制变量与政策变量。
由于控制论的思想不断渗入经济计量学,使某些经济计量模型具有政策控制的特点,因此在经济计量模型中又出现了控制变量、政策变量等名词。
政策变量或控制变量一般在模型中表现为外生变量,但有时也表现为内生变量。
10、经济参数分为:外生参数和内生参数。
外生参数一般是指依据经济法规人为确定的参数,如折旧率、税率、利息率等。
内生参数是依据样本观测值,运用统计方法估计得到的参数。
如何选择估计参数的方法和改进估计参数的方法,这是理论经济计量学的基本任务。
11、用数学模型描述经济系统应当遵循以下两条基本原则:第一、以理论分析作先导;第二模型规模大小要适度。
计量经济学(英文版).

Xi’An Institute of Post & Telecommunication Dept of Economic & Management Prof. Long
Simple Linear Regression Model y t = b1 + b 2 x t + e t
b1 + b2 x t
Assumptions of the Simple Linear Regression Model yt = b1 + b2x t + e t 2. E(e t) = 0 <=> E(yt) = b1 + b2x t
1.
3. var(e t)
4.3
=
4.
5.
cov(e i,e j)
x t c for every observation
= cov(yi,yj)
s 2 = var(yt)
= 0
6.
e t~N(0,s 2) <=> yt~N(b1+ b2x t,
The population parameters b1 and b2 are unknown population constants.
4.2
yt = household weekly food expenditures
x t = household weekly income
For a given level of x t, the expected level of food expenditures will be: E(yt|x t) =
计量经济学常用英语词汇,都在这里了!
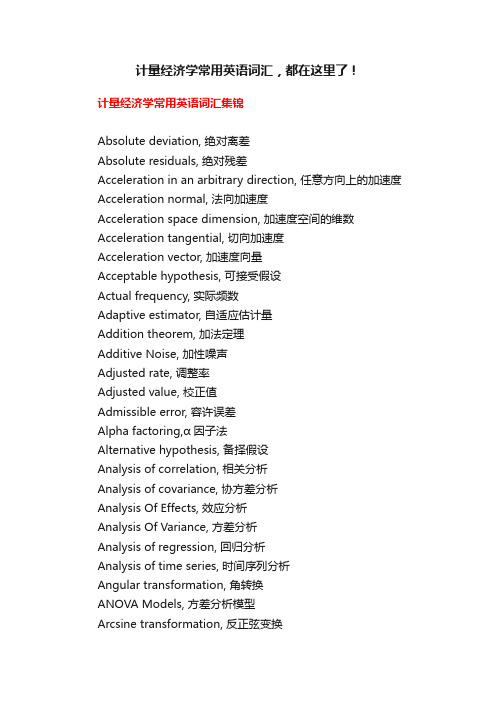
计量经济学常用英语词汇,都在这里了!计量经济学常用英语词汇集锦Absolute deviation, 绝对离差Absolute residuals, 绝对残差Acceleration in an arbitrary direction, 任意方向上的加速度Acceleration normal, 法向加速度Acceleration space dimension, 加速度空间的维数Acceleration tangential, 切向加速度Acceleration vector, 加速度向量Acceptable hypothesis, 可接受假设Actual frequency, 实际频数Adaptive estimator, 自适应估计量Addition theorem, 加法定理Additive Noise, 加性噪声Adjusted rate, 调整率Adjusted value, 校正值Admissible error, 容许误差Alpha factoring,α因子法Alternative hypothesis, 备择假设Analysis of correlation, 相关分析Analysis of covariance, 协方差分析Analysis Of Effects, 效应分析Analysis Of Variance, 方差分析Analysis of regression, 回归分析Analysis of time series, 时间序列分析Angular transformation, 角转换ANOVA Models, 方差分析模型Arcsine transformation, 反正弦变换Area under the curve, 曲线面积AREG , 评估从一个时间点到下一个时间点回归相关时的误差ARIMA, 季节和非季节性单变量模型的极大似然估计Arithmetic grid paper, 算术格纸Arrhenius relation, 艾恩尼斯关系Asymptotic efficiency, 渐近效率Asymptotic variance, 渐近方差Attributable risk, 归因危险度Autocorrelation of residuals, 残差的自相关Bar chart, 条形图Bar graph, 条形图Base period, 基期Bayes' theorem , Bayes定理Bell-shaped curve, 钟形曲线Bernoulli distribution, 伯努力分布Best-trim estimator, 最好切尾估计量Binary logistic regression, 二元逻辑斯蒂回归Binomial distribution, 二项分布Bisquare, 双平方Bivariate Correlate, 二变量相关Bivariate normal distribution, 双变量正态分布Bivariate normal population, 双变量正态总体Biweight interval, 双权区间Biweight M-estimator, 双权M估计量Block, 区组/配伍组BMDP(Biomedical computer programs), BMDP统计软件包Boxplots, 箱线图/箱尾图Breakdown bound, 崩溃界/崩溃点Canonical correlation, 典型相关Case-control study, 病例对照研究Categorical variable, 分类变量Cauchy distribution, 柯西分布Center of symmetry, 对称中心Centering and scaling, 中心化和定标Central tendency, 集中趋势Central value, 中心值CHAID -χ2 Auto matic Interaction Detector, 卡方自动交互检测Chance error, 随机误差Chance variable, 随机变量Characteristic equation, 特征方程Characteristic root, 特征根Characteristic vector, 特征向量Chebshev criterion of fit, 拟合的切比雪夫准则Chernoff faces, 切尔诺夫脸谱图D test, D检验Data acquisition, 资料收集Data bank, 数据库Data capacity, 数据容量Data deficiencies, 数据缺乏Data handling, 数据处理Data manipulation, 数据处理Data processing, 数据处理Data reduction, 数据缩减Data sources, 数据来源Data transformation, 数据变换Data validity, 数据有效性Dead time, 停滞期Degree of freedom, 自由度Degree of precision, 精密度Degree of reliability, 可靠性程度Degression, 递减Density function, 密度函数Error Bar, 均值相关区间图Effect, 实验效应Eigenvalue, 特征值Eigenvector, 特征向量Empirical distribution, 经验分布Empirical probability, 经验概率单位Enumeration data, 计数资料Equal sun-class number, 相等次级组含量Equally likely, 等可能Equivariance, 同变性Error, 误差/错误Error of estimate, 估计误差Error type I, 第一类错误Error type II, 第二类错误Estimand, 被估量Estimated error mean squares, 估计误差均方Estimated error sum of squares, 估计误差平方和Euclidean distance, 欧式距离Exceptional data point, 异常数据点Expectation plane, 期望平面Expectation surface, 期望曲面Expected values, 期望值Experiment, 实验F distribution, F分布F test, F检验Factor, 因素/因子Factor analysis, 因子分析Factor score, 因子得分Factorial design, 析因试验设计False negative, 假阴性False negative error, 假阴性错误Family of distributions, 分布族Family of estimators, 估计量族Fatality rate, 病死率Gamma distribution, 伽玛分布Gauss increment, 高斯增量Gaussian distribution, 高斯分布/正态分布Gauss-Newton increment, 高斯-牛顿增量General census, 全面普查Generalized least squares, 综合最小平方法GENLOG (Generalized liner models), 广义线性模型Geometric mean, 几何平均数Gini's mean difference, 基尼均差GLM (General liner models), 通用线性模型Goodness of fit, 拟和优度/配合度Gradient of determinant, 行列式的梯度Graeco-Latin square, 希腊拉丁方Grand mean, 总均值Gross errors, 重大错误。
计量经济学重点知识点考试必备

1.Econometrics(计量经济学):the social science in which the tools of economic theory, mathematics, and statistical inference are applied to the analysis of economic phenomena.the result of a certain outlook on the role of economics, consists of the application of mathematical statistics to economic data to lend empirical support to the models constructed by mathematical economics and to obtain numerical results.2.Econometric analysis proceeds along the following lines计量经济学分析步骤1)Creating a statement of theory or hypothesis.建立一个理论假说2)Collecting data.收集数据3)Specifying the mathematical model of theory.设定数学模型4)Specifying the statistical, or econometric, model of theory.设立统计或经济计量模型5)Estimating the parameters of the chosen econometric model.估计经济计量模型参数6)Checking for model adequacy : Model specification testing.核查模型的适用性:模型设定检验7)Testing the hypothesis derived from the model.检验自模型的假设8)Using the model for prediction or forecasting.利用模型进行预测Step2:收集数据Three types of data三类可用于分析的数据1)Time series(时间序列数据):Collected over a period of time, are collected at regular intervals.按时间跨度收集得到2)Cross-sectional截面数据:Collected over a period of time, are collected at regular intervals.按时间跨度收集得到3)Pooled data合并数据(上两种的结合)Step3:设定数学模型1.plot scatter diagram or scattergram2.write the mathematical modelStep4:设立统计或经济计量模型CLFPR is dependent variable应变量CUNR is independent or explanatory variable独立或解释变量(自变量)We give a catchall variable U to stand for all these neglected factorsIn linear regression analysis our primary objective is to explain the behavior of the dependent variable in relation to the behavior of one or more other variables, allowing for the data that the relationship between them is inexact.线性回归分析的主要目标就是解释一个变量(应变量)与其他一个或多个变量(自变量)只见的行为关系,当然这种关系并非完全正确Step5:估计经济计量模型参数In short, the estimated regression line gives the relationship between average CLFPR and CUNR 简言之,估计的回归直线给出了平均应变量和自变量之间的关系That is, on average, how the dependent variable responds to a unit change in the independent variable.单位因变量的变化引起的自变量平均变化量的多少。
- 1、下载文档前请自行甄别文档内容的完整性,平台不提供额外的编辑、内容补充、找答案等附加服务。
- 2、"仅部分预览"的文档,不可在线预览部分如存在完整性等问题,可反馈申请退款(可完整预览的文档不适用该条件!)。
- 3、如文档侵犯您的权益,请联系客服反馈,我们会尽快为您处理(人工客服工作时间:9:00-18:30)。
第一章1.Econometrics(计量经济学):the social science in which the tools of economic theory, mathematics, and statistical inference are applied to the analysis of economic phenomena.the result of a certain outlook on the role of economics, consists of the application of mathematical statistics to economic data to lend empirical support to the models constructed by mathematical economics and to obtain numerical results.2.Econometric analysis proceeds along the following lines计量经济学分析步骤1)Creating a statement of theory or hypothesis.建立一个理论假说2)Collecting data.收集数据3)Specifying the mathematical model of theory.设定数学模型4)Specifying the statistical, or econometric, model of theory.设立统计或经济计量模型5)Estimating the parameters of the chosen econometric model.估计经济计量模型参数6)Checking for model adequacy : Model specification testing.核查模型的适用性:模型设定检验7)Testing the hypothesis derived from the model.检验自模型的假设8)Using the model for prediction or forecasting.利用模型进行预测●Step2:收集数据➢T hree types of data三类可用于分析的数据1)Time series(时间序列数据):Collected over a period of time, are collected at regular intervals.按时间跨度收集得到2)Cross-sectional截面数据:Collected over a period of time, are collected at regular intervals.按时间跨度收集得到3)Pooled data合并数据(上两种的结合)●Step3:设定数学模型1.plot scatter diagram or scattergram2.write the mathematical model●Step4:设立统计或经济计量模型➢C LFPR is dependent variable应变量➢C UNR is independent or explanatory variable独立或解释变量(自变量)➢W e give a catchall variable U to stand for all these neglected factors➢I n linear regression analysis our primary objective is to explain the behavior of the dependent variable in relation to the behavior of one or more other variables, allowing for the data that the relationship between them is inexact.线性回归分析的主要目标就是解释一个变量(应变量)与其他一个或多个变量(自变量)只见的行为关系,当然这种关系并非完全正确●Step5:估计经济计量模型参数➢I n short, the estimated regression line gives the relationship between average CLFPR and CUNR 简言之,估计的回归直线给出了平均应变量和自变量之间的关系➢T hat is, on average, how the dependent variable responds to a unit change in theindependent variable.单位因变量的变化引起的自变量平均变化量的多少。
●Step6:核查模型的适用性:模型设定检验The purpose of developing an econometric model is not to capture total reality, but just its salient features.●Step7:检验自模型的假设Why do we perform hypothesis testing?We want to find our whether the estimated model makes economic sense and whether the results obtains conform with the underlying economic theory.第二章1.The meaning of regression(回归)Regression analysis is concerned with the study of the relationship between one variable called the dependent or explained variable, and one or more other variables called independent or explanatory variables.2.Objectives of regression1)Estimate the mean, or average, and the dependent values given the independent values2)Test hypotheses about the nature of the dependence -----hypotheses suggested by the underlying economic theory3)Predict or forecast the mean value of the dependent variable given the values of the independents4)One or more of the preceding objectives combined3.Population Regression Line(PRL)In short, the PRL tells us how the mean, or average, value of Y is related to each value of X in the whole population4.The dependence of Y on X, technically called the regression of Y on X.5.How do we explain it?A student’s score, say, the ith individual, corresponding to a specific family income can be expressed as the sum of two components1)T he component can be called the systematic, or deterministic, component.2)M ay be called the nonsystematic or random component6.What is the nature of U(stochastic error) term?1)The error term may represent the influence of those variables that are not explicitly included in the model.误差项代表了未纳入模型变量的影响2)Some intrinsic randomness in the math score is bound to occur that can not be explained even we include all relevant variables.即使模型包括了决定性数学分数的所有变量,内在随机性也不可避免,这是做任何努力都无法解释的。
3)U may also represent errors of measurement. U还代表了度量误差4)The principle of Ockham’s razor - the description be kept as simple as possible until proved inadequate - would suggest that we keep our regression model as simple as possible.“奥卡姆剃刀原则”,描述应该尽可能简单,只要不遗漏重要信息。
这表明回归模型应尽可能简单。
7.How do we estimate the PRF(population regression function)? Unfortunately, in practice, We rarely have the entire population in our disposal,often we have only a sample from this population.8.Granted that the SRF is only an approximation of PRF. Can we find a method or aprocedure that will make this approximation as close as possible? SRF仅仅是PRF的近似,那么能不能找到一种方法使这种近似尽可能接近真实呢?9.Special meaning of “linear”1)Linearity in the variables变量线性The conditional mean value of the dependent variable is a linear function of the independent variables2)Linearity in the Parameters参数线性The conditional mean of the dependent variable is a linear function of the parameters, the B’s; it may or may not be linear in the variables.第三章1.Unless we are willing to assume how the stochastic U terms are generated, we will not be able to tell how good an SRF is as an estimate of the true PRF.只有假定了随机误差的生成过程,才能判定SRF对PRF拟合的是好是坏。