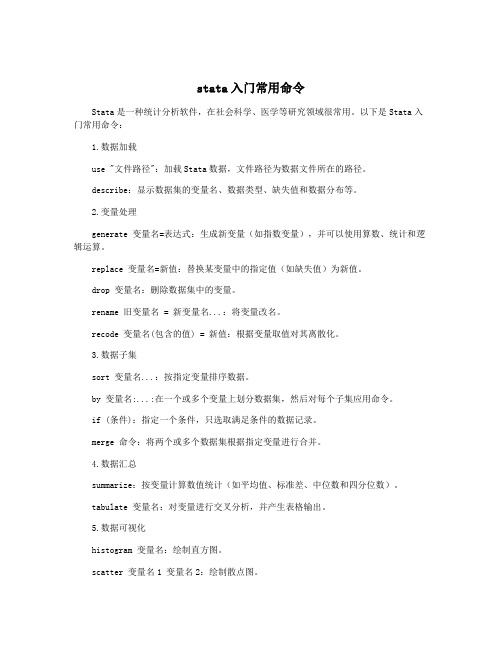
stata 介绍与命令
STATA命令应用及详细解释

STATA命令应用及详细解释1. summarize:该命令用于计算数值变量的描述性统计信息,包括均值、标准差、最小值、最大值等。
2. tabulate:该命令用于生成一个分类变量的频数和百分比表。
它可以计算单个变量的分布情况,也可以计算多个变量之间的交叉分布情况。
3. tabstat:该命令用于生成一个或多个数值变量的汇总统计信息,包括均值、标准差、中位数等。
与summarize命令相比,tabstat命令可以同时计算多个变量的统计量。
4. regress:该命令用于进行线性回归分析。
可以使用regress命令估计一个自变量和一个或多个因变量之间的线性关系,并生成回归系数、拟合优度等回归结果。
5. logistic:该命令用于进行逻辑回归分析。
逻辑回归分析常用于二分类问题,可以估计自变量对因变量的影响,并生成回归系数、odds比等结果。
6. ttest:该命令用于进行两样本独立样本的t检验。
可以比较两个独立样本的均值差异,并计算t值、p值等检验结果。
7. oneway:该命令用于进行单因素方差分析。
可以比较不同组别之间的均值差异,并进行方差齐性检验和多重比较。
8. twoway:该命令用于进行双因素方差分析。
可以同时比较两个因素及其交互作用对均值差异的影响,并进行方差齐性检验和多重比较。
9. nonparametric:该命令用于进行非参数统计分析。
包括Wilcoxon秩和检验、Kruskal-Wallis H检验、Mann-Whitney U检验等非参数假设检验方法。
10. generate:该命令用于创建一个新的变量,并根据已有变量和运算符生成新的值。
生成的变量可以用于后续的计算和分析。
11. replace:该命令用于替换数据集中指定变量的值。
可以根据条件语句来替换指定变量中的值。
12. bysort:该命令用于按照一个或多个变量的值对数据集进行排序,并按照排序后的次序执行其他STATA命令。
STATA命令应用及详细解释

STATA命令应用及详细解释STATA是一种统计软件,被广泛应用于数据分析和统计建模。
在STATA中,有许多命令可以用来汇总数据并提取关键统计信息,以便更好地理解和解释数据。
下面将介绍一些常用的STATA命令,并详细解释其用途和功能。
1. summarize:summarize命令用于对数值变量进行简单的统计汇总。
它会输出变量的观测数、均值、标准差、最小值、最大值等统计量。
2. tabulate:tabulate命令用于对分类变量进行频数统计。
它会输出每个分类变量的取值及其频数,并可以计算相对频数和累计频数。
3. descriptives:descriptives命令可以同时对数值变量和分类变量进行统计汇总。
它会输出每个变量的观测数、缺失值数、均值、标准差、最小值、最大值、频数等统计量。
4. summarizeby:summarizeby命令可以按照一个或多个分类变量对数值变量进行分组统计。
它会输出每个分类组别的观测数、均值、标准差、最小值、最大值等统计量。
5. collapse:collapse命令用于对数据进行折叠操作,将数据按照指定的分类变量进行分组,并计算每组的汇总统计量。
它可以用于生成汇总数据集,以便后续分析。
6. bysort:bysort命令可以按照一个或多个变量对数据进行排序,然后对排序后的数据进行分组统计。
它可以与其他命令结合使用,如collapse、egen等。
7. egen:egen命令可以生成新的衍生变量,该变量可以基于原始数据进行计算。
它支持许多统计函数,如均值、标准差、总和、中位数等,并可以按照一个或多个分类变量进行分组计算。
8. tabstat:tabstat命令可以对数值变量进行多个统计量的计算,并将结果输出为一个表格。
它支持均值、标准差、最小值、最大值、中位数等统计量,并可以按照一个或多个分类变量进行分组计算。
9. corr:corr命令用于计算变量之间的相关系数。
stata入门常用命令
stata入门常用命令Stata是一种统计分析软件,在社会科学、医学等研究领域很常用。
以下是Stata入门常用命令:1.数据加载use "文件路径":加载Stata数据,文件路径为数据文件所在的路径。
describe:显示数据集的变量名、数据类型、缺失值和数据分布等。
2.变量处理generate 变量名=表达式:生成新变量(如指数变量),并可以使用算数、统计和逻辑运算。
replace 变量名=新值:替换某变量中的指定值(如缺失值)为新值。
drop 变量名:删除数据集中的变量。
rename 旧变量名 = 新变量名...:将变量改名。
recode 变量名(包含的值) = 新值:根据变量取值对其离散化。
3.数据子集sort 变量名...:按指定变量排序数据。
by 变量名:...:在一个或多个变量上划分数据集,然后对每个子集应用命令。
if (条件):指定一个条件,只选取满足条件的数据记录。
merge 命令:将两个或多个数据集根据指定变量进行合并。
4.数据汇总summarize:按变量计算数值统计(如平均值、标准差、中位数和四分位数)。
tabulate 变量名:对变量进行交叉分析,并产生表格输出。
5.数据可视化histogram 变量名:绘制直方图。
scatter 变量名1 变量名2:绘制散点图。
graph 命令:绘制多种类型的图表,例如线图和条形图。
6.线性回归regress 因变量自变量1 自变量2...:通过最小二乘法拟合多元线性回归模型。
test 命令:进行t检验、F检验、方差分析等统计检验。
predict 新变量名:计算回归模型的预测值或残差值,并存储在新的变量中。
7.度量方法计算correlate 命令:计算并存储所有变量的相关系数矩阵。
haase 命令:计算哈斯变换矩阵。
Inflate 命令:计算一个变量的方差膨胀因子和条件数。
8.模态分析(模拟)simulate 命令:用随机抽样模拟数据,计算一个或多个变量的特定函数或方程,并存储结果。
stata基础命令

stata基础命令Stata基础命令Stata是一种功能强大的统计分析软件,广泛应用于学术研究和商业分析领域。
本文将介绍Stata的一些基础命令,帮助读者快速掌握Stata的使用方法。
1. 数据导入与查看命令在Stata中,可以使用"import"命令将外部数据导入到Stata的工作环境中。
例如,可以使用"import excel"命令导入Excel表格中的数据,或使用"import delimited"命令导入以逗号分隔的文本文件。
导入数据后,可以使用"browse"命令查看数据集的内容,或使用"describe"命令查看数据集的结构信息。
2. 数据清洗与变量处理命令在进行数据分析之前,通常需要对数据进行清洗和变量处理。
Stata 提供了一系列命令来完成这些任务。
例如,可以使用"drop"命令删除不需要的变量或观察值,使用"rename"命令修改变量名,使用"generate"命令创建新的变量,使用"recode"命令对变量进行重新编码等。
3. 描述性统计与绘图命令Stata提供了各种命令来计算和展示数据的描述性统计信息。
例如,可以使用"summarize"命令计算变量的均值、标准差和分位数等统计量,使用"tabulate"命令生成变量的频数表,使用"histogram"命令绘制变量的直方图,使用"scatter"命令绘制两个变量的散点图等。
4. 统计模型与假设检验命令在Stata中,可以使用各种命令来拟合统计模型和进行假设检验。
例如,可以使用"regress"命令拟合线性回归模型,使用"logit"命令拟合二元Logistic回归模型,使用"anova"命令进行方差分析,使用"ttest"命令进行两样本t检验等。
STATA面板数据模型操作命令讲解
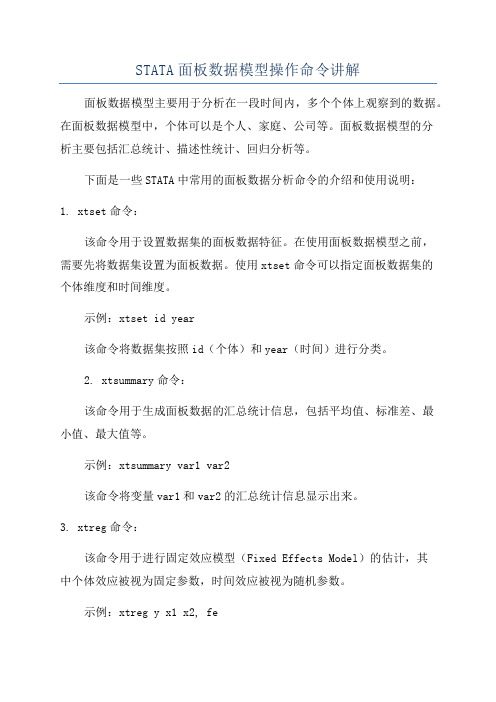
STATA面板数据模型操作命令讲解面板数据模型主要用于分析在一段时间内,多个个体上观察到的数据。
在面板数据模型中,个体可以是个人、家庭、公司等。
面板数据模型的分析主要包括汇总统计、描述性统计、回归分析等。
下面是一些STATA中常用的面板数据分析命令的介绍和使用说明:1. xtset命令:该命令用于设置数据集的面板数据特征。
在使用面板数据模型之前,需要先将数据集设置为面板数据。
使用xtset命令可以指定面板数据集的个体维度和时间维度。
示例:xtset id year该命令将数据集按照id(个体)和year(时间)进行分类。
2. xtsummary命令:该命令用于生成面板数据的汇总统计信息,包括平均值、标准差、最小值、最大值等。
示例:xtsummary var1 var2该命令将变量var1和var2的汇总统计信息显示出来。
3. xtreg命令:该命令用于进行固定效应模型(Fixed Effects Model)的估计,其中个体效应被视为固定参数,时间效应被视为随机参数。
示例:xtreg y x1 x2, fe该命令将变量y对x1和x2进行固定效应模型估计。
4. xtfe命令:该命令用于进行固定效应模型的估计,并提供了更多的选项和功能。
示例:xtfe y x1 x2, vce(robust)该命令将变量y对x1和x2进行固定效应模型估计,并使用鲁棒标准误。
5. xtlogit命令:该命令用于进行面板Logistic回归分析,适用于因变量为二分类变量的情况。
示例:xtlogit y x1 x2, re该命令将变量y对x1和x2进行面板Logistic回归分析,并进行随机效应的估计。
6. areg命令:该命令用于进行差别法(Difference-in-Differences)模型的估计,适用于时间和个体差异的面板数据分析。
上述命令只是STATA中一部分常用的面板数据模型操作命令。
在实际应用中,根据具体的研究需求和数据特征,还可以使用其他面板数据模型命令进行分析,如xtlogit、xtprobit等。
stata常用命令总结

Stata常用命令总结Stata是一种统计分析软件,广泛用于社会科学、经济学、生物医学等领域的数据分析。
它具有丰富的功能和灵活的数据处理能力,能够进行各种统计分析、数据可视化和模型建立。
本文将总结Stata的常用命令,包括重要观点、关键发现和进一步思考,帮助读者更好地理解和使用Stata。
一、数据导入和处理e命令:用于导入Stata数据文件(.dta)。
2.import命令:用于导入其他格式的数据文件(如Excel、CSV等)。
3.save命令:用于保存当前数据文件。
4.drop命令:用于删除变量或观察值。
5.keep命令:用于保留指定的变量或观察值。
重要观点:在数据导入和处理阶段,要注意数据的完整性和准确性。
需要检查数据的缺失值、异常值和数据类型,做好数据清洗和预处理工作。
二、数据描述和统计分析1.summarize命令:用于计算变量的描述性统计量,如均值、标准差、最大值、最小值等。
2.tabulate命令:用于制作交叉表和列联表。
3.correlate命令:用于计算变量之间的相关系数。
4.regress命令:用于进行线性回归分析。
5.logit命令:用于进行二分类的逻辑回归分析。
重要观点:在进行数据描述和统计分析时,要根据研究问题选择合适的方法和指标。
同时要注意解释统计结果的意义,避免过度解读和误导。
三、数据可视化1.histogram命令:用于绘制直方图。
2.scatter命令:用于绘制散点图。
3.twoway命令:用于绘制多种类型的图形,如线图、柱状图、饼图等。
4.graph export命令:用于将图形导出为图片文件。
重要观点:数据可视化是数据分析的重要手段,能够直观地展示数据的分布和关系。
在进行数据可视化时,要选择合适的图形类型和参数,使图形简洁明了,易于理解和解释。
四、面板数据分析1.xtset命令:用于设置面板数据的时间和单位。
2.xtreg命令:用于进行面板数据的固定效应或随机效应模型分析。
stata 语法

stata 语法Stata 语法及其应用一、Stata 语法简介Stata 是一种统计分析软件,它具有强大的数据处理、统计分析和图形展示功能。
Stata 的语法简洁明了,便于用户使用和学习。
本文将介绍 Stata 的基本语法和一些常用的命令,以及它们在实际数据分析中的应用。
二、数据导入和整理1. 导入数据使用 Stata 导入数据的命令是 "use",其语法为:use "数据文件路径\文件名"。
例如,导入名为 "data.dta" 的 Stata 数据文件的命令是:use "C:\data.dta"。
2. 查看数据使用 Stata 查看数据的命令是 "browse",其语法为:browse。
该命令可以显示数据文件中的部分或全部观测值。
3. 数据清理对于数据清理,Stata 提供了一系列的命令,如"drop"、"replace" 和 "generate" 等。
其中,"drop" 命令可以删除变量或观测值,"replace" 命令可以替换变量的值,"generate" 命令可以生成新的变量。
三、数据分析1. 描述性统计描述性统计是对数据集的基本特征进行概括和分析。
Stata 提供了多种命令来计算和展示数据的描述性统计量,如 "summarize"、"tabulate" 和 "histogram" 等。
2. 回归分析回归分析是一种常用的统计方法,用于研究变量之间的关系。
在Stata 中,进行回归分析的命令是 "regress",其语法为:regress 因变量自变量1 自变量2 ...。
例如,进行一元线性回归分析的命令是:regress y x。
Stata小白:相见恨晚的10个常用命令

Stata⼩⽩:相见恨晚的10个常⽤命令Stata是Statacorp于1985年开发出来的统计程序,在全球范围内被⼴泛应⽤于企业和学术机构中。
许多使⽤者⼯作在研究领域,特别是在经济学、社会学、政治学及流⾏病学领域。
Stata的⼀系列功能包括:数据管理统计分析图表模拟⾃定义编程写在前⾯:Stata对于命令和变量名是区分⼤⼩写的,例如sum是概要统计的命令,⽽Sum和SUM就不是命令;price和Price是两个不同的变量。
所有命令中⽤到的符号都要在英⽂输⼊法状态下。
01.Stata的具体功能统计功能:Stata 的统计功能很强,除了传统的统计分析⽅法外,还收集了近 20 年发展起来的新⽅法,如 Cox ⽐例风险回归,指数与 Weibull 回归,多类结果与有序结果的 logistic 回归,Poisson 回归,负⼆项回归及⼴义负⼆项回归,随机效应模型等。
具体说, Stata 具有如下统计分析能⼒:数值变量资料的⼀般分析:参数估计,t检验,单因素和多因素的⽅差分析,协⽅差分析,交互效应模型,平衡和⾮平衡设计,嵌套设计,随机效应,多个均数的两两⽐较,缺项数据的处理,⽅差齐性检验,正态性检验,变量变换等。
分类资料的⼀般分析:参数估计,列联表分析 ( 列联系数,确切概率 ) ,流⾏病学表格分析等。
等级资料的⼀般分析:秩变换,秩和检验,秩相关等相关与回归分析:简单相关,偏相关,典型相关,以及多达数⼗种的回归分析⽅法,如多元线性回归,逐步回归,加权回归,稳键回归,⼆阶段回归,百分位数 ( 中位数 ) 回归,残差分析、强影响点分析,曲线拟合,随机效应的线性回归模型等。
其他⽅法:质量控制,整群抽样的设计效率,诊断试验评价, kappa 等。
作图功能:Stata 的作图模块,主要提供如下⼋种基本图形的制作 : 直⽅图 (histogram) ,条形图(bar), 百分条图 (oneway) ,百分圆图 (pie) ,散点图 (twoway) ,散点图矩阵(matrix) ,星形图(star) ,分位数图。
- 1、下载文档前请自行甄别文档内容的完整性,平台不提供额外的编辑、内容补充、找答案等附加服务。
- 2、"仅部分预览"的文档,不可在线预览部分如存在完整性等问题,可反馈申请退款(可完整预览的文档不适用该条件!)。
- 3、如文档侵犯您的权益,请联系客服反馈,我们会尽快为您处理(人工客服工作时间:9:00-18:30)。
Introduction to StataGetting Data Into StataThere are three ways of getting data into Stata1.direct keyboard entry using the Stata EDITOR2.read raw data (ASCII files) directly into a Stata dataset (Stata can import tab or commadelimited data or data in fixed column format)e a data transfer program such as DBMScopy or Stat/Transfer (we use Stat/Transfer) whichcan convert data from almost any common program (database, spreadsheet or statisticalpackage) into Stata and vice versaTyping Commands vs Using Menus vs Batch FilesThere are three ways that you can run Stata.1.choose commands from the drop-down menus2.type commands in to the “Command” box3.type a set of commands into a small file (called a -do- file) and then run the whole set ofcommands at once.Ultimately, you want to use -do- files for all of your research work because it is the only way that you can exactly reproduce any analyses that you have done. To move you in this direction, we will primarily use the “Command” box (ie type in commands), but if you are stuck, you can use the menus.21 Small Steps to Get You StartedThe following table outlines 21 simple steps that will get you started using Stata. These exercises use a dataset (nocardia.dta) that has already been saved in Stata format. These data are a subset of the data from a case-control study of Nocardia mastitis carried out in Nova Scotia. A description of the dataset is attached below.10 More Steps .... To Make You an Expert5 Challenge Steps1.What is the average herd size of herds that use, and don't use, cloxacillin based dry cowproducts?2.Does there seem to be any association between using neomycin products and cloxacillinproducts?3.Is the distribution of milk production levels approximately “normal”?4.What is the average herd size of herds that had a bulk tank SCC over 200,000 cells/ml?5.What is the variance of log-transformed bulk tank cell counts in herds that had more than 40cows?If you can complete these challenges ..... you truly are an expert!Stata Command SyntaxExamplessummarize age weightthis will compute summary statistics for the variables “age and “weight”summarize age weight if farm == 17summary statistics, but only for pigs from farm # 17by sex : summarize age weight if farm == 17separate summary statistics for each sex of pigs on farm # 17by sex : summarize age weight if farm == 17 , detailsame as above, but provide more detailed summary statisticsNotes:specifying a range of numbers1/5 is the same as 1 2 3 4 5specifying a list of variables farm1 - farm3 is the same as farm1 farm2 farm3 single =for assigning a value (eg. generate var5=12.5)double ==for checking if two things are equal (eg. sum xxx if var5 ==12.5)missing value is “ .”Data Manipulations in StataCreating New Variables in Statagen (generate)This command creates a new variable according to an “expression” that you type in.gen newvar = oldvar- this just copies oldvar intonewvargen age2 = age^2- new variable “age2" equals“age” squaredegen (extension to generate)This command also creates new variables but has a whole lot of ‘pre-programmed’ features to carry out special tasks.egen rankx = rank(x)- creates a new variable “rankx”that contains the rank ordering of the original variable “x”Creating “Dummy” (or indicator) Variables in StataWe often want to change a categorical variable into a series of “dummy” variables. We do this by putting the “xi:’ prefix before a Stata command and then putting “i.” before each categorical variable that needs to be converted to “dummy” variablesxi:‘expanded interaction’- a command that creates dummy variables for use in any Stata command- put “xi:” before the command- put “i.” before the variable(s) to be “dummied”- e.g. xi: regress prod bscc i.dout- this regresses prod on:–bulk tank SCC (a continuous variable)– a series of 3 dummy variables describing the herds level of outdoorexposure for dry cowsChanging the Contents of a Variable in StataeditUse the on-screen editor (that looks sort of like a spreadsheet)replaceThis command replaces the contents of an existing variable according to some expressionthat you type in.replace xyz = . if pqr == 23- this replaces all values of “xyz” with a missing value IF the value of pqr = 23. (Note thedouble ‘=’).recodeThis command changes specified values a variable to a new value.recode scc 1/199=1 200/399=2 400/9999=3- this changes scc from a continuous variable into a categorical variable with 3 levelsegen cutThis command creates a categorical variable from a continuous variableegen scc_cat=cut(scc), at(0 200 400 9999)- this does the same as the previous example, except that it creates a new variable (scc_cat) instead of replacing the contents of the original variable. This is safer since it doesn’t destroy your original data. The “ at(# # #) “ tells Stata where the boundries for the categories are. (Note: these are just a few examples of how to manipulate variables in Stata. See the on-screen help or the manuals for a more complete description of these codes and for other variable manipulation codes).Linear Regression in StataThe following notes only describe a few of the features of Stata that relate to linear regression. They are not intended to replace either the on-screen help, or the manuals.regress depvarname indepvarlist- basic linear regressionpredict newvarname, options- this will calculate a wide range of diagnostic values for assessing regression models predict predval, xb- (computes a new variable “predval” containing the pred. values)- some of the more commonly used options are as follows:Stepwise Linear Regression in StataCommand Syntaxsw reg depvarname indepvarlist, optionssw- is the commandreg- tells it you want linear regression (later we will use it for logistic regression by replacing reg with logistic or logit)depvarname is the name of the dependent variableindepvarlist is the list of independent variablesx1 x2 x3 x4 x5 x6 x7- all are treated as separate variablesx1 x2 (x3-x6) x7- x1 x2 and x7 are treated as separate variables and variables x3 to x6 are moved in or out of the model as a single termx1 x2 i.x3- the dummy variables created in i.x3 will be moved in or out asa block (this assumes that you put xi: before the command)Optionspr(#)- specify the p-value for removal eg. pr(0.05)pe(#)- specify the p-value for entryforward- specify forward selection (rether than backward elimination)lr- use the likelihood ratio test rather than Wald’s test for testing terms in logistic regressionhier- carry out hierarchical regression (check for term to enter or remove based on the order they are listed in the command line)lockterm- always keep the first term { ie a variable or a group of variables enclosed in () } in the model)(other options that relate to the regress or logistic commands can also be used)pr(#)-backward eliminationpr(#) hier- backward elimination in hierarchical mannerpr(#) pe(#)- stepwise (starting with a full model)pe(#)- forward selectionpe(#) hier- forward selection in hierarchical mannerpe(#) pr(#) forward- stepwise (starting with a null model)The Essential Features of Stata。