VISSIM使用指南
vissim仿真教程

vissim仿真教程Vissim是一种交通仿真软件,可用于模拟和分析不同道路网络的交通流量和交通行为。
在本教程中,我们将介绍如何使用Vissim进行仿真,并提供一些常用的操作和技巧。
1. 创建新模型:在Vissim中,点击"File"菜单,然后选择"New"来创建一个新的模型。
输入模型的名称和文件路径,然后点击"OK"。
2. 添加道路网络:在新创建的模型中,点击"Network"菜单,然后选择"Add"来添加道路网络。
在弹出的窗口中,可以选择添加不同类型的道路和交叉口。
3. 设定仿真参数:在Vissim的"Simulation"菜单中,点击"Parameters"来设定仿真参数。
包括仿真时间、车辆生成率、车辆类型等。
4. 添加车辆类型:在Vissim的"Vehicle"菜单中,点击"Vehicle types"来添加不同类型的车辆。
可以设定车辆的速度、加速度和行为等参数。
5. 生成车辆流:在Vissim的"Vehicle"菜单中,点击"Generate vehicles"来生成车辆流。
可以选择生成的车辆类型、车辆流量和生成的时间段。
6. 运行仿真:在Vissim的"Simulation"菜单中,点击"Run"来开始仿真。
可以观察车辆在道路网络中行驶的情况。
7. 分析数据:在Vissim的"Evaluation"菜单中,可以进行对仿真数据的分析。
可以查看车辆的平均速度、交通流量等信息,并生成相应的报告。
8. 保存模型:在Vissim的"File"菜单中,点击"Save"来保存模型。
可以选择保存为.vissim文件或者其他格式的文件。
VISSIM车辆及行人交通仿真操作步骤
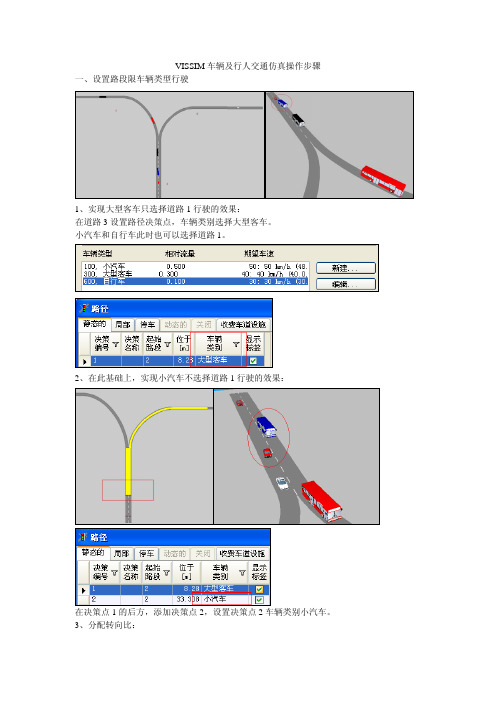
VISSIM车辆及行人交通仿真操作步骤一、设置路段限车辆类型行驶
1、实现大型客车只选择道路1行驶的效果:
在道路3设置路径决策点,车辆类别选择大型客车。
小汽车和自行车此时也可以选择道路1。
2、在此基础上,实现小汽车不选择道路1行驶的效果:
在决策点1的后方,添加决策点2,设置决策点2车辆类别小汽车。
3、分配转向比:
决策点的不同路径编号中,设置相对流量比,设置转向比。
4、控制决策点到连接器的距离
决策点到下一连接器之间要有一定距离,否则会报错。
二、公交站点车门开闭
1 菜单分布的公交车3D模式中设置车门位置和运用
2 先设置站台,再设置线路,保证站台是被激活的
3 设置线路发车间隔,并选定占用率大于1,保证有人下车,设置车辆在站点的下车方向
4 需要配置站台和候车区面域
5 上车行人路线的终点是到候车面域,下车区域的起点是在站台,下车路线的中间点不能让在候车面域上,否则还会回去上车。
6 候车区域面积不能太大
三、设置行人路径
1 根据底图绘制行人面域,扶梯是容易出现错误的环节,等完成面域的定义之后再绘制扶梯,障碍物对行人路径的选择产生影响,特别是与扶梯相交叉的情况会报错。
2 添加行人流量的时间区间应该在车辆发车之前
四、闸机设置
对于局部路径的设置,需要注意,主路径不能比局部路径还要具体,也就是说ABCD
A起点B中间点C中间点D终点
主路径可以是ABD 在B设置局部路径然后布局路径中可以包含C也可以直接到D
但是下列情况不允许主路径ABCD 而局部路径直接由B指向D。
这就发生一种误解,局部路径的客流会认为目的地是C,而局部路径不包含C而是指向了更远的点D。
vissim操作手册
VISSIM操作手册交通运输工程学院1. VISSIM简介 (1)2定义路网属性 (4)2.1物理路网 (4)2.1.1准备底图的创建流程 (4)2.1.2添加路段(Links) (7)2.1.3连接器 (9)2.2定义交通属性 (10)2.2.1定义分布 (10)2.2.2目标车速变化 (12)2.2.3 交通构成 (14)2.2.4 交通流量的输入 (15)2.3路线选择与转向 (15)2.4 信号控制交叉口设置 (17)2.4.1信号参数设置 (17)2.4.2信号灯安放及设置 (20)2.4.3优先权设置 (21)3仿真 (24)3.1 参数设置 (24)3.2 仿真 (25)4评价 (26)4.1 行程时间 (26)4.2 延误 (28)4.3 数据采集点 (30)4.4 排队计数器 (32)1. VISSIM简介VISSIM为德国PTV公司开发的微观交通流仿真软件系统,用于交通系统的各种运行分析。
该软件系统能分析在车道类型、交通组成、交通信号控制、停让控制等众多条件下的交通运行情况,具有分析、评价、优化交通网络、设计方案比较等功能,是分析许多交通问题的有效工具。
VISSIM采用的核心模型是Wiedemann于1974年建立的生理-心理驾驶行为模型。
该模型的基本思路是:一旦后车驾驶员认为他与前车之间的距离小于其心理(安全)距离时,后车驾驶员开始减速。
由于后车驾驶员无法准确判断前车车速,后车车速会在一段时间内低于前车车速,直到前后车间的距离达到另一个心理(安全)距离时,后车驾驶员开始缓慢地加速,由此周而复始,形成一个加速、减速的迭代过程。
图1.1 VISSIM中的跟车模型(Wiedemann 1974)VISSIM的主要应用包括:除了内建的定时信号控制模块外,还能够应用VAP、TEAPAC、VS-PLUS等感应信号控制模块。
在同时应用协调信号控制和感应信号控制的路网中,评价和优化(通过与Signal97/TEAPAC 的接口)交通运行状况。
第7章 VISSIM信号控制设置1

13
(2)放置信号灯
• 【编号】:信号灯的唯一 编号,需要自己进行编号。 • 【名称】:可选的标识或 注释。 • 【路段】:位于编号为3 的路段上。 • 【车道】:位于该路段第 2个车道上。
14
(2)放置信号灯
• 【位于】:位于该路段 113.213m处。 • 【信号控制机】:选择所 对应的信号控制机。 • 【信号灯组】:手动选择 所对应的信号灯组。 • 【新的3D信号灯】:生成 一个3D信号灯,可在3D状 态下显示和修改。
① 第1相位:红灯结束时间:120s,绿灯结束时间:30s,绿灯之 后的黄灯:3s; ③ 第2相位:红灯结束时间:33s,绿灯结束时间:33+25=58s, 绿灯之后的黄灯:2s; ④ 第3相位:红灯结束时间:60s,绿灯结束时间:60+30=90s, 绿灯之后的黄灯:3s; ⑤ 第4相位:红灯结束时间:93s,绿灯结束时间:93+25=118s, 绿灯之后的黄灯:2s。
15
(2)放置信号灯
• 【类型】:定义了该信号 灯在2D模式下的显示方式。 可提供的选项为:周期、 左行箭头、右行箭头、不 可见。 • 【车辆类别】:选择信号 灯起作用的车辆类别。
16
(2)放置信号灯
• 将编号中“?”修改为1,其它参数不变,点击确定,完 成该车道的操作。同理,在该路段车道1上点击右键,弹 出对话框,将编号中的“?”修改为2,其它参数不变, 点击确定,完成西进口的操作。 • 放置东进口直行车道的信号灯。参照西进口直行信号灯设 定。 • 放置西进口左转车道的信号灯。在西进口左转车道点击左 键选中该路段,在停车线处点击右键弹出对话框。将编号 中“?”修改为5,将信号控制机调整为1,信号灯组调整 为2,其它参数不变,点击确定,完成该车道的操作。
VISSIM使用手册
VISSIIM系统功能介绍1.程序介绍1.1VISSIIM Desktop(VISSIIM的桌面)一、标示列:显示程序的标题、解释及输入的档案问称(如果合适的话)二、功能选单(Menu):可按鼠标或热键选取显示出接下来的附属功能选单显示出接下来的对话框三、状态列(Status bar):显示编辑结构及仿真状态光标所在位置的公尺数路网编辑:在选择的节点内的位置及数字仿真状态:现在的仿真时间及当地循环时间网络节点:编辑教育、指导仿真状态:网页上现有的交通工具数量及在真正的时间内可能被仿真的交通工具可能之数量四、滚动条(Scroll bar):在网页可见范围内的水平及垂直滚动条五、工具列(Tool bar):图片编辑的功能六、工具列上的这些分开的按扭可以用鼠标的左键在它们的按扭上点选,其解释如表一:表一、工具列上按钮简介1.2 键盘、鼠标键作业(Keyboard and Mouse Click Operation)接下来的信息适用于在一般的原理,透过VISSIM路网编辑。
一、鼠标右键:插入一个新的要素(对象)二、左键:一下为选择一个存在的(对象)二下为打开连结的资料盒三、RETURN(返回):相当于使用鼠标在Highlight按钮上按键ESC:相当于鼠标在取消的按钮上按键DEL:删除一个选择要素(对象)注意:有些路网要素不能被DEL键删除,这样的要素要靠选择它并移走它的基本要素去删除掉。
如表二的这些按钮,只能在仿真或测试进行时才可被利用:表二、仿真按钮1.3打印(Printing)输出文本文件能被观看并且打印在标准的WINDOWS应用例如Notepad。
而且,大部份输出档案被制造,图形为了容易输入伸展表格应用。
在图解的输出中,例如动画屏幕镜头,是借着使用打印功能和布置方式对话框去打印。
而计算机打印出的文字由流动屏幕区域和数据文件构成在测试档钮上为Project(主题)和Scenario(剧本)和Simulation Time,File Name(文件名)。
vissim教程01
按钮凸显 路径决策点 路径决策点
决策编号
路径决策终点1 路径编号 两条路径的 相对车流比
路径决策点 路径决策终点2
1.5 冲突区的设置
删除出口匝道 添加相交道路
终点
按钮凸显
起点
1.5 冲突区的设置
添加相交道路流量
路段流量 按钮凸显 车辆构成黑色线段黑色来自段1.5 冲突区的设置
设置冲突区
竖直路段显红色, 表示需要让行 按钮凸显 主路显绿色,表 示具有优先权
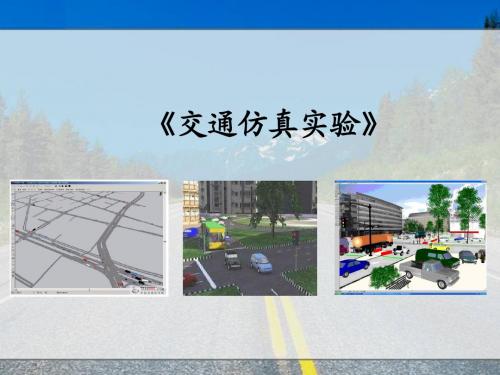
《交通仿真实验》
第1章 VISSIM仿真基础
第1章 VISSIM仿真基础
实验目的:掌握交通仿真系统VISSIM基本功能的使用。 实验原理:本章以基本路段、出口匝道和平交路口为 例,练习这些基本的交通仿真操作。 难点提示: (1)道路连接。 (2)路径决策。 (3)检测器设置。
1.1 界面认识
1.5 冲突区的设置
仿真查看
上部工具栏 菜单栏
左侧工 具栏 视图区
状态栏
1.2 实现基本路段仿真
编辑基本路段
道路起点 车道数
道路终点 行为类型
1.2 实现基本路段仿真
为路段添加车流量
路段流量 按钮凸显 车辆构成
1.2 实现基本路段仿真
进行仿真
仿真运行速度
1.3 设置行程时间检测器
设置检测器
检测器起点
检测器终点 应设置位置 检测器终点 距离
按钮凸显
1.3 设置行程时间检测器
评价结果输出
选中行程时间
平均行程时间
1.4 道路的连接和路径决策
连接匝道 添加出口匝道
按钮凸显 按钮凸显 选择车道1 连接器起点 选中 匝道起点 连接器终点 选择车道1 匝道终点 输入5
VISSIM_4.0_用户手册中文版(051116)
等感应信号控制模块。 z 在同时应用协调信号控制和感应信号控制的路网中,评价和优化(通过
与 Signal97/TEAPAC 的接口)交通运行状况。 z 城市道路网中轻轨建设项目的可行性及其影响评价。 z 交织区交通分析。 z 交通设计方案的对比分析。 z 复杂布局轻轨和公共汽车站点的交通影响分析。 z 公交优先方案的评价。 z 使用内建的动态交通分配模型,解决行驶路径选择的相关问题。
输入交通流量 静态路径(指定路网中的交通流向) 车辆速度 目标车速决策点(永久改变车辆速度) 减速区域(临时改变车辆速度) 优先控制 优先规则(如:无信号控制交叉口) 停车标志 信号灯 信号检测器 公共交通 公交站点 公交线路 评价(见第十章) 数据采集点 行程时间和延误测量 排队计数器 动态交通分配(可选模块,见第十一章) 停车场/小区连接器 节点(某些 VISSIM 用户可以独立于动态交通分配进行节点评价)
1. 车辆的技术参数 z 车辆长度 z 最大车速 z 可能的加速度 z 路网中所处位置 z 实际车速和加速度
2. “驾驶者-车辆-单元”的行为 z 驾驶员的生理-心理反应阀值 z 驾驶员的记忆力 z 基于当前车速和驾驶员目标车速的加速度
3. “驾驶员-车辆-单元”的内在联系 z 本车道和邻近车道的前车和后车 z 当前车辆所处路段和下一个交叉口 z 下一个交通信号
1.2 交通仿真模型
VISSIM 的核心由交通仿真器和信号状态产生器两部分组成,它们之间能够 交换检测器数据和信号状态信息。VISSIM 既可以在线生成可视化的交通运行状 况,也可以离线输出各种统计数据,如:行程时间、排队长度等。
vissim仿真教程(新手教学)
VISSIM交叉口仿真教程(新手版)概述:如今交通信息化已经成为当下交通工程发展的新方向,而▽1$5所作为一种重要的交通仿真软件,已经越来越多的应用在交通仿真的各个方面。
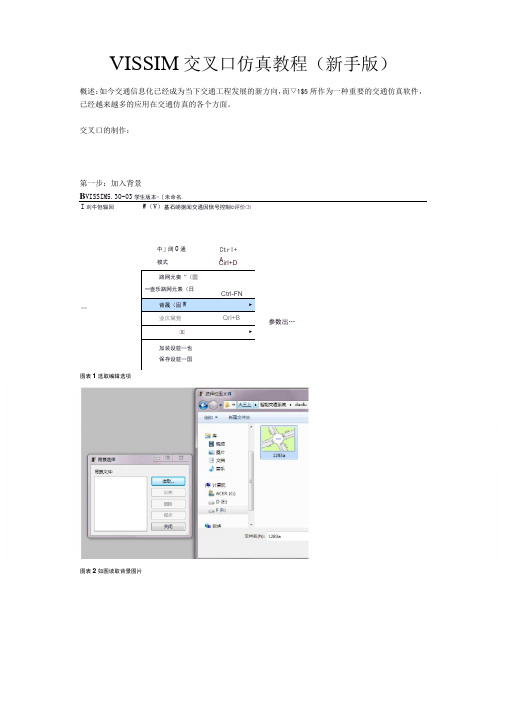
交叉口的制作:第一步:加入背景B VISSIM5.30-03学生版本-〔未命名.I刈牛但辎回Illlllll W(V)基石崂据闻交遹因信号控制©评价⑶中」阔0通模式Ctrl+A路网元奏“(国一壶乐路网元素(日Ctrl-FN背晟(固W►业仄窝竞Qrl+B㈤►加装设苣…也保存设苣…国Cirl+D参数出…图表1选取编辑选项图表2如图读取背景图片0背1选择 背袅文件; tm 关闭 12的a,gif 图表3选取比例选项,之后在背景上选取对应的车道宽度 第二步:绘制路网: 使用最左边工具栏里的冈 进行路网的绘制,按照车流前进的方向点死鼠标右键拉线,确定 治国反■三 不百壬值空度. 亲1_卑道麦次link 的起终点,之后进行l 至眸西5LB13m ink 参数的选择(包括车道等) :上:市区住1的出 L 道够画回I 匚生 如此,将背景图中的所有道路一一覆盖第三步:连接各个link选取要连接的link点击在其上点击右键然后拉向要被连接的link,之后显示出参数界面(包括可以取的曲线点的数目、1汨卜里的不同车道等),之后就有了link之间的连接线依此连接所有可行的link,为下一步输入车流打好基础。
第四步:加入交通量使用最左边工具栏里的进行车流的放入,在link 的远端起点(交叉口的进口道远端)选中该link 后点击右键,得到下图所显示的车辆输入界面:作为实验可以如图输入参数,表示该link 编号为1,一个仿真周期输入车流量1111,车辆类型及种类选取了默认。
第五步:给出车辆运行的路径:使用最左边工具栏里的里]进行路径的给出。
首先左键选取起始的Iink,在其上点击右键, 然后左键选取想要去的link ,在其上点击右键,则可以得到图示的效果:息车辆期入对同1111 3600流量的单位为辆;小灯r 黄色茶当元表示精确的流量C 非随机的)。
- 1、下载文档前请自行甄别文档内容的完整性,平台不提供额外的编辑、内容补充、找答案等附加服务。
- 2、"仅部分预览"的文档,不可在线预览部分如存在完整性等问题,可反馈申请退款(可完整预览的文档不适用该条件!)。
- 3、如文档侵犯您的权益,请联系客服反馈,我们会尽快为您处理(人工客服工作时间:9:00-18:30)。
INTRODUCTORY TRAININGVISSIMVISSIM is a microscopic, time step and behavior based simulation model developed to model urban traffic and public transit operations. The program can analyze traffic and transit operations under constraints such as lane configuration, traffic composition, traffic signals, transit stops, etc., thus making it a useful tool for the evaluation of various alternatives based on transportation engineering and planning measures of effectiveness.The traffic simulator in VISSIM is a microscopic traffic flow simulation model including the car following and lane change logic. VISSIM uses the psycho-physical driver behavior model developed by Wiedemann (1974). The basic concept of this model is that the driver of a faster moving vehicle starts to decelerate as he reaches his individual perception threshold to a slower moving vehicle. Since he cannot exactly determine the speed of that vehicle, his speed will fall below that vehicle’s speed until he starts to slightly accelerate again afte r reaching another perception threshold. This results in an iterative process of acceleration and deceleration.Open VISSIM and create a new fileFor every transport network a separate VISSIM file is needed. To create a new network the following steps are to be followed.1.Open the master plan of your study area as a background imageBuilding an accurate VISSIM model at least one scaled map that shows the real network. The image file of a digitized map (.jpg, .tiff, .bmp etc.) is to be imported as a background. This background can be displayed, moved and scaled in the VISSIM network window and is used to trace the VISSIM links and connectors.2.Scale the background and save a scaled background.Precise scaling is necessary for an accurate network model. A large scale distance (> 100 m / > 300 ft) is recommended to use.3. Draw links and connectors for streets and junctionsThe level of detail required for replicating the modeled transport network infrastructure depends on the purpose of a VISSIM application. While a rough outline of the analyzed intersection is sufficient for testing traffic actuated signal logic, a more detailed model is required for simulation analyses.Link: The first step in coding a VISSIM network is to trace links. Each approach and section should be represented by one link. A link cannothave multiple sections with a different number of lanes. Connectors (rather than links) should be used to model turning movements.Connectors: In order to create a road network, links need to be connected to other links. It is not sufficient to place one link on top of another link in order for vehicles to continue on the other link. Instead, a connector needs to be created to connect the two links. Furthermore connectors are used to model turnings of junctions.Set Parameters for the new file1.Simulation ParametersTraffic regulations: Specifies the standard driving side (For Ireland, Leftside-Traffic).Simulation Resolution: The number of times the vehicle’s position will be calculated within one simulated second (range 1 to 10) (more than 3 recommended).Random Seed: This parameter initializes the random number generator. Simulation runs with identical input files and random seeds generate identical results. Using a different random seed includes a stochastic variation of input flow arrival times.2.Speed profilesSome parameters in VISSIM are defined as a distribution rather than a fixed value. Thus the stochastic nature of traffic situations is reflected realistically. Most of the distributions are handled similarly and it is possible to use any kind of empirical or stochastic data for definition.Stochastic distributions of desired speeds are defined for each vehicle type within each traffic composition. The minimum and maximum values for the desired speed distribution are to be entered along with two intermediate points are generally adequate to define an s-shaped distribution.3. Vehicle Acceleration and Deceleration FunctionsVISSIM does not use a single acceleration and deceleration value but uses functions to represent the differences in a driver’s behavior. Acceleration and deceleration are functions of the current speed. These functions are predefined for each of the default vehicle types in VISSIM. They can be edited or new graphs can be created4. Dwell Time Distribution (Stops & Parking Lots)The dwell time distribution is used by VISSIM for dwell times at parking lots, stop signs, toll counters or transit stops. Either a normal distribution or an empirical distribution can be provided for transit stops.5. Vehicle type characteristicsIn addition to the default vehicle types (Car, HGV, Bus, Tram, Bike and Pedestrian), new vehicle types can be created or existing types modified. A vehicle class represents a logical container for one or more previously defined vehicle types.6. Create traffic compositionsA traffic composition defines the vehicle mix of each input flow to be defined for the VISSIM network. The relative percentage (proportion) of each vehicle type is to be given.7. Enter traffic volumes at network endpoints and pedestrian volumes at junctionsIn VISSIM, time variable traffic volumes to enter the network can be defined. For vehicle input definition, at least one traffic composition has to be defined. Traffic volumes are defined for each link and each time interval in vehicles per hour. Within one time interval vehicles enter the link based on a Poisson distribution.Fine Tuning of the VISSIM Network1. Enter routing decision points and associated routesA route is a fixed sequence of links and connectors. A route starts from a routing decision point (red cross-section) and extends up to at least one destination point (green cross-section) or multiple destinations. A route can have any length - from a turning movement at a singlejunction to a route that stretches throughout the entire VISSIM network.For static routing decisions, vehicles from a start point (red) to any of the defined destinations (green) using a static percentage for each destination.2. Enter speed changesReduced speed areas: When modeling short sections of slow speed characteristics (e.g. curves or bends), the use of reduced speed areas is advantageous over the use of desired speed decisions. In order for a reduced speed area to become effective vehicles need to pass its start position.Desired Speed Decisions: A desired speed decision is to be placed at a location where a permanent speed change should become effective. The typical application is the location of a speed sign in reality.3. Enter priority rulesPriority rules are to be applied for non-signalized intersections, permissive left turns, right turns on red light and pedestrian crosswalks. The right-of-way for non-signal-protected conflicting movements is modeled with priority rules. This applies to all situations where vehicles on different links/connectors should recognize each other. The two main conditions to check at the conflict marker(s) are minimum headway (distance) and minimum gap time.Conflict areas are a new alternative to priority rules to define priority in intersections. They are the recommended solution in most casesbecause they are more easily defined and the resulting vehicle behavior is more intelligent. A conflict area can be defined wherever two links/connectors in the VISSIM network overlap. For each conflict area, the user can select which of the conflicting links has right of way (if any).4. Enter stop signsIntersection approaches controlled by STOP signs are modeled in VISSIM as a combination of priority rule and STOP sign. A STOP sign forces vehicles to stop for at least one time step regardless of the presence of conflicting traffic while the priority rule deals with conflicting traffic, looking for minimum gap time and headway etc. STOP signs are required to be installed for non-signalized intersections and for right turns on red light.Create Signal ControlsSignalized intersections can be modeled in VISSIM either using the built-in fixed-time control or an optional external signal state generator. (Our license in Trinity has a fixed time control.)In VISSIM every signal controller (SC) is represented by its individual SC number and signal phase. Signal indications are typically updated at the end of each simulation second.Signal control and signal groups are to be modeled from Signal Control window. In Fixed Time Signal Control VISSIM starts a signal cycle at second 1 and ends with second Cycle time.Setup for output files and run simulationstravel time segmentsUsing Travel Time Measurements mode, a section of the network has to be selected on which the travel time is to be measured.The output format can be configured according to the requirement of the user.delay segmentsBased on travel time sections VISSIM can generate delay data for networks. A delay segment is based on one or more travel time sections. All vehicles that pass these travel time sections are captured by the delay segment. A delay time measurement determines - compared to the ideal travel time (no other vehicles, no signal control) - the mean time delay calculated from all vehicles observed on a single or several link sections.queue countersThe queue counter feature in VISSIM provides as output the average queue length, maximum queue length and the number of vehicle stops within the queue. Queues are counted from the location of the queue counter on the link or connector upstream to the final vehicle that is in queue condition. If the queue backs up onto multiple different approaches the queue counter will record information for all of them and report the longest as the maximum queue length.data collection pointsData collection offers the collection of data on single cross sections.QUICKSTART CHECKLIST1. Open VISSIM and create a new file2. Set the simulation parameters3. Create/edit speed profiles4. Check/edit vehicle type characteristics5. Create traffic compositions6. Open the master plan of your study area as a background image7. Place and scale the background image and save background image file.8. Draw links and connectors for roadways tracks and crosswalks9. Enter traffic volumes at network endpoints and pedestrian volumes at junctions10. Enter routing decision points and associated routes11. Enter speed changes12. Enter priority rules for non-signalized intersections13. Enter stop signs for non-signalized intersections14. Create Signal Controls with signal groups15. Enter signal heads in network16. Enter detectors for intersections controlled by traffic actuated signal control17. Enter stop signs for right turns on red18. Enter priority rules19. Create dwell time distributions and place transit stops in network20. Create transit lines21. Setup for output files22. Run the simulation。