投资学精要 博迪 第八版 课后答案 Chapter2
博迪莫顿版金融学所有习题参考答案

第一章课后习题答案一 . 我的生活目标:●完成学业●找到一份自己喜欢且收入不菲的工作●结婚和生养子女●拥有我自己的房子●供养我的家庭生活●供养孩子上学●退休在我实现目标的过程中,金融所扮演的角色:答案样例:1,金融现在可以为我提供大学本科及研究生教育的学费并帮我完成学业,帮我决定投资于上学是否是一个好的投资决定 2,高等教育可以帮助提高我赚钱的能力以及获得一个我喜欢的工作的能力 3,当我结婚并且有了孩子以后,我就有了额外的金融责任(以具体情况而定),我必须学会如何在家庭中的个人之间分配资源,学会如何留置一定的资金以用之于紧急事件,教育,假期旅游等;金融也帮助我理解如何应对危机,比如残疾,生活,健康 4,金融也帮我决定我想买的房子是否值钱,也帮我如何用最少的金融资源购买那所房子 5,金融帮我决定我应该储蓄多少钱以备我子女的学业和我以后的退休我主要的权衡决策:答案样例:1,现在花钱接受高等教育(并完成学业)可是假设以后由于我的高等教育文凭挣更多的钱 2,现在消费更多为以后比如买房,买车或储蓄留置很少的钱还是现在消费很少,甚至少于我的许多朋友二.答案样例:净值=资产-负债$__________(很可能会被低估)资产包括:经常帐户余额储蓄存款帐户余额家具设备,首饰类(如表)车(如果有的话)负债包括:学生贷款信用卡结余的差额各种租用金的协定(不包括转租)应付车款在计算净值时学生会特别地排除了他们一生潜在的赚钱三.一个单身汉之需要养活他自己,所以他可以独立自主的作出金融决策。
如果他不想购买健康保险(而愿意承担由这个决定而带来的金融风险)那么除了这个单身汉自身,没谁会受这个决定的影响。
另外,他不需要在家庭成员之间分配收入这件事上做任何决定。
单身汉是很灵活自由的,可以选择住在几乎任何地方。
他主要是在今天的消费(开支)和为明天储蓄之间做出权衡决策。
既然他只需要养活他自己,那么他储蓄的重要性就比对一家之主的重要性小。
国际投资学第二章国际投资理论课本精炼知识点(含课后习题答案)(共5篇)

国际投资学第二章国际投资理论课本精炼知识点(含课后习题答案)(共5篇)第一篇:国际投资学第二章国际投资理论课本精炼知识点(含课后习题答案)第二章国际投资理论第一节国际直接投资理论一、西方主流投资理论(一)垄断优势论:市场不完全性是企业获得垄断优势的根源,垄断优势是企业开展对外直接投资的动因。
市场不完全:由于各种因素的影响而引起的偏离完全竞争的一种市场结构。
市场的不完全包括:1.产品市场不完全2..要素市场不完全3.规模经济和外部经济的市场不完全4.政策引致的市场不完全。
跨国公司具有的垄断优势:1.信誉与商标优势2.资金优势3.技术优势4.规模经济优势(内部和外部)5.信息与管理优势。
跨国公司的垄断优势主要来源于其对知识资产的控制。
垄断优势认为不完全市场竞争是导致国际直接投资的根本原因。
(二)产品生命周期论:产品在市场销售中的兴与衰。
(三)内部化理论:把外部市场建立在公司内部的过程。
(纵向一体化,目的在于以内部市场取代原来的外部市场,从而降低外部市场交易成本并取得市场内部化的额外收益。
)(1)内部化理论的基本假设:1.经营的目的是追求利润最大化2.企业可能以内部市场取代外部市场3.内部化跨越了国界就产生了国际直接投资。
(2)市场内部化的影响因素:1.产业因素(最重要)2.国家因素3.地区因素4.企业因素(最重要)(3)市场内部化的收益:来源于消除外部市场不完全所带来的经济效益,包括1.统一协调相互依赖的企业各项业务,消除“时滞”所带来的经济效益。
2.制定有效的差别价格和转移价格所带来的经济效益。
3.消除国际市场不完全所带来的经济效益。
4.防止技术优势扩散和丧失所带来的经济效益。
市场内部化的成本:1.资源成本(企业可能在低于最优化经济规模的水平上从事生产,造成资源浪费)2.通信联络成本3.国家风险成本4.管理成本当市场内部化的收益大于大于外部市场交易成本和为实现内部化而付出的成本时,跨国企业才会进行市场内部化,当企业的内部化行为超越国界时,就产生对外直接投资。
第8版投资学精要课后答案中文

收益%=价格变动的%×总投资/投资者初始股权=价格变动的%×1 . 3 3 3 例如,当股票价格从 8 0 上涨至 8 8 时,价格变动百分率为 1 0%,而投资者收益百分率是 1 . 3 3 3 倍, 即 1 3 . 3 3%: 收益的%= 1 0%×20 000 美元/15 000 美元= 1 3 . 3 3% b. 250 股股票价值为 2 5 0P。股权为 2 5 0P-5 000。你会在 ( 2 5 0P-5 000)/250P=0.25 或当 P= 2 6 . 6 7 美元时 收到追加保证金的通知。 c. 但是现在你借入的是 10 000 美元而不是 5 000 美元。因此,股权仅为 2 5 0P-10 000 美元。 你 会在 ( 2 5 0P-10 000)/250P=0.25 或当 P= 5 3 . 3 3 美元时 收到追加保证金的通知。账户上股权越少,你就越容易接到追加保证金的通知。 d. 保证金贷款加上累计利息在一年后为 5 000 美元×1.08=5 400 美元。因此,你的账户的股权 为 2 5 0P-5 400 美元。初始股权为 15 000 美元。因此,你在一年后的收益率情况如下: [(250×8 8 美元-5 400 美元)-15 000 美元]/15 000 美元=0.106 7,或 1 0 . 6 7%。 (ii) [(250×80 美元-5 400 美元)-15 000 美元]/15 000 美元=-0.026 7,或-2.67%。 (iii) [(250×7 2 美元-5 400 美元)-15 000 美元]/15 000 美元=-0 . 1 6 0,或-1 6 . 0%。 I n t e l 股票价格变化和投资者收益百分率的关系由下式给定: 收益的%=价格变动的%×(总投资/投资者的初始股权)-8%×(借得的资金/投资者的初始股权) 例如,当股票价格从 8 0 上涨到 8 8 时,价格变动的百分比为 1 0%,而投资者收益百分率的变动 为 1 0%×(20 000/15 000)-8%×(5 000/15 000)=10.67% e. 250 股股票价值为 2 5 0P。股权为 2 5 0P-5 400。你将会在 ( 2 5 0P-5 400)/250P=0.25 或当 P= 2 8 . 8 0 美元时 收到追加保证金的通知。 下载 2. 假设投资者卖出 Intel 公司的 250 股股票,每股作价 80 美元,给经济人 15000 美元开立卖空 账户。 a. 如果投资者的保证金账户的资金无利息,一年后的 Intel 股价变为(i)88 美元(ii)80 美元 (iii)72 美元,投资者的回报率是多少?假设 Intel 不支付红利。 -13.3% ; 0; 13.3%
Essentials_Of_Investments_8th_Ed_Bodie_投资学精要(第八版)课
Chapter 04Mutual Funds and Other Investment CompaniesMutual funds offer many benefits Some of those benefits include the ability to invest with small amounts of money diversification professional management low transaction costs tax benefits and reduce administrative functionsClose-end funds trade on the open market and are thus subject to market pricing Open-end funds are sold by the mutual fund and must reflect the NAV of the investmentsAnnual fees charged by a mutual fund to pay for marketing and distribution costsA unit investment trust is an unmanaged mutual fund Its portfolio is fixed and does not change due to asset trades as does a close-end fund Exchange-traded funds can be traded during the day just as the stocks they represent They are most tax effective in that they do not have as many distributions They also have much lower transaction costs They alsodo not require load charges management fees and minimum investment amounts Hedge funds have much less regulation since they are part of private partnerships and free from mist SEC regulation They permit investors to take on many risks unavailable to mutual funds Hedge funds however may require higher fees and provide less transparency to investors This offerssignificant counter party risk and hedge fund investors need to be more careful about the firm the invest withAn open-end fund will have higher fees since they are actively marketing and managing their investor base The fund is always looking for new investors A unit investment trust need not spend too much time on such matters since investors find each otherAsset allocation funds may dramatically vary the proportions allocated to each market in accord with the portfolio managers forecast of the relative performance of each sector Hence these funds are engaged in market timing and are not designed to be low-risk investment vehiclesa A unit investment trusts offer low costs and stable portfolios Since they do not change their portfolio the investor knows exactly what they own They are better suited to sophisticated investorsb Open-end mutual funds offer higher levels of service to investors The investors do not have any administrative burdens and their money is actively managed This is better suited for less knowledgeable investorsc Individual securities offer the most sophisticated investors ultimate flexibility They are able to save money since they are only charged the expenses they incur All decisions are under the control of the investorOpen-end funds must honor redemptions and receive deposits from investors This flow of money necessitates retaining cash Close-end fundsno longer take and receive money from investors As such they are free to be fully invested at all timesThe offering price includes a 6 front-end load or sales commission meaning that every dollar paid results in only 094 going toward purchase of shares ThereforeOffering price 1138NAV offering price 1 – load 1230 95 1169HWValue of stocks sold and replaced 15000000Turnover rate 0357 357NAV 3940Premium or discount –0086 -86The fund sells at an 86 discount from NAVRate of return 00880 880HWAssume a hypothetical investment of 100Loaded upa Year 1 100 x 106-0175 10425b Year 3 100 x 106-0175 3 11630c Year 10 100 x 106-0175 10 15162Economy funda Year 1 100 x 98 x 106-0025 10364b Year 3 100 x 98 x 106-0025 3 11590c Year 10 100 x 98 x 106-0025 10 17141NAVa 450000000 – 10000000 44000000 10 per shareb 440000000 – 10000000 43000000 10 per shareEmpirical research indicates that past performance of mutual funds is not highly predictive of future performance especially for better-performing funds While there may be some tendency for the fund to be an above ave。
博迪《投资学》笔记和课后习题详解(最优风险资产组合)【圣才出品】

第8章最优风险资产组合8.1 复习笔记1. 分散化与资产组合风险(1)系统性风险与非系统性风险分散化能够降低风险,但是当共同的风险来源影响所有的公司时,分散化就不能消除风险了。
资产组合的标准差随着证券种类的增加而下降,但是,它不能降至零。
在最充分的分散条件下还存在着市场风险,它来源于与市场有关的因素,这种风险亦被称为“系统风险”,或“不可分散风险”。
而那些可被分散化消除的风险被称为“独特风险”、“特有公司风险”、“非系统风险”或“可分散风险”。
(2)两种风险资产的资产组合①资产组合的风险与收益资产组合的期望收益是资产组合中各种证券的期望收益的加权平均值,即:两资产的资产组合的方差是:②表格法计算组合方差表8-1显示可以通过电子表格计算资产组合的方差。
其中a表示两个共同基金收益的相邻协方差矩阵,相邻矩阵是沿着首排首列相邻每一基金在资产组合中权重的协方差矩阵。
可以通过如下方法得到资产组合的方差:斜方差矩阵中的每个因子与行、列中的权重相乘,把四个结果相加,就可以得出给出的资产组合方差。
表8-1 通过协方差矩阵计算资产组合方差③相关系数与资产组合方差具有完全正相关(相关系数为1)的资产组合的标准差恰好是资产组合中各证券标准差的加权平均值。
相关系数小于1时,资产组合的标准差小于资产组合中各证券标准差的加权平均值。
通过调整资产比例,具有完全负相关(相关系数为-1)的资产组合的标准差可以趋向0。
④资产组合比例与资产组合方差当两种资产负相关时,调整资产组合比例可以得到小于两种资产方差的最小组合方差。
若某个资产比例为负值,表示借入(或卖空)该资产。
⑤机会集机会集是指多种资产进行组合所能构成的所有风险收益的集合。
2. 资产配置(1)最优风险资产组合最优风险资产组合是使资本配置线的斜率(报酬与波动比率)最大的风险资产组合,这样表示边际风险报酬最大。
最优风险资产组合为资产配置线与机会集曲线的切点。
(2)最优完整资产组合最优完整资产组合为投资者无差异曲线与资本配置线的切点处组合,最优完整组合包含风险资产组合(债券和股票)以及无风险资产(国库券)。
Essentials Of Investments 8th Ed Bodie 投资学精要(第八版)课后习题答案Chap007
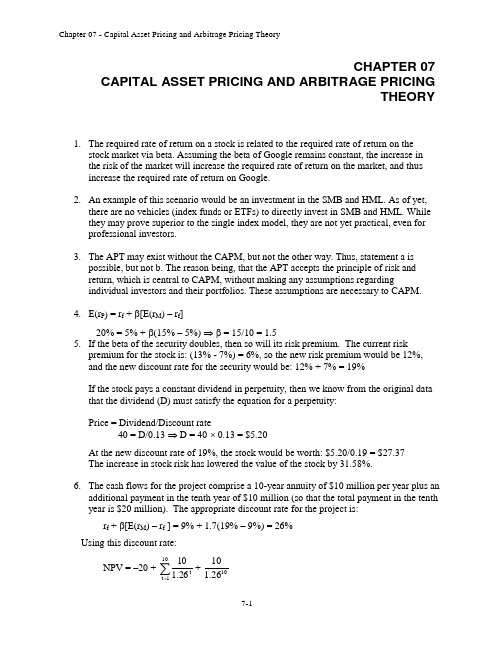
CHAPTER 07CAPITAL ASSET PRICING AND ARBITRAGE PRICINGTHEORY1. The required rate of return on a stock is related to the required rate of return on thestock market via beta. Assuming the beta of Google remains constant, the increase in the risk of the market will increase the required rate of return on the market, and thus increase the required rate of return on Google.2. An example of this scenario would be an investment in the SMB and HML. As of yet,there are no vehicles (index funds or ETFs) to directly invest in SMB and HML. While they may prove superior to the single index model, they are not yet practical, even for professional investors.3. The APT may exist without the CAPM, but not the other way. Thus, statement a ispossible, but not b. The reason being, that the APT accepts the principle of risk and return, which is central to CAPM, without making any assumptions regardingindividual investors and their portfolios. These assumptions are necessary to CAPM.4. E(r P ) = r f + β[E(r M ) – r f ]20% = 5% + β(15% – 5%) ⇒ β = 15/10 = 1.55. If the beta of the security doubles, then so will its risk premium. The current riskpremium for the stock is: (13% - 7%) = 6%, so the new risk premium would be 12%, and the new discount rate for the security would be: 12% + 7% = 19%If the stock pays a constant dividend in perpetuity, then we know from the original data that the dividend (D) must satisfy the equation for a perpetuity:Price = Dividend/Discount rate 40 = D/0.13 ⇒ D = 40 ⨯ 0.13 = $5.20 At the new discount rate of 19%, the stock would be worth: $5.20/0.19 = $27.37The increase in stock risk has lowered the value of the stock by 31.58%.6. The cash flows for the project comprise a 10-year annuity of $10 million per year plus anadditional payment in the tenth year of $10 million (so that the total payment in the tenth year is $20 million). The appropriate discount rate for the project is:r f + β[E(r M ) – r f ] = 9% + 1.7(19% – 9%) = 26% Using this discount rate:NPV = –20 + +∑=101t t26.1101026.110= –20 + [10 ⨯ Annuity factor (26%, 10 years)] + [10 ⨯ PV factor (26%, 10 years)] = 15.64The internal rate of return on the project is 49.55%. The highest value that beta can take before the hurdle rate exceeds the IRR is determined by:49.55% = 9% + β(19% – 9%) ⇒ β = 40.55/10 = 4.055 7. a. False. β = 0 implies E(r) = r f , not zero.b. False. Investors require a risk premium for bearing systematic (i.e., market orundiversifiable) risk.c. False. You should invest 0.75 of your portfolio in the market portfolio, and theremainder in T-bills. Then: βP = (0.75 ⨯ 1) + (0.25 ⨯ 0) = 0.758.a. The beta is the sensitivity of the stock's return to the market return. Call theaggressive stock A and the defensive stock D . Then beta is the change in the stock return per unit change in the market return. We compute each stock's beta by calculating the difference in its return across the two scenarios divided by the difference in market return.00.2205322A =--=β70.0205145.3D =--=βb. With the two scenarios equal likely, the expected rate of return is an average ofthe two possible outcomes: E(r A ) = 0.5 ⨯ (2% + 32%) = 17%E(r B ) = 0.5 ⨯ (3.5% + 14%) = 8.75%c. The SML is determined by the following: T-bill rate = 8% with a beta equal tozero, beta for the market is 1.0, and the expected rate of return for the market is:0.5 ⨯ (20% + 5%) = 12.5%See the following graph.812.5%S M LThe equation for the security market line is: E(r) = 8% + β(12.5% – 8%) d. The aggressive stock has a fair expected rate of return of:E(r A ) = 8% + 2.0(12.5% – 8%) = 17%The security analyst’s estimate of the expected rate of return is also 17%.Thus the alpha for the aggressive stock is zero. Similarly, the required return for the defensive stock is:E(r D ) = 8% + 0.7(12.5% – 8%) = 11.15%The security analyst’s estimate of the expected return for D is only 8.75%, and hence:αD = actual expected return – required return predicted by CAPM= 8.75% – 11.15% = –2.4%The points for each stock are plotted on the graph above.e. The hurdle rate is determined by the project beta (i.e., 0.7), not by the firm’sbeta. The correct discount rate is therefore 11.15%, the fair rate of return on stock D.9. Not possible. Portfolio A has a higher beta than Portfolio B, but the expected returnfor Portfolio A is lower.10. Possible. If the CAPM is valid, the expected rate of return compensates only forsystematic (market) risk as measured by beta, rather than the standard deviation, which includes nonsystematic risk. Thus, Portfolio A's lower expected rate of return can be paired with a higher standard deviation, as long as Portfolio A's beta is lower than that of Portfolio B.11. Not possible. The reward-to-variability ratio for Portfolio A is better than that of themarket, which is not possible according to the CAPM, since the CAPM predicts that the market portfolio is the most efficient portfolio. Using the numbers supplied:S A =5.0121016=- S M =33.0241018=-These figures imply that Portfolio A provides a better risk-reward tradeoff than the market portfolio.12. Not possible. Portfolio A clearly dominates the market portfolio. It has a lowerstandard deviation with a higher expected return.13. Not possible. Given these data, the SML is: E(r) = 10% + β(18% – 10%)A portfolio with beta of 1.5 should have an expected return of: E(r) = 10% + 1.5 ⨯ (18% – 10%) = 22%The expected return for Portfolio A is 16% so that Portfolio A plots below the SML (i.e., has an alpha of –6%), and hence is an overpriced portfolio. This is inconsistent with the CAPM.14. Not possible. The SML is the same as in Problem 12. Here, the required expectedreturn for Portfolio A is: 10% + (0.9 ⨯ 8%) = 17.2%This is still higher than 16%. Portfolio A is overpriced, with alpha equal to: –1.2%15. Possible. Portfolio A's ratio of risk premium to standard deviation is less attractivethan the market's. This situation is consistent with the CAPM. The market portfolio should provide the highest reward-to-variability ratio.16.a.b.As a first pass we note that large standard deviation of the beta estimates. None of the subperiod estimates deviate from the overall period estimate by more than two standard deviations. That is, the t-statistic of the deviation from the overall period is not significant for any of the subperiod beta estimates. Looking beyond the aforementioned observation, the differences can be attributed to different alpha values during the subperiods. The case of Toyota is most revealing: The alpha estimate for the first two years is positive and for the last two years negative (both large). Following a good performance in the "normal" years prior to the crisis, Toyota surprised investors with a negative performance, beyond what could be expected from the index. This suggests that a beta of around 0.5 is more reliable. The shift of the intercepts from positive to negative when the index moved to largely negative returns, explains why the line is steeper when estimated for the overall period. Draw a line in the positive quadrant for the index with a slope of 0.5 and positive intercept. Then draw a line with similar slope in the negative quadrant of the index with a negative intercept. You can see that a line that reconciles the observations for both quadrants will be steeper. The same logic explains part of the behavior of subperiod betas for Ford and GM.17. Since the stock's beta is equal to 1.0, its expected rate of return should be equal to thatof the market, that is, 18%. E(r) =01P P P D -+0.18 =100100P 91-+⇒ P 1 = $10918. If beta is zero, the cash flow should be discounted at the risk-free rate, 8%:PV = $1,000/0.08 = $12,500If, however, beta is actually equal to 1, the investment should yield 18%, and the price paid for the firm should be:PV = $1,000/0.18 = $5,555.56The difference ($6944.44) is the amount you will overpay if you erroneously assume that beta is zero rather than 1.ing the SML: 6% = 8% + β(18% – 8%) ⇒β = –2/10 = –0.220.r1 = 19%; r2 = 16%; β1 = 1.5; β2 = 1.0a.In order to determine which investor was a better selector of individual stockswe look at the abnormal return, which is the ex-post alpha; that is, the abnormalreturn is the difference between the actual return and that predicted by the SML.Without information about the parameters of this equation (i.e., the risk-free rateand the market rate of return) we cannot determine which investment adviser isthe better selector of individual stocks.b.If r f = 6% and r M = 14%, then (using alpha for the abnormal return):α1 = 19% – [6% + 1.5(14% – 6%)] = 19% – 18% = 1%α2 = 16% – [6% + 1.0(14% – 6%)] = 16% – 14% = 2%Here, the second investment adviser has the larger abnormal return and thusappears to be the better selector of individual stocks. By making betterpredictions, the second adviser appears to have tilted his portfolio toward under-priced stocks.c.If r f = 3% and r M = 15%, then:α1 =19% – [3% + 1.5(15% – 3%)] = 19% – 21% = –2%α2 = 16% – [3%+ 1.0(15% – 3%)] = 16% – 15% = 1%Here, not only does the second investment adviser appear to be a better stockselector, but the first adviser's selections appear valueless (or worse).21.a.Since the market portfolio, by definition, has a beta of 1.0, its expected rate ofreturn is 12%.b.β = 0 means the stock has no systematic risk. Hence, the portfolio's expectedrate of return is the risk-free rate, 4%.ing the SML, the fair rate of return for a stock with β= –0.5 is:E(r) = 4% + (–0.5)(12% – 4%) = 0.0%The expected rate of return, using the expected price and dividend for next year: E(r) = ($44/$40) – 1 = 0.10 = 10%Because the expected return exceeds the fair return, the stock must be under-priced.22.The data can be summarized as follows:ing the SML, the expected rate of return for any portfolio P is:E(r P) = r f + β[E(r M) – r f ]Substituting for portfolios A and B:E(r A) = 6% + 0.8 ⨯ (12% – 6%) = 10.8%E(r B) = 6% + 1.5 ⨯ (12% – 6%) = 15.0%Hence, Portfolio A is desirable and Portfolio B is not.b.The slope of the CAL supported by a portfolio P is given by:S =P fP σr)E(r-Computing this slope for each of the three alternative portfolios, we have:S (S&P 500) = 6/20S (A) = 5/10S (B) = 8/31Hence, portfolio A would be a good substitute for the S&P 500.23.Since the beta for Portfolio F is zero, the expected return for Portfolio F equals therisk-free rate.For Portfolio A, the ratio of risk premium to beta is: (10% - 4%)/1 = 6%The ratio for Portfolio E is higher: (9% - 4%)/(2/3) = 7.5%This implies that an arbitrage opportunity exists. For instance, you can create aPortfolio G with beta equal to 1.0 (the same as the beta for Portfolio A) by taking a long position in Portfolio E and a short position in Portfolio F (that is, borrowing at the risk-free rate and investing the proceeds in Portfolio E). For the beta of G to equal 1.0, theproportion (w) of funds invested in E must be: 3/2 = 1.5The expected return of G is then:E(r G) = [(-0.50) ⨯ 4%] + (1.5 ⨯ 9%) = 11.5%βG = 1.5 ⨯ (2/3) = 1.0Comparing Portfolio G to Portfolio A, G has the same beta and a higher expected return.Now, consider Portfolio H, which is a short position in Portfolio A with the proceedsinvested in Portfolio G:βH = 1βG + (-1)βA = (1 ⨯ 1) + [(-1) ⨯ 1] = 0E(r H) = (1 ⨯ r G) + [(-1) ⨯ r A] = (1 ⨯ 11.5%) + [(- 1) ⨯ 10%] = 1.5%The result is a zero investment portfolio (all proceeds from the short sale of Portfolio Aare invested in Portfolio G) with zero risk (because β = 0 and the portfolios are welldiversified), and a positive return of 1.5%. Portfolio H is an arbitrage portfolio.24.Substituting the portfolio returns and betas in the expected return-beta relationship, weobtain two equations in the unknowns, the risk-free rate (r f ) and the factor return (F):14.0% = r f + 1 ⨯ (F – r f )14.8% = r f + 1.1 ⨯ (F – r f )From the first equation we find that F = 14%. Substituting this value for F into the second equation, we get:14.8% = r f + 1.1 ⨯ (14% – r f ) ⇒ r f = 6%25.a.Shorting equal amounts of the 10 negative-alpha stocks and investing the proceedsequally in the 10 positive-alpha stocks eliminates the market exposure and creates azero-investment portfolio. Using equation 7.5, and denoting the market factor as R M,the expected dollar return is [noting that the expectation of residual risk (e) inequation 7.8 is zero]:$1,000,000 ⨯ [0.03 + (1.0 ⨯ R M)] – $1,000,000 ⨯ [(–0.03) + (1.0 ⨯ R M)]= $1,000,000 ⨯ 0.06 = $60,000The sensitivity of the payoff of this portfolio to the market factor is zero because theexposures of the positive alpha and negative alpha stocks cancel out. (Notice thatthe terms involving R M sum to zero.) Thus, the systematic component of total riskalso is zero. The variance of the analyst's profit is not zero, however, since thisportfolio is not well diversified.For n = 20 stocks (i.e., long 10 stocks and short 10 stocks) the investor will have a$100,000 position (either long or short) in each stock. Net market exposure is zero,but firm-specific risk has not been fully diversified. The variance of dollar returnsfrom the positions in the 20 firms is:20 ⨯ [(100,000 ⨯ 0.30)2] = 18,000,000,000The standard deviation of dollar returns is $134,164.b.If n = 50 stocks (i.e., 25 long and 25 short), $40,000 is placed in each position,and the variance of dollar returns is:50 ⨯ [(40,000 ⨯ 0.30)2] = 7,200,000,000The standard deviation of dollar returns is $84,853.Similarly, if n = 100 stocks (i.e., 50 long and 50 short), $20,000 is placed ineach position, and the variance of dollar returns is:100 ⨯ [(20,000 ⨯ 0.30)2] = 3,600,000,000The standard deviation of dollar returns is $60,000.Notice that when the number of stocks increases by a factor of 5 (from 20 to 100),standard deviation falls by a factor of 5= 2.236, from $134,164 to $60,000. 26.Any pattern of returns can be "explained" if we are free to choose an indefinitely largenumber of explanatory factors. If a theory of asset pricing is to have value, it mustexplain returns using a reasonably limited number of explanatory variables (i.e.,systematic factors).27.The APT factors must correlate with major sources of uncertainty, i.e., sources ofuncertainty that are of concern to many investors. Researchers should investigatefactors that correlate with uncertainty in consumption and investment opportunities.GDP, the inflation rate and interest rates are among the factors that can be expected to determine risk premiums. In particular, industrial production (IP) is a good indicator of changes in the business cycle. Thus, IP is a candidate for a factor that is highlycorrelated with uncertainties related to investment and consumption opportunities in the economy.28.The revised estimate of the expected rate of return of the stock would be the oldestimate plus the sum of the unexpected changes in the factors times the sensitivitycoefficients, as follows:Revised estimate = 14% + [(1 ⨯ 1) + (0.4 ⨯ 1)] = 15.4%29.Equation 7.11 applies here:E(r P) = r f + βP1[E(r1) - r f] + βP2[E(r2) – r f]We need to find the risk premium for these two factors:γ1 = [E(r1) - r f] andγ2 = [E(r2) - r f]To find these values, we solve the following two equations with two unknowns: 40% = 7% + 1.8γ1 + 2.1γ210% = 7% + 2.0γ1 + (-0.5)γ2The solutions are: γ1 = 4.47% and γ2 = 11.86%Thus, the expected return-beta relationship is:E(r P) = 7% + 4.47βP1 + 11.86βP230.The first two factors (the return on a broad-based index and the level of interest rates)are most promising with respect to the likely impa ct on Jennifer’s firm’s cost of capital.These are both macro factors (as opposed to firm-specific factors) that can not bediversified away; consequently, we would expect that there is a risk premiumassociated with these factors. On the other hand, the risk of changes in the price ofhogs, while important to some firms and industries, is likely to be diversifiable, andtherefore is not a promising factor in terms of its impact on the firm’s cost of capital.31.Since the risk free rate is not given, we assume a risk free rate of 0%. The APT required(i.e., equilibrium) rate of return on the stock based on Rf and the factor betas is:Required E(r) = 0 + (1 x 6) + (0.5 x 2) + (0.75 x 4) = 10%According to the equation for the return on the stock, the actually expected return onthe stock is 6 % (because the expected surprises on all factors are zero by definition).Because the actually expected return based on risk is less than the equilibrium return,we conclude that the stock is overpriced.CFA 1a, c and dCFA 2a.E(r X) = 5% + 0.8(14% – 5%) = 12.2%αX = 14% – 12.2% = 1.8%E(r Y) = 5% + 1.5(14% – 5%) = 18.5%αY = 17% – 18.5% = –1.5%b.(i)For an investor who wants to add this stock to a well-diversified equityportfolio, Kay should recommend Stock X because of its positivealpha, while Stock Y has a negative alpha. In graphical terms, StockX’s expected return/risk profile plots above the SML, while Stock Y’sprofile plots below the SML. Also, depending on the individual riskpreferences of Kay’s clients, Stock X’s lower beta may have abeneficial impact on overall portfolio risk.(ii)For an investor who wants to hold this stock as a single-stock portfolio,Kay should recommend Stock Y, because it has higher forecastedreturn and lower standard deviation than S tock X. Stock Y’s Sharperatio is:(0.17 – 0.05)/0.25 = 0.48Stock X’s Sharpe ratio is only:(0.14 – 0.05)/0.36 = 0.25The market index has an even more attractive Sharpe ratio:(0.14 – 0.05)/0.15 = 0.60However, given the choice between Stock X and Y, Y is superior.When a stock is held in isolation, standard deviation is the relevantrisk measure. For assets held in isolation, beta as a measure of risk isirrelevant. Although holding a single asset in isolation is not typicallya recommended investment strategy, some investors may hold what isessentially a single-asset portfolio (e.g., the stock of their employercompany). For such investors, the relevance of standard deviationversus beta is an important issue.CFA 3a.McKay should borrow funds and i nvest those funds proportionally in Murray’sexisting portfolio (i.e., buy more risky assets on margin). In addition toincreased expected return, the alternative portfolio on the capital market line(CML) will also have increased variability (risk), which is caused by the higherproportion of risky assets in the total portfolio.b.McKay should substitute low beta stocks for high beta stocks in order to reducethe overall beta of York’s portfolio. By reducing the overall portfolio beta,McKay will reduce the systematic risk of the portfolio and therefore theportfolio’s volatility relative to the market. The security market line (SML)suggests such action (moving down the SML), even though reducing beta mayresult in a slight loss of portfolio efficiency unless full diversification ismaintained. York’s primary objective, however, is not to maintain efficiencybut to reduce risk exposure; reducing portfolio beta meets that objective.Because York does not permit borrowing or lending, McKay cannot reduce riskby selling equities and using the proceeds to buy risk free assets (i.e., by lendingpart of the portfolio).CFA 4c.“Both the CAPM and APT require a mean-variance efficient market portfolio.”This statement is incorrect. The CAPM requires the mean-variance efficientportfolio, but APT does not.d.“The CAPM assumes that one specific factor explains security returns but APTdoes not.” This statement is c orrect.CFA 5aCFA 6dCFA 7d You need to know the risk-free rate.CFA 8d You need to know the risk-free rate.CFA 9Under the CAPM, the only risk that investors are compensated for bearing is the riskthat cannot be diversified away (i.e., systematic risk). Because systematic risk(measured by beta) is equal to 1.0 for each of the two portfolios, an investor wouldexpect the same rate of return from each portfolio. Moreover, since both portfolios are well diversified, it does not matter whether the specific risk of the individual securities is high or low. The firm-specific risk has been diversified away from both portfolios. CFA 10b r f = 8% and E(r M) = 16%E(r X) = r f + βX[E(r M) – r f] = 8% + 1.0(16% - 8%) = 16%E(r Y) = r f + βY[E(r M) – r f] = 8% + 0.25(16% - 8%) = 10%Therefore, there is an arbitrage opportunity.CFA 11cCFA 12dCFA 13cInvestors will take on as large a position as possible only if the mis-pricingopportunity is an arbitrage. Otherwise, considerations of risk anddiversification will limit the position they attempt to take in the mis-pricedsecurity.CFA 14d。
投资学精要 博迪 第八版 课后答案 Chapter2
CHAPTER 02 ASSET CLASSES AND FINANCIAL INSTRUMENTS mon stock is an ownership share in a publicly held corporation. Commonshareholders have voting rights and may receive dividends. Preferred stockrepresents nonvoting shares in a corporation, usually paying a fixed stream ofdividends. While corporate bonds are long-term debt by corporations, typically paying semi-annual coupons and returning the face value of the bond at maturity.2.While the DJIA has 30 large corporations in the index, it does not represent theoverall market nearly as well as the 500 stocks contained in The Wilshire index.The DJIA is simply too small.3.They are short term, very safe, and highly liquid. Also, their unit value almostnever changes.4.Treasury bills, certificates of d eposit, commercial paper, bankers’ acceptances,Eurodollars, repos, reserves, federal funds and brokers’ calls.5.American Depository Receipts, or ADRs, are certificates traded in U.S. marketsthat represent ownership in shares of a foreign company. Investors may alsopurchase shares of foreign companies on foreign exchanges. Lastly, investors may use international mutual funds to own shares indirectly.6.Because they produce coupons that are tax free.7.The fed funds rate is simply the rate of interest on very short-term loans amongfinancial institutions. The London Interbank Offer Rate (LIBOR) is the rate at which large banks in London are willing to lend money among themselves.8.General obligation bonds are backed by the local governments, while revenuebonds have proceeds attached to specific projects. A revenue bond has lessguarantees, therefore, it is riskier and will have a higher yield.9.Corporations may exclude 70% of dividends received from domestic corporationsin the computation of their taxable income.10.Limited liability means that the most shareholders can lose in event of the failureof the corporation is their original investment.11.Money market securities are referred to as “cash equivalents” because of theirgreat liquidity. The prices of money market securities are very stable, and they can be converted to cash (i.e., sold) on very short notice and with very lowtransaction costs.12.Taxable equivalent yield = .0675 / (1-.35) = .103813.a.The taxable bond. With a zero tax bracket, the after-tax yield for thetaxable bond is the same as the before-tax yield (5%), which is greaterthan the yield on the municipal bond.b.The taxable bond. The after-tax yield for the taxable bond is:0.05 x (1 – 0.10) = 4.5%c.You are indifferent. The after-tax yield for the taxable bond is:0.05 x (1 – 0.20) = 4.0%The after-tax yield is the same as that of the municipal bond.d.The municipal bond offers the higher after-tax yield for investors in taxbrackets above 20%.14.The after-tax yield on the corporate bonds is: [0.09 x (1 – 0.30)] = 0.0630 =6.30%. Therefore, the municipals must offer at least 6.30% yields.15.The equivalent taxable yield (r) is: r = rm/(1 – t)a. 4.00%b. 4.44%c. 5.00%d. 5.71%16.a.You would have to pay the asked price of:107:27 = 107.8438% of par = $1,074.438b.The coupon rate is 4.875%, implying coupon payments of $48.75 annuallyor, more precisely, $24.375 semiannually.c.Current yield = Annual coupon income/price =4.875/107.8438= 0.0452 = 4.52%17.a.The closing price today is $74.92, which is $1.82 below yesterday’s price.Therefore, yesterday’s closing price was: $74.92 + $1.82 = $76.74b.You could buy: $5,000/$74.92 = 66.74 sharesc.Your annual dividend income would be 1.90 % of $5,000, or $95.d.Earnings per share can be derived from the price-earnings (PE) ratio.Price/Earnings = 13 and Price = $74.92 so that Earnings = $74.92/13 =$5.763118.a.At t = 0, the value of the index is: (90 + 50 + 100)/3 = 80At t = 1, the value of the index is: (95 + 45 + 110)/3 = 83.3333The rate of return is: (83.3333/80) – 1 = 4.167%b.In the absence of a split, stock C would sell for 110, and the value of theindex would be: (95 + 45 + 110)/3 = 83.3333After the split, stock C sells at 55. Therefore, we need to set the divisor (d)such that:83.3333 = (95 + 45 + 55)/d…..d = 2.340c.The rate of return is zero. The index remains unchanged, as it should,since the return on each stock separately equals zero.19.a.Total market value at t = 0 is: (9,000 + 10,000 + 20,000) = 39,000Total market value at t = 1 is: (9,500 + 9,000 + 22,000) = 40,500Rate of return = (40,500/39,000) – 1 = 3.85%b.The return on each stock is as follows:R a = (95/90) – 1 = 0.0556R b = (45/50) – 1 = –0.10R c = (110/100) – 1 = 0.10The equally-weighted average is: [0.0556 + (-0.10) + 0.10]/3 =0.0185 = 1.85%20.The fund would require constant readjustment since every change in the price of astock would bring the fund asset allocation out of balance.21.It would increase by 19 points. (60 – 3) / 3 = 1922.Price3.4% x (87/360) = 0.8217% or a $ price of $10,000 x (1-.008217) = $9,917.83Equivalent Yield10,000 / 9,9917.83 = 1.0083 x 365/87 = 4.23%23.a.The higher coupon bondb.The call with the lower exercise pricec.The put on the lower priced stock24.a.The December maturity futures price is $5.116 per bushel. If the contractcloses at $5.25 per bushel in December, your profit / loss on each contract(for delivery of 5,000 bushels of corn) will be: ($5.25 - $5.116) x 5000 =$ 670 gain.b.There are 5114,099 contracts outstanding, representing 570,495,000bushels of corn.25.a.Yes. As long as the stock price at expiration exceeds the exercise price, itmakes sense to exercise the call.Gross profit is: $111 - $ 105 = $6Net profit = $6 – $ 22.40 = $16.40 lossRate of return = -16.40 / 22.40 = - .7321 or 73.21% lossb.Yes, exercise.Gross profit is: $111 - $ 100 = $11Net profit = $11 – $ 22.40 = $11.40 lossRate of return = -11.40 / 22.40 = 0.5089 or 50.89 % lossc. A put with exercise price $105 would expire worthless for any stock priceequal to or greater than $105. An investor in such a put would have a rateof return over the holding period of –100%.26.a.Long callb.Long putc.Short putd.Short call27.There is always a chance that the option will expire in the money. Investors willpay something for this chance of a positive payoff.28.Value of callInitial Cost Profitat expirationa. 0 4 -4b. 0 4 -4c. 0 4 -4d. 5 4 1e. 10 4 6Value of putInitial Cost Profitat expirationa. 10 6 4b. 5 6 -1c. 0 6 -6d. 0 6 -6e. 0 6 -629.The spread will widen. Deterioration of the economy increases credit risk, that is,the likelihood of default. Investors will demand a greater premium on debtsecurities subject to default risk.30.Eleven stocks have a 52 week high at least 150% above the 52 week low.Individual stocks are much more volatile than a group of stocks.31.The total before-tax income is $4. After the 70% exclusion, taxable income is:0.30 x $4 = $1.20Therefore:Taxes = 0.30 x $1.20 = $0.36After-tax income = $4 – $0.36 = $3.64After-tax rate of return = $3.64 / $40 = 9.10%32.A put option conveys the right to sell the underlying asset at the exercise price. Ashort position in a futures contract carries an obligation to sell the underlyingasset at the futures price.33.A call option conveys the right to buy the underlying asset at the exercise price.A long position in a futures contract carries an obligation to buy the underlyingasset at the futures price.CFA 1Answer: c。
博迪第八版投资学第十二章课后习题答案
博迪第八版投资学第十二章课后习题答案CHAPTER 12: BEHAVIORAL FINANCEAND TECHNICAL ANALYSISPROBLEM SETS1. Technical analysis can generally be viewed as a search for trends or patterns inmarket prices. Technical analysts tend to view these trends as momentum, orgrad ual adjustments to ‘correct’ prices, or, alternatively, reversals of trends. Anumber of the behavioral biases discussed in the chapter might contribute to such trends and patterns. For example, a conservatism bias might contribute to a trend in prices as investors gradually take new information in to account, resulting ingradual adjustment of prices towards their fundamental values. Another example derives from the concept of representativeness, which leads investors toinappropriately conclude, on the basis of a small sample of data, that a pattern has been established that will continue well in to the future. When investorssubsequently become aware of the fact that prices have overreacted, corrections reverse the initial erroneous trend.2. Even if many investors exhibit behavioral biases, security prices might still be setefficiently if the actions of arbitrageurs move prices to their intrinsic values.Arbitrageurs who observe mispricing in the securities markets would buyunderpriced securities (or possibly sell short overpriced securities) in order to profit from the anticipated subsequent changes as prices move to their intrinsic values.Consequently, securities prices would still exhibit the characteristics of an efficient market.3. One of the major factors limiting the ability of rational investors to take advantageof any ‘pricing errors’ that result from the actions of behavioral investors is the fact that a mispricing can get worse over time. An example of this fundamental risk is the apparent ongoing overpricing of the NASDAQ index in the late 1990s. A related factor is the inherent costs and limits related to short selling, which restrict theextent to which arbitrage can force overpriced securities (or indexes) to movetowards their fair values. Rational investors must also be aware of the risk that an apparent mispricing is, in fact, a consequence of model risk; that is, the perceived mispricing may not be real because the investor has used a faulty model to value the security.12-212-34.Two reasons why behavioral biases might not affect equilibrium asset prices are discussed in Quiz Problems (1) and (2) above: first, behavioral biases might contribute to the success of technical trading rules as prices gradually adjusttowards their intrinsic values, and; second, the actions of arbitrageurs might move security prices towards their intrinsic values. It might be important for investors to be aware of these biases because either of these scenarios might create the potential for excess profits even if behavioral biases do not affect equilibrium prices. 5.Efficient market advocates believe that publicly available information (and, for advocates of strong-form efficiency, even insider information) is, at any point in time, reflected in securities prices, and that price adjustments to new information occur very quickly. Consequently, prices are at fair levels so that activemanagement is very unlikely to improve performance above that of a broadly diversified index portfolio. In contrast, advocates of behavioral finance identify a number of investor errors in information processing and decision making that could result in mispricing of securities. However, the behavioral finance literaturegenerally does not provide guidance as to how these investor errors can be exploited to generate excess profits. Therefore, in the absence of any profitable alternatives, even if securities markets are not efficient, the optimal strategy might still be a passive indexing strategy.6.Trin =advancing Number /advancing Volume declining Number /declining Volume 978.0233,1/150,560,467068,2/460,901,766==This trin ratio, which is below 1.0, would be taken as a bullish signal. 7.Breadth: Advances Declines Net Advances 1,2332,068-835Breadth is negative. This is a bearish signal (although no one would actually use a one-day measure as in this example). 8. This exercise is left to the student; answers will vary.9.The confidence index increases from (7%/8%) = 0.875 to (8%/9%) = 0.889 This indicates slightly higher confidence. But the real reason for the increase in the index is the expectation of higher inflation, not higher confidence about the economy.10. At the beginning of the period, the price of Computers, Inc. divided by the industryindex was 0.39; by the end of the period, the ratio had increased to 0.50. As the ratio increased over the period, it appears that Computers, Inc. outperformed other firms in its industry. The overall trend, therefore, indicates relative strength, although some fluctuation existed during the period, with the ratio falling to a low point of0.33 on day 19.11. Five day moving averages:Days 1 – 5: (19.63 + 20 + 20.5 + 22 + 21.13) / 5 = 20.65Days 2 – 6 = 21.13Days 3 – 7 = 21.50Days 4 – 8 = 21.90Days 5 – 9 = 22.13Days 6 – 10 = 22.68Days 7 – 11 = 23.18Days 8 – 12 = 23.45 ← Sell signal (day 12 price < moving average)Days 9 – 13 = 23.38Days 10 – 14 = 23.15Days 11 – 15 = 22.50Days 12 – 16 = 21.65Days 13 – 17 = 20.95Days 14 – 18 = 20.28Days 15 – 19 = 19.38Days 16 – 20 = 19.05Days 17 – 21 = 18.93 ← Buy signal (day 21 price > moving average)Days 18 – 22 = 19.28Days 19 – 23 = 19.93Days 20 – 24 = 21.05Days 21 – 25 = 22.05Days 22 – 26 = 23.18Days 23 – 27 = 24.13Days 24 – 28 = 25.13Days 25 – 29 = 26.00Days 26 – 30 = 26.80Days 27 – 31 = 27.45Days 28 – 32 = 27.80Days 29 – 33 = 27.90 ← Sell signal (day 33 price < moving average)Days 30 – 34 = 28.20Days 31 – 35 = 28.45Days 32 – 36 = 28.65Days 33 – 37 = 29.05Days 34 – 38 = 29.25Days 35 – 39 = 29.00Days 36 – 40 = 28.7512-412-512. This pattern shows a lack of breadth. Even though the index is up, more stocksdeclined than advanced, which indicates a “lack of broad -based support” for the rise in the index. 13.Day Advances DeclinesNet Advances CumulativeBreadth1 906 704 202 202 2 653 986 -333 -131 3 721 789 - 68 -1994 503 968 -465 -664 5 497 1,095 -598 -1,2626 970 702 268 -9947 1,002 609 393 -6018 903 722 181 -4209 850 748 102 -318 10 766 766 0 -318The signal is bearish as cumulative breadth is negative; however, the negative number is declining in magnitude, indicative of improvement. Perhaps the worst of the bear market has passed.14. Trin =936.0906/million 330704/million 240advancing Number /advancing Volume declining Number /declining Volume ==This is a slightly bullish indicator, with average volume in advancing issues a bit greater than average volume in declining issues.15. Confidence Index =bondscorporate grade -te intermedia on Yield bondscorporate rated -on top YieldThis year: Confidence Index = (8%/10.5%) = 0.762 Last year: Confidence Index = (8.5%/10%) = 0.850Thus, the confidence index is decreasing.16. [Note: In order to create the 26-week moving average for the S&P 500, we firstconverted the weekly returns to weekly index values, using a base of 100 for the week prior to the first week of the data set. The graph on the next page shows the resulting S&P 500 values and the 26-week moving average, beginning with the 26th week of the data set.]a.The graph on the next page summarizes the data for the 26-week moving average. The graph also shows the values of the S&P 500 index.12-6S&P500 Index - 26-Week Moving Average0.0020.0040.0060.0080.00100.00120.0011/24/20001/24/20013/24/20015/24/20017/24/20019/24/200111/24/20011/24/20023/24/20025/24/20027/24/20029/24/200211/24/20021/24/20033/24/20035/24/20037/24/20039/24/200311/24/20031/24/20043/24/20045/24/20047/24/20049/24/200411/24/20041/24/20053/24/2005b. The S&P 500 crosses through its moving average from below fourteen times,as indicated in the table below. The index increases seven times in weeksfollowing a cross-through and decreases seven times.Date of cross-through Direction of S&P 500 in subsequentweek05/18/01 Decrease06/08/01 Decrease12/07/01 Decrease12/21/01 Increase03/01/02 Increase11/22/02 Increase01/03/03 Increase03/21/03 Decrease04/17/03 Increase06/10/04 Decrease09/03/04 Increase10/01/04 Decrease10/29/04 Increase04/08/05 Decreasec. The S&P 500 crosses through its moving average from above fourteen times,as indicated in the table below. The index increases nine times in weeksfollowing a cross-through and decreases five times.Date of cross-through Direction of S&P 500 in subsequentweek06/01/01 Increase06/15/01 Increase12/14/01 Increase02/08/02 Increase04/05/02 Decrease12/13/02 Increase01/24/03 Decrease03/28/03 Increase04/30/04 Decrease07/02/04 Decrease09/24/04 Increase10/15/04 Decrease03/24/05 Increase04/15/05 Increase12-7d. When the index crosses through its moving average from below, as in part (b)above, this is regarded as a bullish signal. However, in our sample, the index is as likely to increase as it is to decrease following such a signal. When the indexcrosses through its moving average from above, as in part (c), this is regarded asa bearish signal. In our sample, contrary to the bearish signal, the index isactually more likely to increase than it is to decrease following such a signal.12-817. [Note: In order to create the relative strength measure, we first converted theweekly returns for the Fidelity Banking Fund and for the S&P 500 to weekly index values, using a base of 100 for the week prior to the first week of the data set. The graph on the next page shows the resulting Fidelity Banking Fund values and the S&P 500 values, along with the Relative Strength measure (multiplied by 100). The graph on the following page shows the percentage change in the Relative Strength measure over 5-week intervals.]a. The graphs on the next two pages summarize the relative strength data for theFidelity Banking Fund.b. Over five-week intervals, relative strength increased by more than 5%twenty-nine times, as indicated in the table below. The Fidelity Banking Fundunderperformed the S&P 500 index eighteen times and outperformed the S&P500 index eleven times in weeks following an increase of more than 5%.Date of IncreasePerformance of Banking Fund in subsequent week07/21/00 Outperformed 08/04/00 Outperformed 08/11/00 Underperformed 08/18/00 Outperformed 09/22/00 Outperformed 09/29/00 Underperformed 10/06/00 Underperformed 12/01/00 Underperformed 12/22/00 Underperformed 12/29/00 Outperformed 01/05/01 Underperformed 01/12/01 Underperformed 02/16/01 Underperformed 02/23/01 Outperformed 03/02/01 Underperformed 03/09/01 Outperformed 03/16/01 Underperformed 03/30/01 Underperformed 06/22/01 Underperformed 08/17/01 Underperformed 03/15/02 Outperformed 03/22/02 Underperformed 03/28/02 Outperformed 04/05/02 Outperformed 04/12/02 Underperformed 04/26/02 Outperformed 05/03/02 Underperformed 05/10/02 Underperformed 06/28/02 Underperformed12-912-10Chapter 12 - Behavioral Finance and Technical Analysisc. Over five-week intervals, relative strength decreases by more than 5% fifteentimes, as indicated in the table below. The Fidelity Banking Fundunderperformed the S&P 500 index six times and outperformed the S&P 500 index nine times in weeks following a decrease of more than 5%.Date of DecreasePerformance of Banking Fund in subsequent week07/07/00 Underperformed07/14/00 Outperformed05/04/01 Underperformed05/11/01 Outperformed10/12/01 Outperformed11/02/01 Outperformed10/04/02 Outperformed10/11/02 Outperformed04/16/04 Underperformed04/23/04 Outperformed12/03/04 Outperformed12/10/04 Underperformed12/17/04 Outperformed12/23/04 Underperformed12/31/04 Underperformedd. An increase in relative strength, as in part (b) above, is regarded as a bullishsignal. However, in our sample, the Fidelity Banking Fund is more likely tounder perform the S&P 500 index than it is to outperform the index followingsuch a signal. A decrease in relative strength, as in part (c), is regarded as abearish signal. In our sample, contrary to the bearish signal, the FidelityBanking Fund is actually more likely to outperform the index increase than it isto under perform following such a signal.CFA PROBLEMS1. i. Mental accounting is best illustrated by Statement #3. Sampson’s requirementthat his income needs be met via interest income and stock dividends is anexample of mental accounting. Mental accounting holds that investorssegregate funds into mental accounts (e.g., dividends and capital gains),maintain a set of separate mental accounts, and do not combine outcomes; aloss in one account is treated separately from a loss in another account. Mentalaccounting leads to an investor preference for dividends over capital gains andto an inability or failure to consider total return.ii. Overconfidence(illusion of control) is best illustrated by Statement #6.Sampson’s desire to select investments that are inconsis tent with his overallstrategy indicates overconfidence. Overconfident individuals often exhibitrisk-seeking behavior. People are also more confident in the validity of theirconclusions than is justified by their success rate. Causes of overconfidenceinclude the illusion of control, self-enhancement tendencies, insensitivity topredictive accuracy, and misconceptions of chance processes.iii. Reference dependence is best illustrated by Statement #5. Sampson’s desire to retain poor performing investments and to take quick profits on successfulinvestments suggests reference dependence. Reference dependence holds thatinvestment decisions are critically dependent on the decision-maker’sreference point. In this case, the reference point is the original purchase price.Alternatives are evaluated not in terms of final outcomes but rather in terms ofgains and losses relative to this reference point. Thus, preferences aresusceptible to manipulation simply by changing the reference point.2. a. Frost's statement is an example of reference dependence. His inclination to sellthe international investments once prices return to the original cost depends notonly on the terminal wealth value, but also on where he is now, that is, hisreference point. This reference point, which is below the original cost, hasbecome a critical factor in Frost’s decision.In standard finance, alternatives are evaluated in terms of terminal wealth valuesor final outcomes, not in terms of gains and losses relative to some reference pointsuch as original cost.b. Frost’s statement is an example of susceptibility to cognitive error, in at leasttwo ways. First, he is displaying the behavioral flaw of overconfidence. Helikely is more confident about the validity of his conclusion than is justified byhis rate of success. He is very confident that the past performance of CountryXYZ indicates future performance. Behavioral investors could, and often do,conclude that a five-year record is ample evidence to suggest futureperformance. Second, by choosing to invest in the securities of only CountryXYZ, Frost is also exemplifying the behavioral finance phenomenon of assetsegregation. That is, he is evaluating Country XYZ investment in terms of itsanticipated gains or losses viewed in isolation.Individuals are typically more confident about the validity of their conclusionsthan is justified by their success rate or by the principles of standard finance,especially with regard to relevant time horizons. In standard finance, investorsknow that five years of returns on Country XYZ securities relative to all othermarkets provide little information about future performance. A standardfinance investor would not be fooled by this “law of small numbers.” Instandard finance, investors evaluate performance in portfolio terms, in thiscase defined by combining the Country XYZ holding with all other securitiesheld. Investments in Country XYZ, like all other potential investments, shouldbe evaluated in terms of the anticipated contribution to the risk- rewardprofile of the entire portfolio.c. Familiarity: Maclin is evaluating his holding of company stock based on hisfamiliarity with the company rather than on sound investment and portfolioprinciples. Company employees, because of this familiarity, may have adistorted perception of their own company, assuming a “good company” willalso be a good investment. Irrational investors believe an investment in acompany with which they are familiar will produce higher returns and have lessrisk than non-familiar investments.Representativeness: Maclin is confusing his company (which may well be a goodcompany) with the company’s stock (which may or may not be an appropriateholding for his portfolio and/or a good investment) and its future performance.This can result in employees’ overweighting their company stock, thereby holdingan under-diversified portfolio4. a. The behavioral finance principle of biased expectations/overconfidence is mostconsistent with the investor’s first statement. Petrie stock provides a level ofconfidence and comfort for the investor because of the circumstances in which sheacquired the stock and her recent history with the returns and income from thestock. However, the investor exhibits overconfidence in the stock given the needs ofthe Trust and the brevity of the recent performance history. Maintaining a 15percent position in a single stock is inconsistent with the overall strategy of the Trust,and the investor’s level of confidence should reflect the stock’s o verall record, notjust the past two years.b. The behavioral finance principle of mental accounting is most consistent withthe investor’s second statement. The investor has segregated the moniesdistributed from the Trust into two “accounts”: the return s the Trust receivesfrom the Petrie stock, and the remaining funds that the Trust receives for herbenefit. She is maintaining a separate set of mental accounts with regard to thetotal funds distributed. The investor’s “specific uses” should be viewed in theoverall context of the spending needs of the Trust and should consider the riskand return profile of the entire Trust.5. i. Overconfidence (Biased Expectations and Illusion of Control): Pierce is basing herinvestment strategy for supporting her parents on her confidence in the economicforecasts. This is a cognitive error reflecting overconfidence in the form of bothbiased expectations and an illusion of control. Pierce is likely more confident in thevalidity of those forecasts than is justified by the accuracy of prior forecasts.Analysts’ consensus forecasts have proven routinely and widely inaccurate. Piercealso appears to be overly confident that the recent performance of the Pogo Islandeconomy is a good indicator of future performance. Behavioral investors oftenconclude that a short track record is ample evidence to suggest futureperformance.Standard finance investors understand that individuals typically have greaterconfidence in the validity of their conclusions than is justified by their success rate.The calibration paradigm, which compares confidence to predictive ability,suggests that there is significantly lower probability of success than the confidence levels reported by individuals. In addition, standard finance investors know that recent performance provides little information about future performance and are not deceived by this “law of small numbers.”ii. Loss Aversion (Risk Seeking): Pierce is exhibiting risk aversion in deciding to sell the Core Bond Fund despite its gains and favorable prospects. She prefers a certaingain over a possibly larger gain coupled with a smaller chance of a loss. Pierce is exhibiting loss aversion (risk seeking) by holding the High Yield Bond Fund despite its uncertain prospects. She prefers the modest possibility of recovery coupled with the chance of a larger loss over a certain loss. People tend to exhibit risk seeking, rather than risk aversion, behavior when the probability of loss is large. There is considerable evidence indicating that risk aversion holds for gains and risk seeking behavior holds for losses, and that attitudes toward risk vary depending onparticular goals and circumstances.Standard finance investors are consistently risk averse, and systematically prefer a certain outcome over a gamble with the same expected value. Such investors also take a symmetrical view of gains and losses of the same magnitude, and theirsensitivity (aversion) to changes in value is not a function of a specified valuereference point.iii. Reference Dependence:Pierce’s inclination to sell her Small Company Fund once it returns to her original cost is an example of reference dependence. Hersell decision is predicated on the current value as related to original cost, herreference point. Her decision does not consider any analysis of expectedterminal value or the impact of this sale on her total portfolio. This referencepoint of original cost has become a critical but inappropriate factor in Pierce’sdecision.In standard finance, alternatives are evaluated in terms of terminal wealth values or final outcomes, not in terms of gains and losses relative to a reference point such as original cost. Standard finance investors also consider the risk and returnprofile of the entire portfolio rather than anticipated gains or losses on anyparticular investment or asset class.。
Essentials_Of_Investments_8th_Ed_Bodie_投资学精要(第八版)课后习题答案 Chapter 18
Байду номын сангаас
CHAPTER 18 PORTFOLIO PERFORMANCE EVALUATION
1. a. Possibly. Alpha alone does not determine which portfolio has a larger Sharpe ratio. Sharpe measure is the primary factor, since it tells us the real return per unit of risk. We only invest if the Sharpe measure is higher. The standard deviation of an investment and its correlation with the benchmark are also important. Thus positive alpha is not a sufficient condition for a managed portfolio to offer a higher Sharpe measure than the passive benchmark. b. Yes. It is possible for a positive alpha to exist, but the Sharpe measure decline. Thus, we would experience inferior performance. 2. Maybe. Provided the addition of funds creates an efficient frontier with the existing investments, and assuming the Sharpe measure increases, the answer is yes. Otherwise, no. 3. The M-squared is an equivalent representation of the Sharpe measure, with the added difference of providing a risk-adjusted measure of performance that can be easily interpreted as a differential return relative to a benchmark. Thus, it provides the same information as the Sharpe measure. But in a different format. 4. Definitely, the FF model. Research shows that passive investments (e.g., a market index portfolio) will appear to have a zero alpha when evaluated using the multi-index model but not using the single-index one. The nonzero alpha appears even in the absence of superior performance. Thus, the single-index alpha can be misleading. 5. a. Portfolio A Portfolio B Market index Risk-free asset E(r) 11% 14% 12% 6% 10% 31% 20% 0% 0.8 1.5 1.0 0.0
Essentials Of Investments 8th Ed Bodie 投资学精要(第八版)课后习题答案chap04
CHAPTER 04 MUTUAL FUNDS AND OTHER INVESTMENT COMPANIES 1.Mutual funds offer many benefits. Some of those benefits include the ability to investwith small amounts of money, diversification, professional management, lowtransaction costs, tax benefits, and reduce administrative functions.2.Close-end funds trade on the open market and are thus subject to market pricing. Open-end funds, are sold by the mutual fund and must reflect the NAV of the investments.3.Annual fees charged by a mutual fund to pay for marketing and distribution costs.4. A unit investment trust is an unmanaged mutual fund. Its portfolio is fixed and does notchange due to asset trades, as does a close-end fund. .5.Exchange-traded funds can be traded during the day, just as the stocks they represent.They are most tax effective, in that they do not have as many distributions. They also have much lower transaction costs. They also do not require load charges, management fees, and minimum investment amounts.6.Hedge funds have much less regulation since they are part of private partnerships andfree from mist SEC regulation. They permit investors to take on many risks unavailable to mutual funds. Hedge funds, however, may require higher fees and provide lesstransparency to investors. This offers significant counter party risk and hedge fundinvestors need to be more careful about the firm the invest with.7.An open-end fund will have higher fees since they are actively marketing and managingtheir investor base. The fund is always looking for new investors. A unit investment trust need not spend too much time on such matters since investors find each other.8.Asset allocation funds may dramatically vary the proportions allocated to each marketin accord with the portfolio manager’s forecast of the r elative performance of eachsector. Hence, these funds are engaged in market timing and are not designed to be low-risk investment vehicles.9.a. A unit investment trusts offer low costs and stable portfolios. Since they do notchange their portfolio, the investor knows exactly what they own. They are better suited to sophisticated investors.b. Open-end mutual funds offer higher levels of service to investors. The investors donot have any administrative burdens and their money is actively managed. This is better suited for less knowledgeable investors.c. Individual securities offer the most sophisticated investors ultimate flexibility. Theyare able to save money since they are only charged the expenses they incur. Alldecisions are under the control of the investor.10. Open-end funds must honor redemptions and receive deposits from investors. This flowof money necessitates retaining cash. Close-end funds no longer take and receivemoney from investors. As such, they are free to be fully invested at all times.11. The offering price includes a 6% front-end load, or sales commission, meaning thatevery dollar paid results in only $0.94 going toward purchase of shares. Therefore: Offering price =06.0170.10$load 1NAV -=-= = $11.3812. NAV = offering price ⨯ (1 – load) = $12.30 ⨯ 0.95 = $11.6913. HW14. Value of stocks sold and replaced = $15,000,000Turnover rate = 000,000,42$000,000,15$= 0.357 = 35.7%15.a. NAV =million5million 3$million 200$-= $39.40b. Premium (or discount) = NAV NAV ice Pr - = 40.39$40.39$36$-= –0.086 = -8.6% The fund sells at an 8.6% discount from NAV16. Rate of return = NAV year of Start ons Distributi )NAV (+∆ = 50.12$50.1$40.0$+-= 0.0880 = 8.80%17.HW18.Assume a hypothetical investment of $100.Loaded upa. Year 1 = 100 x (1+.06-.0175) = 104.25b. Year 3 = 100 x (1+.06-.0175)^3 = 116.30c. Year 10 = 100 x (1+.06-.0175)^10 = 151.62Economy funda. Year 1 = 100 x .98 x (1+.06-.0025) = 103.64b. Year 3 = 100 x .98 x (1+.06-.0025) ^ 3 = 115.90c. Year 10 = 100 x .98 x (1+.06-.0025) ^ 10 = 171.4119.NAVa. (450,000,000 – 10,000,000) / 44,000,000 = $10 per shareb. (440,000,000 – 10,000,000) / 43,000,000 = $10 per share20.a.Empirical research indicates that past performance of mutual funds is not highlypredictive of future performance, especially for better-performing funds. Whilethere may be some tendency for the fund to be an above average performer nextyear, it is unlikely to once again be a top 10% performer.b.On the other hand, the evidence is more suggestive of a tendency for poorperformance to persist. This tendency is probably related to fund costs andturnover rates. Thus if the fund is among the poorest performers, investorswould be concerned that the poor performance will persist.21. Start of year NAV = $20Dividends per share = $0.20End of year NAV is based on the 8% price gain, less the 1% 12b-1 fee:End of year NAV = $20 ⨯ 1.08 ⨯ (1 – 0.01) = $21.384 Rate of return =20$20.0$20$384.21$+-= 0.0792 = 7.92%22. The excess of purchases over sales must be due to new inflows into the fund. Therefore,$400 million of stock previously held by the fund was replaced by new holdings. So turnover is: $400/$2,200 = 0.182 = 18.2%23. Fees paid to investment managers were: 0.007 ⨯ $2.2 billion = $15.4 millionSince the total expense ratio was 1.1% and the management fee was 0.7%, we conclude that 0.4% must be for other expenses. Therefore, other administrative expenses were: 0.004 ⨯ $2.2 billion = $8.8 million24. As an initial approximation, your return equals the return on the shares minus the totalof the expense ratio and purchase costs: 12% - 1.2% - 4% = 6.8%But the precise return is less than this because the 4% load is paid up front, not at the end of the year.To purchase the shares, you would have had to invest: $20,000/(1 - 0.04) = $20,833The shares increase in value from $20,000 to: $20,000 ⨯ (1.12 - 0.012) = $22,160 The rate of return is: ($22,160 - $20,833)/$20,833 = 6.37%25. Suppose you have $1000 to invest. The initial investment in Class A shares is $940 netof the front-end load. After 4 years, your portfolio will be worth:$940 ⨯ (1.10)4 = $1,376.25Class B shares allow you to invest the full $1,000, but your investmentperformance net of 12b-1 fees will be only 9.5%, and you will pay a 1% back-endload fee if you sell after 4 years. Your portfolio value after 4 years will be:$1,000 ⨯ (1.095)4 = $1,437.66After paying the back-end load fee, your portfolio value will be:$1,437.66 ⨯ 0.99 = $1,423.28Class B shares are the better choice if your horizon is 4 years. With a 15-year horizon, the Class A shares will be worth:$940 ⨯ (1.10)15 = $3,926.61For the Class B shares, there is no back-end load in this case since the horizon is greater than 5 years. Therefore, the value of the Class B shares will be:$1,000 ⨯ (1.095)15 = $3,901.32At this longer horizon, Class B shares are no longer the better choice. The effect of Class B's 0.5% 12b-1 fees cumulates over time and finally overwhelms the 6% load charged to Class A investors.26. For the bond fund, the fraction of portfolio income given up to fees is:%0.4%6.0= 0.150 = 15.0%For the equity fund, the fraction of investment earnings given up to fees is:%0.12%6.0= 0.050 = 5.0%Fees are a much higher fraction of expected earnings for the bond fund, and therefore may be a more important factor in selecting the bond fund. This may help to explain why unmanaged unit investment trusts are concentrated inthe fixed income market. The advantages of unit investment trusts are low turnover and low trading costs and management fees. This is a more important concern to bond-market investors.27.a. After two years, each dollar invested in a fund with a 4% load and a portfolioreturn equal to r will grow to:$0.96 ⨯ (1 + r – 0.005)2Each dollar invested in the bank CD will grow to:$1 ⨯ (1.06)2If the mutual fund is to be the better investment, then the portfolio return, r,must satisfy:0.96 ⨯ (1 + r – 0.005)2 > (1.06)20.96 ⨯ (1 + r – 0.005)2 > 1.1236(1 + r – 0.005)2 > 1.1704 1 + r – 0.005 > 1.08191 + r > 1.0869Therefore, r > 0.0869 = 8.69%b.If you invest for six years, then the portfolio return must satisfy:0.96 ⨯ (1 + r – 0.005)6 > (1.06)6 = 1.4185(1 + r – 0.005)6 > 1.47761 + r – 0.005 > 1.06721 + r > 1.0722r > 7.22%The cutoff rate of return is lower for the six year investment because the "fixedcost" (i.e., the one-time front-end load) is spread out over a greater number ofyears.c.With a 12b-1 fee instead of a front-end load, the portfolio must earn a rate ofreturn (r) that satisfies:1 + r – 0.005 – 0.0075 > 1.06In this case, r must exceed 7.25% regardless of the investment horizon.28.The turnover rate is 50%. This means that, on average, 50% of the portfolio is sold andreplaced with other securities each year. Trading costs on the sell orders are 0.4%; and the buy orders to replace those securities entail another 0.4% in trading costs. Total trading costs will reduce portfolio returns by: 2 ⨯ 0.4% ⨯ 0.50 = 0.4%29.Suppose that finishing in the top half of all portfolio managers is purely luck, and thatthe probability of doing so in any year is exactly ½. Then the probability that anyparticular manager would finish in the top half of the sample five years in a row is (½)5 = 1/32. We would then expect to find that [350 ⨯ (1/32)] = 11 managers finish in the top half for each of the five consecutive years. This is precisely what we found. Thus, we should not conclude that the consistent performance after five years is proof of skill.We would expect to find eleven managers exhibiting precisely this level of"consistency" even if performance is due solely to luck.。
- 1、下载文档前请自行甄别文档内容的完整性,平台不提供额外的编辑、内容补充、找答案等附加服务。
- 2、"仅部分预览"的文档,不可在线预览部分如存在完整性等问题,可反馈申请退款(可完整预览的文档不适用该条件!)。
- 3、如文档侵犯您的权益,请联系客服反馈,我们会尽快为您处理(人工客服工作时间:9:00-18:30)。
CHAPTER 02 ASSET CLASSES AND FINANCIAL INSTRUMENTS mon stock is an ownership share in a publicly held corporation. Commonshareholders have voting rights and may receive dividends. Preferred stockrepresents nonvoting shares in a corporation, usually paying a fixed stream ofdividends. While corporate bonds are long-term debt by corporations, typically paying semi-annual coupons and returning the face value of the bond at maturity.2.While the DJIA has 30 large corporations in the index, it does not represent theoverall market nearly as well as the 500 stocks contained in The Wilshire index.The DJIA is simply too small.3.They are short term, very safe, and highly liquid. Also, their unit value almostnever changes.4.Treasury bills, certificates of d eposit, commercial paper, bankers’ acceptances,Eurodollars, repos, reserves, federal funds and brokers’ calls.5.American Depository Receipts, or ADRs, are certificates traded in U.S. marketsthat represent ownership in shares of a foreign company. Investors may alsopurchase shares of foreign companies on foreign exchanges. Lastly, investors may use international mutual funds to own shares indirectly.6.Because they produce coupons that are tax free.7.The fed funds rate is simply the rate of interest on very short-term loans amongfinancial institutions. The London Interbank Offer Rate (LIBOR) is the rate at which large banks in London are willing to lend money among themselves.8.General obligation bonds are backed by the local governments, while revenuebonds have proceeds attached to specific projects. A revenue bond has lessguarantees, therefore, it is riskier and will have a higher yield.9.Corporations may exclude 70% of dividends received from domestic corporationsin the computation of their taxable income.10.Limited liability means that the most shareholders can lose in event of the failureof the corporation is their original investment.11.Money market securities are referred to as “cash equivalents” because of theirgreat liquidity. The prices of money market securities are very stable, and they can be converted to cash (i.e., sold) on very short notice and with very lowtransaction costs.12.Taxable equivalent yield = .0675 / (1-.35) = .103813.a.The taxable bond. With a zero tax bracket, the after-tax yield for thetaxable bond is the same as the before-tax yield (5%), which is greaterthan the yield on the municipal bond.b.The taxable bond. The after-tax yield for the taxable bond is:0.05 x (1 – 0.10) = 4.5%c.You are indifferent. The after-tax yield for the taxable bond is:0.05 x (1 – 0.20) = 4.0%The after-tax yield is the same as that of the municipal bond.d.The municipal bond offers the higher after-tax yield for investors in taxbrackets above 20%.14.The after-tax yield on the corporate bonds is: [0.09 x (1 – 0.30)] = 0.0630 =6.30%. Therefore, the municipals must offer at least 6.30% yields.15.The equivalent taxable yield (r) is: r = rm/(1 – t)a. 4.00%b. 4.44%c. 5.00%d. 5.71%16.a.You would have to pay the asked price of:107:27 = 107.8438% of par = $1,074.438b.The coupon rate is 4.875%, implying coupon payments of $48.75 annuallyor, more precisely, $24.375 semiannually.c.Current yield = Annual coupon income/price =4.875/107.8438= 0.0452 = 4.52%17.a.The closing price today is $74.92, which is $1.82 below yesterday’s price.Therefore, yesterday’s closing price was: $74.92 + $1.82 = $76.74b.You could buy: $5,000/$74.92 = 66.74 sharesc.Your annual dividend income would be 1.90 % of $5,000, or $95.d.Earnings per share can be derived from the price-earnings (PE) ratio.Price/Earnings = 13 and Price = $74.92 so that Earnings = $74.92/13 =$5.763118.a.At t = 0, the value of the index is: (90 + 50 + 100)/3 = 80At t = 1, the value of the index is: (95 + 45 + 110)/3 = 83.3333The rate of return is: (83.3333/80) – 1 = 4.167%b.In the absence of a split, stock C would sell for 110, and the value of theindex would be: (95 + 45 + 110)/3 = 83.3333After the split, stock C sells at 55. Therefore, we need to set the divisor (d)such that:83.3333 = (95 + 45 + 55)/d…..d = 2.340c.The rate of return is zero. The index remains unchanged, as it should,since the return on each stock separately equals zero.19.a.Total market value at t = 0 is: (9,000 + 10,000 + 20,000) = 39,000Total market value at t = 1 is: (9,500 + 9,000 + 22,000) = 40,500Rate of return = (40,500/39,000) – 1 = 3.85%b.The return on each stock is as follows:R a = (95/90) – 1 = 0.0556R b = (45/50) – 1 = –0.10R c = (110/100) – 1 = 0.10The equally-weighted average is: [0.0556 + (-0.10) + 0.10]/3 =0.0185 = 1.85%20.The fund would require constant readjustment since every change in the price of astock would bring the fund asset allocation out of balance.21.It would increase by 19 points. (60 – 3) / 3 = 1922.Price3.4% x (87/360) = 0.8217% or a $ price of $10,000 x (1-.008217) = $9,917.83Equivalent Yield10,000 / 9,9917.83 = 1.0083 x 365/87 = 4.23%23.a.The higher coupon bondb.The call with the lower exercise pricec.The put on the lower priced stock24.a.The December maturity futures price is $5.116 per bushel. If the contractcloses at $5.25 per bushel in December, your profit / loss on each contract(for delivery of 5,000 bushels of corn) will be: ($5.25 - $5.116) x 5000 =$ 670 gain.b.There are 5114,099 contracts outstanding, representing 570,495,000bushels of corn.25.a.Yes. As long as the stock price at expiration exceeds the exercise price, itmakes sense to exercise the call.Gross profit is: $111 - $ 105 = $6Net profit = $6 – $ 22.40 = $16.40 lossRate of return = -16.40 / 22.40 = - .7321 or 73.21% lossb.Yes, exercise.Gross profit is: $111 - $ 100 = $11Net profit = $11 – $ 22.40 = $11.40 lossRate of return = -11.40 / 22.40 = 0.5089 or 50.89 % lossc. A put with exercise price $105 would expire worthless for any stock priceequal to or greater than $105. An investor in such a put would have a rateof return over the holding period of –100%.26.a.Long callb.Long putc.Short putd.Short call27.There is always a chance that the option will expire in the money. Investors willpay something for this chance of a positive payoff.28.Value of callInitial Cost Profitat expirationa. 0 4 -4b. 0 4 -4c. 0 4 -4d. 5 4 1e. 10 4 6Value of putInitial Cost Profitat expirationa. 10 6 4b. 5 6 -1c. 0 6 -6d. 0 6 -6e. 0 6 -629.The spread will widen. Deterioration of the economy increases credit risk, that is,the likelihood of default. Investors will demand a greater premium on debtsecurities subject to default risk.30.Eleven stocks have a 52 week high at least 150% above the 52 week low.Individual stocks are much more volatile than a group of stocks.31.The total before-tax income is $4. After the 70% exclusion, taxable income is:0.30 x $4 = $1.20Therefore:Taxes = 0.30 x $1.20 = $0.36After-tax income = $4 – $0.36 = $3.64After-tax rate of return = $3.64 / $40 = 9.10%32.A put option conveys the right to sell the underlying asset at the exercise price. Ashort position in a futures contract carries an obligation to sell the underlyingasset at the futures price.33.A call option conveys the right to buy the underlying asset at the exercise price.A long position in a futures contract carries an obligation to buy the underlyingasset at the futures price.CFA 1Answer: c。