ArcGis导入EXCEL数据
ArcGIS工具箱功能实现由Excel坐标表自动生成点、线、面图层的方法
ArcGIS工具箱功(toolbox)实现由Excel坐标表生成点、线、面图层的方法一、由Excel坐标表生成点图层要求格式:Excel表的第一列为点号,接着两列为X、Y坐标,表格第一行最好为ID、X、Y二、导入ARCGIS点击tools——Add XY Date,选择表格、坐标系即生成点图层。
三、保存点图层文件在ArcGIS左边的文件框中选择Sheet1$ Events文件点右键——Date——Export Date,再点ok即可生成点图层。
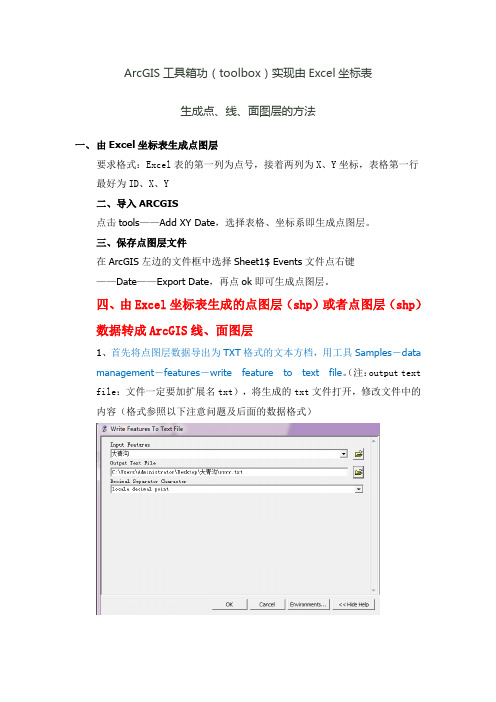
四、由Excel坐标表生成的点图层(shp)或者点图层(shp)数据转成ArcGIS线、面图层1、首先将点图层数据导出为TXT格式的文本方档,用工具Samples-datamanagement-features-write feature to text file。
(注:output text file:文件一定要加扩展名txt),将生成的txt文件打开,修改文件中的内容(格式参照以下注意问题及后面的数据格式)2、打开ARCGIS,点击ARCGIS工具箱,找到Samples-data management -features-creat feature from text file,各参数设置参照注意问题及数据格式。
ARCGIS中用数据生成线及面要注意的问题:Samples-data management-features-creat feature from text file Input decimal separator中在英文状态下输入12345678.12345或者11111111.11111也可以是其他,但不能使用空格。
数据格式:1、Polyline后面不能有空格;(如果要生成面,将Polyline改成Polygon)2、数据间的空格间隔只能是一个字符;3、生成线的每一点要按顺序排列,按不同顺序排列会生成不同的图像;4、第一个点的序号从0开始编号;5、若要生成多条线,对每条线要编号;且要符合上述的要求,每条线的点重新从0开始编号;6、最后一行要加上END;7、将数据从EXCEL表中导出成TXT格式后,按上述要求调整好数据格式,新建一个TXT文档,将数据复制到新建的文档当中。
arcgis属性表与excel建立连接
一:arcgis属性表与excel建立连接:
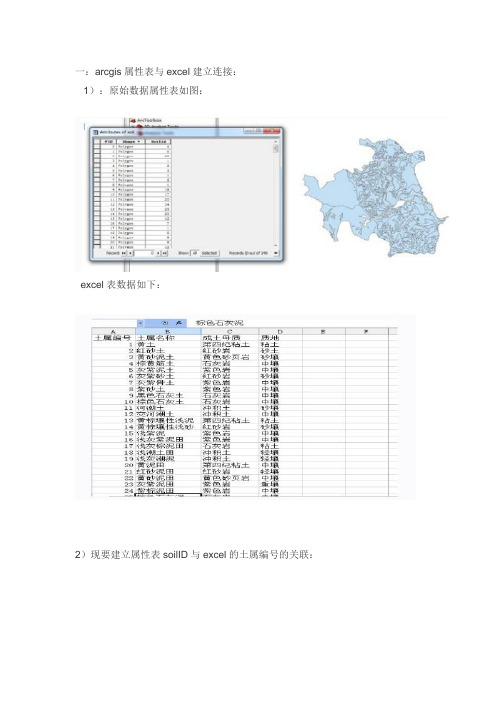
1):原始数据属性表如图:
excel表数据如下:
2)现要建立属性表soilID与excel的土属编号的关联:
打开连接表:并如下操作:
在1处选择属性表连接字段,2处选择excel表所在的sheet,3处选择excel 表中连接字段
完后单击OK。
结果如图:
二:对连接进来的属性进行修改:
当启动编辑时会发现添加进来的字段不能编辑,很正常,因为添加进来的字段属于excel表,不属于属性表,当然不能编辑了,基于这,我想可以把excel的字段转化为属性表的字段。
(直接导出数据就可了,不能编辑状态链接excel表的情况下导出新的shp文件,下面的做法可不管)
具体做法是添加一个字段,使其字段类型和excel字段类型一致,然后启用Field Calculator,如下图:
这样excel表字段就会添加到属性表里,如此把所有字段添加进来,然后移除连接,再启动编辑就可以对所有字段进行编辑。
三:属性表导出为Excel,
可以先导出为dbf文件,再转化为Excel,但是我没安装Access,如是采用另一种方法:
先在属性表里,将属性表导出为txt文件。
下面就可以在Excel中操作了,进入导入数据向导,找到刚导出的txt,一直下一步,直到下面选择分隔符时:
然后一直下一步,直到完成OK。
把电子表格的数据导入到arcgis中
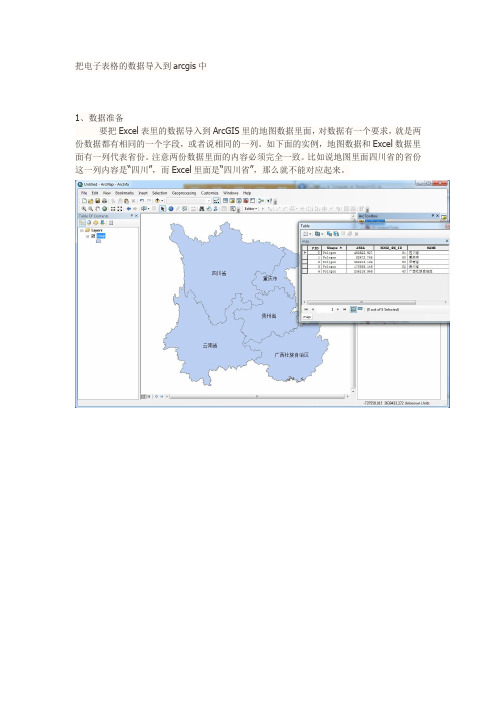
把电子表格的数据导入到arcgis中1、数据准备要把Excel表里的数据导入到ArcGIS里的地图数据里面,对数据有一个要求,就是两份数据都有相同的一个字段,或者说相同的一列。
如下面的实例,地图数据和Excel数据里面有一列代表省份。
注意两份数据里面的内容必须完全一致。
比如说地图里面四川省的省份这一列内容是“四川”,而Excel里面是“四川省”,那么就不能对应起来。
2、把Excel数据加载到ArcGIS里面使用的按钮和加载地图数据的按钮是一样的(“+”号图案的)。
有一点要注意到是选择加载文件看到Excel表的时候,这时候要在里面双击Excel表,不要直接点下面的加载。
这样打开Excel表里面的列表,选择Sheet1然后加载进来即可。
如果数据放在不同的Sheet 里面,则选择对应的Sheet就行了。
这样Excel表数据就加载进来了。
3、联合属性表在左边的TOC面板中选择右键地图数据,然后使用"Join and Relates"-"Join"工具,打开对话框。
在打开的对话框里面选择要Join的表,并选择相对应的字段。
这里地图数据使用的是“NAME"字段,Excel数据选择的是"省份"字段,因为它们含有相同的内容.点击OK,然后再打开地图数据的属性表就可以看到Excel数据已经导入到ArcGIS地图数据里面了.4、导出地图数据因为Join后的属性表只保存在内存中,要是关掉程序再打开地图数据,Excel里的数据又没有了。
所以需要将地图数据导出保存。
方法也是在地图数据上右键,选择Data-Export Data,选择保存位置即可。
加载刚保存的数据,这时候Excel里的数据就已经导入到地图数据里面了。
在ArcGIS中应用EXCEL表格数据

在ArcGIS中应用EXCEL表格数据48 ArcUser January–March 2004Working With Excel in ArcGISBy Monica Pratt, ArcUser EditorArcGIS works well with Microsoft Excel, the spreadsheet component of Microsoft Office. Data can be shared back and forth between these two programs in a variety of ways. Data that has been created or is being maintained in Excel can be directly accessed by ArcGIS through a con-nection created in ArcCatalog. Joining or relating Excel tables with attribute tables for spatial data provides additional information. Excel can be used as a tool for quickly editing attribute tables.GIS users also take advantage of the extensive table functionality and many formulas that are built into Excel. Finally, existing charts and tables can also be inserted into ArcMap layouts without reformatting.Connect to anExcel Spreadsheet in ArcCatalogArcGIS can directly access data in Excel files. A simple, three-step procedure sets up this connec-tion. First, create an Open Database Connectivity (ODBC data source in Windows, then reformat the data in Excel, and finally connect to the Excel file in ArcCatalog.Create an ODBC Data Source1. In Windows 2000, choose Start > Programs > Administrative Tools > Data Sources. (For other Windows versions, consult Windows online help for creating an ODBC data source.2. In the ODBC Data Source Administrator dialog box, click the User DSN tab and click the Add button.3. Select Microsoft Excel Driver (*.xls and click the Finish button.4. In the ODBC Microsoft Excel Setup dialog box, type a name and description for the data source. Click the Select Workbook button and navigate to the location of the Excel data file and select it.5. Click OK twice to exit the dialog boxes.Reformat Data1. Start Excel and open the desired spreadsheet (.xls file.2. Select the data in the spreadsheet that will be displayed in ArcGIS.3. Choose Insert > Name > Define and type a name for the selected cells. This name will appear in the tables list when the OLE DB Connection is expanded in ArcCatalog or ArcMap.4. Save the file and quit Excel.Connect to the Excel File From ArcCatalog 1. Start ArcCatalog. Expand Database Connec-tions, and click Add OLE DB Connection.2. Select Microsoft OLE DB Provider for ODBC Drivers.3. Click the User Data Source Name button and select the .xls file just named in the previous step from the drop-down list. It may be necessary to use the Refresh button.4. Click the Test Connection button to verify the connection works. A message box should con-firm the connection has succeeded. Click OK. Now the Excel table can be accessed and previewed in ArcCatalog and added directly to amap document in ArcMap by choosing OLE DB Connection.odc.Using Excel WithShapefile Attribute T ablesIn addition to serving as a direct data source, Ex-cel tables can be joined to attribute tables to en-hance the information available for map features. Exporting an attribute file and opening it in Excel makes Excelʼs wide array of formulas, functions, and formatting tools available for quickly editing the table. The file can be saved and rejoined to the spatial file.Enhancing Spatial DataA nonspatial table created in Excel can be joined or related to a layerʼs attribute table if a common field exists or can be created. Use join when the relationship between items in the two tables is one-to-one or many-to-one. Use relate for relationships that are one-to-many and many-to-many. Note that if a relate is used instead of a join, although these new attributes can be que-ried, they cannot be used to set layer properties (i.e., symbolize the data.ArcGIS uses the Microsoft ODBC Text driver for text files. This driver stores a data de-scription of the text fileʼs schema in a file called schema.ini. This file is automatically generated when a text file is opened in ArcGIS and resides in the same directory as the text file.By default, ArcGIS treats files with .txt, .asc, or .csv extensions as comma-delimited text files. Files with a .tab extension are treated as tab-delimited text files. If a .txt or .asc file uses a delimiter other than a comma, the data will not be interpreted correctly. Although the schema.ini file can be manually edited to use a delimiter other than a comma, it is usually less trouble to use a comma-delimited format with the .csv extension for importing tables from Excel.Even though Excel can save files in dBASE (.dbf format, .csv can often be the best choice owing to some idiosyncrasies in the way differ-ent versions of Excel save to the DBF format. When saving data from Excel, numeric fields will be truncated to integers unless the format for that column has been set to include the correct number of decimal places. If a range of cells in the spreadsheet is selected, only that range will be exported.Make sure that the first row in the spreadsheet joined contains field headings. These headings can be no longer than 10 characters; can contain letters and numbers but must begin with a let-ter; and should not incorporate dashes, spaces, or brackets. Replace dashes withunderscores,In the ODBC Data Source Administrator dialog box, click the User DSN tab and clickthe Add button.In the ODBC Microsoft Excel Setup dialog box, type a name and description for the data source. Click the Select Workbook button and navigate to the location of the Excel data fileand select it.Start ArcCatalog. Expand Database Connec-tions and click Add OLE DB Connection.ArcUser January–March 2004 49Hands OnExamine both the Excel table to be joined and the target spatial data to determine thatthey share a common field.Use Join functionality in ArcMap to append the Excel data to the attribute data.The demographic data joined from the Excel table can now be used for analysis and symbolization.and otherwise edit field names so they conform to these guidelines. Each field can contain only one type of data. Consequently, a numeric field should never contain the word NONE or another text string. Use the following procedure to join Excel data with attribute data already in an ArcMap document.1. Examine both the Excel table to be joined and the target spatial data to determine that they share a common field. This field could be a text field such as a county name or a coded numeric field such as a FIPS field (i.e., Federal Information Processing Standards code. Sometimes a com-mon field can be created through concatenating two fields into a new field.2. In Excel, verify that the field (column head-ings conform to naming guidelines required by ArcGIS as described previously. Choose File > Save As and scroll down to CSV (comma-de-limited (*.csv and name and save the file. Click Y es twice to save only the active worksheet and reaffirm the CSV format. Close the file and close Excel.3. Activate or open ArcMap. Click the Add Data button and navigate to the location of the CSV file and select it. ArcMap will display the new table on the Source Tab of the Table of Contents.4. In the Table of Contents, right-click on the spa-tial layer that will be joined with the Excel data and select Join from the context menu.5. In the Join Data dialog box, choose Join At-tributes from a Table. In the first section, click the drop-down box and choose the field from the attribute table that will be used for the join. In the second section, click on the Browse but-ton and navigate to the location of the table to be joined and select it. In the third section, click on the drop-down box and select the field on which the join will be based. Click OK.Right-click on the spatial layer and choose Open Attribute Table from the context menu. The attributes of the t able will be appended to this layerʼs attribute table. Joins can be removedsimply by right-clicking on the spatial layer and choosing Joins > Remove Joins. Joined columns cannot be edited directly, but editing the columns in the original table will change the joined col-umns.Data in individual joined columns canʼt be ed-ited directly. However, editing data in the original table (if it has been added to the map will effect the same changes in the joined columns. To elim-inate this problem, make the join permanent by exporting the data to a new dataset. Right-click on the layer and choose Data > Export Data. Quickly Editing T ablesArcGIS will not allow changes to the type or name of an existing column in an attribute table. However, because attribute tables can be traded back and forth between Excel and ArcGIS with relative ease, attribute tables can be exported out of ArcGIS; brought into Excel; and quickly edited to change data types, aggregate fields, or perform other tasks; then joined with the original table.Note that a shapefileʼs FID and Shape col-umns and a dBASE tableʼs OID column canʼt be deleted. Do not edit these fields. When accessing a tableʼs contents, ArcGIS creates a virtual col-umn, the OID column, to ensure that each record has at least one unique value. Every table needs one column in addition to the Shape and FID or OID columns. Use the following procedure to export an attribute table, edit the table, and join it back to the original attribute file.1. Right-click on the layer containing the table to be edited and choose Open Attribute Table.2. In the table, click on the Options button and choose Export from the menu.3. Navigate to a folder to save the table, name the table, and save it as a DBF file. Donʼt add it back to the map.4. Start Excel and open the DBF file just export-ed. Make the desired changes such as calculating fields or changing field formats.5. Delete all fields that were not modified exceptContinued on page 5050 ArcUser January–March 2004Working With Excel in ArcGISContinued from page 49After selecting the chart or table cells in Excel and activate ArcMap. Choose Insert > Object, click on Create from File, and navi-gate to the location of the Excel file. Although only one object, either a table or chart, can be added per Excel file, multiple objects can be added to a layout if they originate from multiple Excel files.the field that will be used to join the table back to the attribute table.6. Choose File > Save and save as a DBF file. Click Y es to keep out incapable features and con-firm the DBF format. Close Excel.7. Follow steps 3 through 5 in the previous sec-tion to join the modified DBF table to the layerʼs attribute table.Insert Excel T able or Chart Into a Layout ArcGIS can generate formatted tables and a vari-ety of charts. However, the table or chart desired for a layout may already exist as an Excel file. In addition, Excel tables can use more descriptive field headings. Because ArcGIS supports interop-erability, Excel tables and charts can be inserted directly into an ArcGIS layout, eliminating the need to re-create either.Although tables and charts created in Excel can be pasted directly into an ArcMap layout, inserting them has the advantage of maintaining a dynamic link with Excel. With this link, edits made in Excel to a chart or table are reflected in ArcMap. Note that changes made in Excel should always be saved. Unsaved changes may disrupt the linkage between Excel and ArcGIS.1. Open the Excel file containing the desired chart or table data.2. Click on the chart area so that the handles (eight black resizing blocks appear around the chart area, or select the cells in the worksheet page that will be used in the table. Leave the chart or worksheet area selected in Excel, but start ArcMap and choose the Layout View.3. In ArcMap, choose Insert > Object and select Create from File. Click the Browse button and go to the location of the open Excel file and select it.4. In the Insert Object dialog box, check the Link box and click OK.Resize the chart or table appropriately using the frame handles. Tables will come in without a background, but this can be remedied by using the Drawing tools in ArcGIS to create a colored box and placing the box behind the table in the layout. Only one object per Excel file can be inserted in this way. However, objects from multiple Excel files may be inserted in the same layout.ConclusionArcGIS offers flexible methods for working with non-GIS software applications. Take advantage of the interoperability of Excel and ArcGIS tospeed tasks, exploit the sophisticated table func-tionality in Excel, and avoid needless reformat-ting and/or data conversion.在用Excel录入完大量数据后,不可避免地会产生许多错误。
ArcGis导入EXCEL数据

ArcGis导⼊EXCEL数据ArcGis导⼊EXCEL数据在arccatalog⾥⾯选Database Connections(滚动条拉到最下⾯就可以看到),双击Add OLE DB Connection再选Microsoft OLE DB Provider for ODBC Drivers这⼀项,点下⼀步,然后在“使⽤的数据源名称”这⼀栏选excel files,点确定,然后在arccatalog⾥⾯就可以看到EXCLE⽂件了第⼆种解释:ArcGIS操作全记录之属性关联(⼀)当你默默地⼀单元格⼀个单元格地为图形输⼊属性的时候,其他⼈正在⽤⾼效的⽅式解决问题!(不是说你傻,虽然你就是)基于属性的关联操作流程:ArcGIS->windows->table of content(TOC)->图层名右键jion⼯具或Arctoolbox->data management tools->joins->add join注:关联只是临时的,图层关闭后不会保存关联上的属性,但你可以点击图层右键data->export导出为⼀个新层1. 建⽴关键字要将属性表(如excel表)中关联到图形中,⾸先要建⽴图形与属性之间的⼀⼀对应关系,所谓⼀⼀对应并不是要求图形有多少块属性记录就要有多少条,⽽是要求关联所依据的字段能够唯⼀标识图形和属性记录,例如,如果你想通过“编号”字段实现图形属性的关联,编号为A002图形只能有⼀个,同样属性记录“编号”字段中A002也只能出现⼀次(如果图形中有⼀个A002,⽽属性记录中有多个A002,在属性表中第⼀次出现的A002记录将会被关联),要实现这⼀⽬的,你⾸先需要检测拟关联字段是不是具有唯⼀标识码的特征,检测过程可以通过excel的“数据透视表”功能和ArcGIS的属性表“summarize”⼯具实现,其实就是统计下它出现的次数,出现⼀次的就是正常的。
Mapgis中将属性导出到Excel中的基本步骤
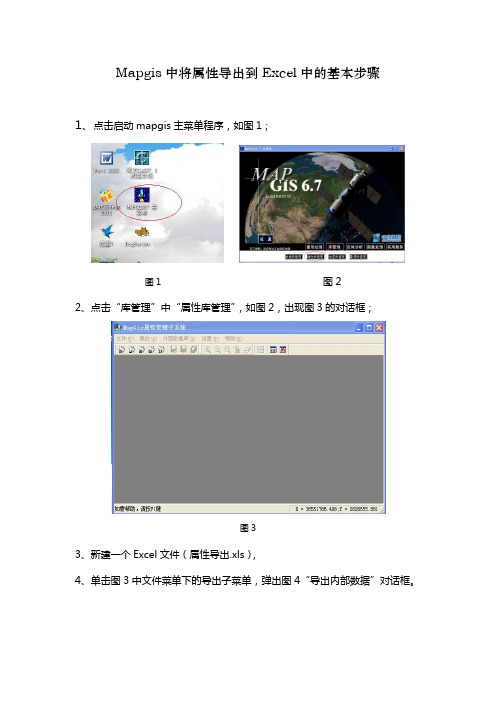
Mapgis中将属性导出到Excel中的基本步骤1、点击启动mapgis主菜单程序,如图1;图1 图22、点击“库管理”中“属性库管理”,如图2,出现图3的对话框;图33、新建一个Excel文件(属性导出.xls),4、单击图3中文件菜单下的导出子菜单,弹出图4“导出内部数据”对话框。
图4 图55、单击图 4 中“数据源”组合框中后的“+”按钮来添加和配置数据源,单击后弹出图5中“ODBC数据源管理器”对话框;6、在弹出的“ODBC数据源管理器”对话框中点击“添加”按钮(图6)。
在弹出的“创建新数据源”对话框中选择“Driver do Microsoft Excel(*.xls)”选项,然后选择“完成”(图7),之后弹出图8 “ODBC Microsoft Excel 安装”对话框;图6 图7图8 图97、在弹出的“ODBC Microsoft Excel 安装”对话框中的“数据源名”一栏中,输入第3步新建的“导出属性” Excel表,注意版本(v)后应选择Excel 97-2000,然后点击下方的“选择工作簿”按钮,见图9。
之后弹出图10中“选择工作薄”的对话框;图108、在“选择工作薄”的对话框中找到第3步新建的“导出属性” Excel表并选择该表,一定记得把“选择工作薄”对话框中“只读(R)”前的勾去掉后(图11),一直点击确定返回到“导出内部数据”对话框(图12),图11 图129、单击“导出内部数据”对话框中的“打开”选项,选择打开需导出属性的.wp 区文件,之后选择要导出的属性选项,再“数据源”一栏中选择“属性导出”,在“表格名称”一栏中随便填写一个名称(如图13“导出”),然后点击“导出”,当时钟图标消失,弹出“导出成功”(图14)对话框就可以了。
图13 图14。
ARCGIS中Excel表格坐标投影生成kml并导入在线地图
ARCGIS中Excel表格坐标投影生成kml并导入在线地图
工作需要将若干个矿权范围转成KML,以便在手机奥维软件上查看。
给定的数据是矿权范围的拐点坐标(经纬度),我们需要在ArcGIS软件里面完成将拐点坐标投成点,在连成线,然后转成KML。
1 投点
打开ArcGIS,选择文件→添加数据→添加XY数据,选择存放拐点坐标的文本文件或Excel文件。
选择X、Y对应的文件中的字段名,设置好坐标系。
坐标系的选择通过点击上图中编辑按钮进行选择。
点击确定就将数据添加成功了,需要将添加的数据导出。
2 转线保存完点位数据后,选择点集转线工具,该工具在数据管理工具→要素→点集转线。
打开工具,选择数据,记住要选择闭合线。
选好参数后,点击确定,生成线。
用于示范的数据少,手工就可以将这几个点连成线,数据多的时候再手动画就麻烦了。
3 转KML选择图层转KML工具,进行转换。
按步骤转换即可,转出来的文件为KMZ,直接可以添加到奥维地图上,如果你非要用KML文件,直接将KMZ文件解压缩即可得到KML文件。
来源:网络,感谢原作者提供。
如何使用ArcGIS连接Excel表格
如何使用ArcGIS连接Excel表格
在使用ArcGIS做相关分析时候经常需要一些外部的属性数据,如果挨个输入到属性表内是十分不明智的,这时候可以使用ArcGIS的连接功能连接到对应的表格,这里讲解一下具体的操作,希望能够对大家有所帮助。
步骤
第一步:获取Excel表格数据
打开水经注万能地图下载器,框选下载需要的数据,在“新建任务”对话框内选择“POI(兴趣点)”,文件格式选择“txt”,点击“查询”开始查询(图1),导出后使用Excel另存为Excel表格。
图1
第二步:加载数据
打开ArcMap,点击“文件”→“添加数据”→“添加数据”(图2),将准备好的点数据加载进来,打开属性表可以看到只有“name”一个字段(图3)。
图2
图3
第三步:连接表格
在加载进来的图层上点击右键,选择“连接和关联”→“连接”(图4),在弹出的“连接数据”对话框内,第1栏选择“name”,第2栏选择上Excel表,第3栏选择上Excel表内对应的列(图5)。
完成之后再次打开图层属性表,可以看到Excel表内的数据已经加载
图4
图5
图6
结语
到此就完成了使用ArcGIS将现有数据和Excel表连接起来,其实水经注万能地图下载器下载的POI数据直接导出shp格式就和最后的成果一样的丰富,有兴趣的朋友可以使用水经注万能地图下载器和ArcGIS试试。
将EXCEL表导入MapGIS方法
将EXCEL表导入MapGIS方法
最近输入了大量EXCEL数据到mapgis中,繁琐而且容易出错。
今天干完了,就在那尝试导入EXCEL 表格。
还被我真的导入成功了。
具体的步骤:
1)打开MAPGIS的“报表编辑”模块,选择“\文件\新建报表文件”
2)选择“\文件\页面设置”功能设置表格幅面,默认为标准A4。
3)在工作区按鼠标右键选择缩小窗口,单击工作区,显示出工作幅面,可以同样用鼠标右键选择
放大缩小调,将页面调整到合适位置。
4)选择“\构造表格\初始表宽\”功能设置表格的单元高宽。
5)选择“\构造表格\构造固定式表\”功能,在页面左上角单击鼠标左键,拖动鼠标,同时注意状态栏
中显示的表格行列数,直到满足要求后,在单击鼠标左键确定,表格构造完成。
6)选择“\建索引\编辑区块\”功能,在已经构造好的表格左上方第一个单元格内单击鼠标左键,拖动
鼠标到右下角最后一个单元个内,单击鼠标左键确认。
7)打开EXCEL文件,选择数据区用“复制”命令
8)选择“\建索引\粘贴剪切版内容\”功能,即可将剪贴板上的内容粘贴到相应的单元格中。
9)如果需要调整表格的高宽和注释位置,可以用“构造表格”和“单元”菜单中的相应工具调整。
10)调整完成后用“\文件\生成MAPGIS数据\”功能将表格文件转成点、线文件,再用“\文件\保存文
件\保存图元文件\”功能将数据保存成点、线文件,就可以在编辑状态下调用了。
在测绘业内中如何结合ArcGIS与Excel实现高效作业
在测绘业内中如何结合ArcGIS与Excel实现高效作业在测绘业内中如何结合ArcGIS与Excel实现高效作业摘要:ArcGIS是应用领域最广的GIS(地理信息系统)技术平台之一,测绘内业离不开ArcGIS软件的应用。
ArcGIS虽然功能强大,但并不是每一个功能都高效简便,本文将探讨如何将Excel表接入ArcGIS中的属性表,实现高效作业。
关键词:ArcGIS Excel 测绘内业一、测绘内业的主要内容测绘是研究测定和推算地面的几何位置、地球形状及地球重力场,据此测量地球表面自然形态和人工设施的几何分布,并结合某些社会信息和自然信息的地球分布,编制全球和局部地区各种比例尺的地图和专题地图的理论和技术的学科。
一般可分为:大地测量学、摄影测量学、地图学、工程测量学、海洋测量学等,随着科技的发展,测绘领域已从地球扩展到宇宙空间。
测绘内业主要是对测绘数据的处理和图形的生成,包括数据整理及测量数据入库、地籍图绘制、地类面积量算、编制土地报批报告、绘制地籍矢量图并赋属性等。
主要用到的软件有南方CASS、Auto-CAD、ArcGIS、PS等。
测绘的外业测量会带来大量的测量数据需要处理,尤其是对于大型项目的测量工程来说,使用原始手段处理巨大的数据量,会耗费大量人力、时间、精力,因此,提高内业技术,学会将多种软件结合实现内业工作的效率最大化,是每个测绘企业长久发展的必经之路。
二、ArcGIS在测绘内业中的应用1.ArcGIS简介ArcGIS是美国环境系统研究所(ESRI)开发的新一代软件,是中国地理信息界用户群体最大、应用领域最广的GIS(地理信息系统)技术平台之一,GIS系统用于支持空间数据的采集、管理、处理、分析、建模和显示,以便解决复杂的规划和管理决策问题。
ArcGIS应用遍布于自然资源管理、城市规划/建设、土地利用、测绘/制图、石油/地质、环境保护及高等教育等领域。
2.ArcGIS在测绘内业中的应用测绘与GIS有着密切的关系:测绘不但为GIS提供各种不同比例尺和精度的地理定位数据,而且其理论和算法可直接用于空间数据的变换和处理;而GIS引人测绘,以一种全新的思想和手段来解决复杂的分析和管理问题。
- 1、下载文档前请自行甄别文档内容的完整性,平台不提供额外的编辑、内容补充、找答案等附加服务。
- 2、"仅部分预览"的文档,不可在线预览部分如存在完整性等问题,可反馈申请退款(可完整预览的文档不适用该条件!)。
- 3、如文档侵犯您的权益,请联系客服反馈,我们会尽快为您处理(人工客服工作时间:9:00-18:30)。
ArcGis导入EXCEL数据
在arccatalog里面选Database Connections(滚动条拉到最下面就可以看到),双击Add OLE DB Connection再选Microsoft OLE DB Provider for ODBC Drivers这一项,点下一步,然后在“使用的数据源名称”这一栏选excel files,点确定,然后在arccatalog里面就可以看到EXCLE文件了
第二种解释:
ArcGIS操作全记录之属性关联(一)
当你默默地一单元格一个单元格地为图形输入属性的时候,其他人正在用高效的方式解决问题!(不是说你傻,虽然你就是)
基于属性的关联操作流程:ArcGIS->windows->table of content(TOC)->图层名右键jion工具或Arctoolbox->data management tools->joins->add join
注:关联只是临时的,图层关闭后不会保存关联上的属性,但你可以点击图层右键data->export导出为一个新层
1. 建立关键字要将属性表(如excel表)中关联到图形中,首先要建立图形与属性之间的一一对应关系,所谓一一对应并不是要求图形有多少块属性记录就要有多少条,而是要求关联所依据的字段能够唯一标识图形和属性记录,例如,如果你想通过“编号”字段实现图形属性的关联,编号为A002图形只能有一个,同样属性记录“编号”字段中A002也只能出现一次(如果图形中有一个A002,而属性记录中有多个A002,在属性表中第一次出现的A002记录将会被关联),要实现这一目的,你首先需要检测拟关联字段是不是具有唯一标识码的特征,检测过程可以通过excel的“数据透视表”功能和ArcGIS的属性表“summarize”工具实现,其实就是统计下它出现的次数,出现一次的就是正常的。
如果唯一一个可用来关联的字段不是唯一标识码,则需要对图形数据和属性数据建立一个新字段,并对重复编码进行人工判读,重复的A002可以用A002-1、A002-2……去表示,最后做到图表一致。
注意事项:关联字段大小写要一致、字段中不要有空格(出现上述问题可以用ArcGIS的属性表field calculator面板中的String里的函数实现相互转换,前提条件是你需要用ArcCatalog建立一个personal geodatabase(以下简称mdb,它实际上就是access),将属性表导入,因为ArcGIS无法实现对excel表的编辑,但可以编辑mdb中的属性)
2. 记录单行一行就是一行(呵呵,大白话,听得懂不),意思就是呢,去掉excel乱七八糟的表头,最重要的一点,不要出现一个合并的单元格对应多行的情况。
比如有些人将第一列的前五行合并了,内容为“农用地”,第二列分别对应“耕地”、“林地”……这样不太合适!
3. 字段名称标准化有时你关联好以后,发现属性表明明有A002这条记录和图形对应,但其图层属性中其内容却是空的。
郁闷得要死要活,这时你用identity标识下这个地块,发现属性竟然能够正常显示,或者在属性表中将“all”切换成“selected”选项后发现属性也能正常显示,我顶,为什么呀?一个原因可以是你的字段名称可能出现了类似括号“()”之类的字符,解决办法A.将括号改成下划线;B.在可编辑的状态下将数据导出,流程为图层右键data->export(关联后的数据是不支持可编辑的状态下导出的,但属性不正常显示时却支持,导出之后不一定会成功,我只成功过几次,估计是破解数据的问题,呵呵,此方法不推荐,成功几率太低)
4. 数字字段的格式调整有时你会发现,属性表中明明有一个数值,导入到mdb后却成了NULL(空值),不要急,有办法解决!仔细查看excel,细心的你可能会发现有些数值的单元格左上角有个提醒标识,我也不知道它怎么产生的,反正是你可以在一个空单元格中输入数据1,然后复制,然后选中有问题的单元格,右键->选择性粘贴,选中“乘”,呵呵,正常了!通过这一步你会学到EXCEL的一个新功能,就是一组数据,你想进行单位转换(如
平方米换公顷),但又不想在新的单元格使用公式A单元格=B单元格/10000创建实现,这个功能可以帮你大忙!
5. 自动换行问题的解决办法讨厌,明明是一个单元格,设计表格的人整了一个自动换行,结果导入到MDB后,换行以后的数据显示不出来了,双击它地却能正确显示。
怎么办?有人说:单位元格属性->对齐->取消自动换行选项,再来个全选,再设置好最合适列宽!这办法我试了,不行:(于是呢,我就想要替换了它,结果网上找到一个牛人的方法—换行符大替换,呵呵。
你首先要知道alt+10代表换行符,当数字小键盘上的NumLook灯亮着时,按着alt,依次按数据小键盘的1和0就可以了。
替换成什么的地方不要填噢!不然就出错了!。