IELTStask1
雅思新版task1范文(改良版)
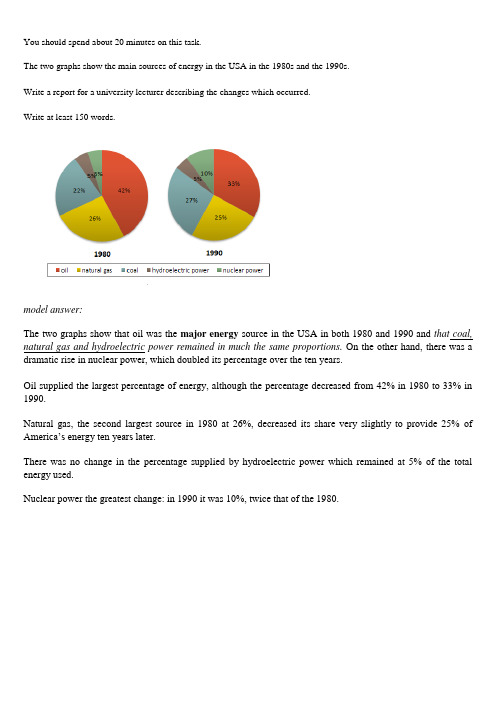
You should spend about 20 minutes on this task.The two graphs show the main sources of energy in the USA in the 1980s and the 1990s.Write a report for a university lecturer describing the changes which occurred.Write at least 150 words.model answer:The two graphs show that oil was the major energy source in the USA in both 1980 and 1990 and that coal, natural gas and hydroelectric power remained in much the same proportions. On the other hand, there was a dramatic rise in nuclear power, which doubled its percentage over the ten years.Oil supplied the largest percentage of energy, although the percentage decreased from 42% in 1980 to 33% in 1990.Natural gas, the second largest source in 1980 at 26%, decreased its share very slightly to provide 25% of America’s energy ten years later.There was no change in the percentage supplied by hydroelectric power which remained at 5% of the total energy used.Nuclear power the greatest change: in 1990 it was 10%, twice that of the 1980.You should spend about 20 minutes on this task.The graph below shows the differences in wheat exports over three different areas.Write a report for a university lecturer describing the information shown below.Write at least 150 words.model answer:The three graphs of wheat exports each show a quite different pattern between 1985 and 1990. Exports from Australia declined over the five-year period, while the Canadian market fluctuated considerably, and the European Community showed an increase.In 1985, Australia exported about 15 millions of tonnes of wheat and the following year the number increased by one million tonnes to 16 million. After that, however, there was a gradual decline until 1989 and 1990 when it stabilised at about 11 million tonnes. Over the same period, the amount of Canadian exports varied greatly. It started at 19 million tonnes in 1985, reached a peak in 1988 of 24 million, dropped dramatically in 1989 to 14 million tonnes and then climbed back to 19 million in 1990. Seventeen million tonnes were exported from the European Community in 1985, but this decreased to 14 million tonnes in 1986 and then rose to 15 million in 1987 and 1988 before increasing once more to 20 million in 1990.You should spend about 20 minutes on this task.The table below gives information about Favorite Pastimes in different countries.Summarize the information by selecting and reporting the main features, and make comparisons where relevant. Write at least 150 words.the top of the table, are analyzed in relation to each country.As can be seen, about 60% of Canadians, Australians and Americans like watching television. On the other hand, this figure is quite low for China where only 15% of people watch television. Predictably, Americans like music at 23%, whereas only2 to 5%of people in the other countries feel the same way. 20% of people in England enjoy sleeping as a pastime whereas in Canada and the USA, for example, the figure is only 2%. Interestingly, the Chinese like hobbies the most at 50%, as opposed to only 20% in France. It isn’t surprising that the highest percentage of beach-lovers is in Australia and the USA at 30%.(175 words)The graph below gives information about the preferred leisure activities of Australian children.Write a report for a university lecturer describing the information shown.The graph shows the preferred leisure activities of Australian children aged 5-14. As might be expected, it is clear from the data that sedentary pursuits are far more popular nowadays than active ones.Of the 10,000 children that were interviewed, all the boys and girls stated that they enjoyed watching TV or videos in their spare time.In addition, the second most popular activity, attracting 80% of boys and 60% of girls, was playing electronic or computer games.While girls rated activities such as art and craft highly – just under 60% stated that they enjoyed these in their spare time – only 35% of boys opted for creative pastimes.Bike riding, on the other hand, was almost as popular as electronic games amongst boys and, perhaps surprisingly, almost 60% of girls said that they enjoyed this too.Skateboarding was relatively less popular amongst both boys and girls, although it still attracted 35% of boys and 25% of girls.(157 words)The bar chart below shows the results of a survey conducted by a personnel department at a major company. The survey was carried out on two groups of workers: those aged from 18-30 and those aged 45-60, and shows factors affecting their work performance.Write a report for a university lecturer describing the information shown below.The bar chart indicates a survey on two different age groups on the factors contributing to make their environment pleasant for working.These factors are divided into external and internal factors. The internal factors are team spirit, competent boss, respect from colleagues and job satisfaction. The external factors are chance for personal development, job security, promotional prospects and money.On the internal factors above 50% in both age groups agreed that team spirit, competent boss and job satisfaction are essential to make their environment pleasant. Whereas on the external factors, there are contrasting results. On the chance for personal development and promotional aspects, 80% to 90% of the younger groups were in favor while only less than 50% of the older group thought so. A similar pattern is also noted on job security. With regards to money, 69% to 70% on both age group said it is essential.In conclusion, the internal factors have similar responses from the two age groups while they had dissimilar responses on the external factors.(170 words)The flow chart illustrates the production of coloured plastic paper clips in a small factory.Write a report for a university tutor describing the production process.Write at least 150 words.There are four main stages in the production of plastic paper clips from this small factory. Two of these stages involve actual preparation of the clips, while the other two consist of quality control before the clips are sent out from the factory to the retailers to be sold to the public.To begin with, molten plastic is poured into three different moulds depending on the colour required; the colours are red, blue and yellow. Once these clips emerge from the moulds a quality control machine checks them for strength. Unsatisfactory clips are rejected. In the third stage in the process the clips are stored by hand into two groups, mixed and single colours. When this stage is complete the groups are checked a second time to ensure that the colour mixtures are divided correctly into single colours and mixed colour batches. Finally, the clips are packed and dispatched to the markets.(152 words)Write a report for a university lecturer describing the information shown below.You should write at least 150 words.In this analysis we will examine thr ee pie charts. The first one is headed ‘World Spending.’ The second is‘World Population’ and the third is ‘Consumption of Resources.’In the first chart we can see that people spend most of their income (24%) on food. In some countries this percentage would obviously be much higher. Transport and then housing are the next major expenses at 18% and 12% respectively. Only 6% of income is spent on clothing.In the second chart entitled ‘World Population’, it is not surprising to find that 57% of people live in Asia. Europe and the Americans account for nearly 30% of the total, whilst 10% of people live in Africa. Finally, the third chart reveals that the USA and Europe consume a huge 60% of the world’s resource.To sum up, the major expenditure is on food, the population figures are the highest for Asia and the major consumers are the USA and Europe.The chart and graph below give information about sales and share prices for Coca-Cola.Write a report for a university lecturer describing the information shown below.•You should write at least 150 words.•You should spend about 20 minutes on this task.The pie chart shows the worldwide distribution of sales of Coca-Cola in the year 2000 and the graph shows the change in share prices between 1996 and 2001.In the year 2000, Coca-Cola sold a total of 17.1 billion cases of their fizzy drink product worldwide. The largest consumer was North America, where 30.4 per cent of the total volume was purchased. The second largest consumer was Latin America. Europe and Asia purchased 20.5 and 16.4 per cent of the total volume respectively, while Africa and the Middle East remained fairly small consumers at 7 per cent of the total volume of sales.Since 1996, share prices for Coca-Cola have fluctuated. In that year, shares were valued at approximately $35. Between 1996 and 1997, however, prices rose significantly to $70 per share. They dipped a little in mid-1997 and then peaked at $80 per share in mid-98. From then until 2000 their value fell consistently but there was a slight rise in mid-2000.The graphs below show the types of music albums purchased by people in Britain according to sex and age. Write a report for a university lecturer describing the information shown below.•You should write at least 150 words.•You should spend about 20 minutes on this task.The three graphs provide an overview of the types of music people purchase in the UK. At first glance we see that classical music is far less popular than pop or rock music.While slightly more women than men buy pop music, the rock market is dominated by men with 30% buying rock, compared to 17% of women. From the first graph we see that interest in pop music is steady from age 16 to 44 with 20% of the population continuing to buy pop CDs after the age of 45.The interest in rock music reaches its peak among the 25 to 34 year olds, though it never sells as well as pop. Interest also drops off after the age of 35 with an even sharper fall from age 45 onwards, a pattern which is the opposite to the classical music graph.。
雅思写作Task 1评分细则(IELTS Task 1 Writing band descriptors)
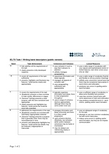
IELTS Task 1 Writing band descriptors (public version)Band Task Achievement Coherence and Cohesion Lexical Resource Grammatical Range and Accuracy9 fully satisfies all the requirements ofthe taskclearly presents a fully developedresponse uses cohesion in such away that it attracts noattentionskilfully managesparagraphinguses a wide range of vocabulary withvery natural and sophisticated control oflexical features; rare minor errors occuronly as ‘slips’uses a wide range of structures with fullflexibility and accuracy; rare minor errorsoccur only as ‘slips’8 covers all requirements of the tasksufficientlypresents, highlights and illustrates keyfeatures / bullet points clearly andappropriately sequences information andideas logicallymanages all aspects ofcohesion welluses paragraphingsufficiently andappropriatelyuses a wide range of vocabulary fluentlyand flexibly to convey precise meaningsskilfully uses uncommon lexical items butthere may be occasional inaccuracies inword choice and collocationproduces rare errors in spelling and/orword formationuses a wide range of structuresthe majority of sentences are error-freemakes only very occasional errors orinappropriacies7 covers the requirements of the task(Academic) presents a clear overviewof main trends, differences or stages(General Training) presents a clearpurpose, with the tone consistent andappropriateclearly presents and highlights keyfeatures / bullet points but could bemore fully extended logically organisesinformation and ideas; thereis clear progressionthroughoutuses a range of cohesivedevices appropriatelyalthough there may besome under-/over-useuses a sufficient range of vocabulary toallow some flexibility and precisionuses less common lexical items withsome awareness of style and collocationmay produce occasional errors in wordchoice, spelling and/or word formationuses a variety of complex structuresproduces frequent error-free sentenceshas good control of grammar andpunctuation but may make a few errors6 addresses the requirements of the task(Academic) presents an overview withinformation appropriately selected(General Training) presents a purposethat is generally clear; there may beinconsistencies in tonepresents and adequately highlights keyfeatures / bullet points but details maybe irrelevant, inappropriate orinaccurate arranges information andideas coherently and thereis a clear overallprogressionuses cohesive deviceseffectively, but cohesionwithin and/or betweensentences may be faulty ormechanicalmay not always usereferencing clearly orappropriatelyuses an adequate range of vocabularyfor the taskattempts to use less common vocabularybut with some inaccuracymakes some errors in spelling and/orword formation, but they do not impedecommunicationuses a mix of simple and complex sentenceformsmakes some errors in grammar andpunctuation but they rarely reducecommunication5 generally addresses the task; theformat may be inappropriate in places(Academic) recounts detailmechanically with no clear overview;there may be no data to support thedescription(General Training) may present apurpose for the letter that is unclear attimes; the tone may be variable andsometimes inappropriatepresents, but inadequately covers, keyfeatures / bullet points; there may be atendency to focus on details presents information withsome organisation but theremay be a lack of overallprogressionmakes inadequate,inaccurate or over-use ofcohesive devicesmay be repetitive becauseof lack of referencing andsubstitutionuses a limited range of vocabulary, butthis is minimally adequate for the taskmay make noticeable errors in spellingand/or word formation that may causesome difficulty for the readeruses only a limited range of structuresattempts complex sentences but these tendto be less accurate than simple sentencesmay make frequent grammatical errors andpunctuation may be faulty; errors cancause some difficulty for the reader4 attempts to address the task but doesnot cover all key features / bulletpoints; the format may be inappropriate(General Training) fails to clearlyexplain the purpose of the letter; thetone may be inappropriatemay confuse key features / bulletpoints with detail; parts may beunclear, irrelevant, repetitive orinaccurate presents information andideas but these are notarranged coherently andthere is no clearprogression in the responseuses some basic cohesivedevices but these may beinaccurate or repetitiveuses only basic vocabulary which may beused repetitively or which may beinappropriate for the taskhas limited control of word formationand/or spelling;errors may cause strain for thereaderuses only a very limited range of structureswith only rare use of subordinate clausessome structures are accurate but errorspredominate, and punctuation is oftenfaulty3 fails to address the task, which mayhave been completely misunderstoodpresents limited ideas which may belargely irrelevant/repetitive does not organise ideaslogicallymay use a very limitedrange of cohesive devices,and those used may notindicate a logicalrelationship between ideasuses only a very limited range of wordsand expressions with very limited controlof word formation and/or spellingerrors may severely distort the messageattempts sentence forms but errors ingrammar and punctuation predominate anddistort the meaning2 answer is barely related to the task has very little control oforganisational features uses an extremely limited range ofvocabulary; essentially no control of wordformation and/or spellingcannot use sentence forms except inmemorised phrases1 answer is completely unrelated to thetask fails to communicate anymessagecan only use a few isolated words cannot use sentence forms at all0 does not attenddoes not attempt the task in any waywrites a totally memorised response。
剑桥雅思写作11task1
剑桥雅思写作11task1(原创实用版)目录1.剑桥雅思 11test1 写作真题解析概述2.剑桥雅思 11test1 写作真题 Task 1 解析3.剑桥雅思 11test1 写作真题 Task 2 解析4.剑桥雅思写作高分范文及学习建议正文【剑桥雅思 11test1 写作真题解析概述】剑桥雅思 11test1 写作真题解析共包括 8 篇文章,主要针对雅思写作的 Task 1 和 Task 2 进行解析。
Task 1 要求考生根据提供的图表或数据,完成一篇不超过 20 分钟的写作任务;而 Task 2 则要求考生针对某个话题或问题,完成一篇议论文。
本文将对这些真题进行详细解析,并提供一些学习建议。
【剑桥雅思 11test1 写作真题 Task 1 解析】Task 1 的真题主要涉及数据图表的解析,例如柱状图、饼图等。
在解析过程中,需要注意以下几点:1.仔细阅读题目要求,了解图表的主要信息和需要完成的任务。
2.对图表中的数据进行对比和分析,找出主要的趋势和变化。
3.结合数据,清晰地描述图表的内容,并准确地使用词汇和表达。
【剑桥雅思 11test1 写作真题 Task 2 解析】Task 2 的真题主要涉及议论文的写作,例如社会问题、教育、环境等。
在写作过程中,需要注意以下几点:1.仔细阅读题目要求,理解题目的观点和立场。
2.确定自己的观点和立场,并进行合理的论证和论述。
3.注意文章的结构和逻辑,确保观点清晰、论证充分。
【剑桥雅思写作高分范文及学习建议】为了提高雅思写作的成绩,可以参考一些优秀的剑桥雅思写作高分范文。
这些范文不仅提供了丰富的写作素材,还对词汇、表达和句型进行了升级。
在学习过程中,可以借鉴以下几点建议:1.对范文进行深入的阅读和分析,了解其结构、逻辑和表达方式。
2.结合自己的实际情况,选取合适的写作技巧和策略,进行有效的写作练习。
3.多做真题练习,提高自己的写作速度和质量。
雅思写作 ielts writing task1

用词的准确性和灵活性
用词的准确性和灵活性
Grammatical Range and Accuracy
Grammatical Range and Accuracy
语法多样性和准确性
语法多样性和准确性
目 标 02
学 习 小 作 文 两 种 分 类 模 式 : 图 表 和 动静E DUC ATION
折线图 graph,line graph, line chart
时间的描述
1, In + 月份、年、年代 In 1980s; In the period between…and...
2, From…to… , Between… and …, At / by the end of, Until / before / after, About /some
From 2008 onwards till … At / by the end of this year / century About / some 200 years ago 3, For / during + 时间段, Over a … year period, Throughout … , When it enters…, At the turn of the …
dropped
a drop
ielts task1句子翻译
IELTS WRITING:T ASK 1Introductory sentence:1.表格显示了1995年二月某大学书店小说类图书、非小说类图书以及杂志(fiction books, non-fiction books, and magazines)的销售情况。
2.从1950年至1990年,城市居民的交通方式发生了显著的变化。
3.本图显示,男女之间每周用于无酬工作的时间是不一样的。
4.柱状图比较了到1994年6月前12个月内顶点石油工司(ACME Oil Company)各级管理人员中男女所占的比例。
5.两幅饼状图表明了体力劳动与非体力劳动(manual and non-manual occupation) 61个基本工种中男性与女性的受雇比例。
6.两幅饼状图说明了男性和女性被捕(arrest)的比例,而条形图则说明了他(她)们被捕的原因。
7.本图显示了1994年财政年度(financial year)四个季度以及12个月份中顶点跑车公司和布莱森汽车公司( Acme Sports Cars and Branson Motors)的赢利情况。
8.曲线图展示了1950年至1996年间全世界以百万公顷为计算单位的谷物收割总面积。
(hectare)9.图表表明了自1985年以来弗莱德尼亚(Freedonia)地区能源需求和矿物燃料能够供给的能源之间的关系,并做出直至2005年的预测。
10.据图所示,1975年至1995年20年间Freedona共和国地区劳动大军(work force)中妇女人数发生了很大的变化。
11.据图表所示,广播电听众与电视观众人数有许多变化。
12.本图表表示出了四个不同欧洲国家消费者的喜好。
13.此表通过四项基本经济指数显示出所选五个国家在1982年的生活水平。
14.只要看一眼1994年加拿大、日本、秘鲁和扎伊尔(Canada, Japan, Peru and Zaire)四个国家的四项经济和社会指数(indicator)就能发现富裕和贫穷国家之间存在的巨大差别。
雅思写作第一部分满分攻略
雅思写作第一部分满分攻略雅思写作第一部分满分攻略TASK 1写作三大步骤(1)审题:找出主要信息点,具体为两个任务:A: 辨别所要写图表的类型,是线状(line ),柱状(bar ),还是饼状(pie)等B: 找图表的主要内容,是人口变化,交通工具,受教育水平,或者是一项工艺的制作流程。
(2)构思:审题是对文章主要内容的一个大概认识,而构思就是对自己认识的进一步深化。
构思的主要任务为:分析图表的主要特征,弄清写作重点并选用适当的分析方法。
图表的主要特征是指其所描述现象或者问题的规律,并找出描述重点,不是图表上所出现的所有信息都要写出来,之后就是分析方法的选择,主要的分析方法有:数据分类,数据比较,平铺直叙法等,具体选哪种,需要根据图表的内容来确定。
(3)写作:写作是对前两个步骤的确认。
考生把自己的想法准确而详细的落实下来。
一般来说,这个部分的写作可以采用三或四段式:1)引言段(用简短的语言来描述图表的主要内容)。
一把来说,写作命题会给出的主要信息,如,The line chart below shows thegrowth of households with personal computers in the U.S.通过这句话,我们可以了解图表的主要信息,“美国每个家庭所拥有计算机量的增长变化。
”在这种情况下,考生可以重现组织一下这个具体,在中间加入一些具体的数字和变化年限等,使得阅卷老师一下就明白图表的主要内容。
引言段通用句式如下:This is a table / chart / (line线状 bar柱状pie饼状)graph whichdemonstrate / illustrate / reveal /depict/privide informationabout.............2)图表具体信息描述段:这个段落主要描写体现图表主要特征或总体变化规律的数据或信息,并用恰当的连接词语,如,on contrast , on theotherhand, however, like wise 等,把文章内容紧密的衔接起来。
雅思Task1作文词汇句型积累
IELTS Task 1Task1主要考察的是组织能力、呈现方式、数据比较、陈述程序、描述一件物品或事物的能力,说明一样东西的工作原理。
流程图、地图、功能图类作文:考察组织能力、呈现方式、陈述程序、描述物品和工作原理的能力。
主要考察的是动词、句型、思维、理解力柱状图、饼状图、表格、曲线图、混合图作文:考察组织能力、呈现方式、数据分析比较能力、表达能力。
解题步骤:a.看题:明确题中的要求时间20分钟,字数150以上,一般要求概括主要特征,和比较。
b.评分标准TA ——任务完成度(不要遗漏信息)CC ——结构与衔接(储备连接词和句型,在考试中套用)LR ——词汇丰富程度(储备少量常用高阶词汇)GRA ——语法应用程度。
(时态、语态、从句、句式)流程图:流程图{单项流程图循环流程图流程图对象{某种事物的生产工艺或加工过程(混凝土和石灰的制作过程等)动植物的生命循环(生长生殖、细胞分裂等)自然界某种现象的发展流程(沙丘漂移、水循环、碳循环等)写作四个步骤:一、读题目,划题眼二、圈信息,寻步骤三、定框架、写文章四、读文章、做检查流程图的写作套路和模板第一段:写流程图阐述的是一个什么样的过程。
把题目中的原话修改一下。
(主动改被动,被动改主动等方法)。
The flow chart illustrates the recycling process of …The process diagram shows the structure of...以下适用于图表中描述两个过程的文章开头:使用as well as 连接The two diagrams show the silkworm’s cycle of life as well as the producing stages of silk cloth.(题目原话:The diagrams below show the life cycle of the silkworm and the stages in the production of silk cloth.)The diagrams tell about the stages and equipment used in the cement-making process接口不气设备中资料试as well as how cement is used to produce concrete for building purposes.第二段:用一句话开始引导写过程The process of A always involves the following steps.The whole procedure of A can be categorized/divided into X stages.根据剑桥八和剑桥六中的Test3 Task1,我们基本上可以看出,一般情况下,流程图并不是单一的。
雅思task1写作模板
雅思task1写作模板全文共四篇示例,供读者参考第一篇示例:雅思写作任务1是雅思考试中的第一部分,要求考生根据图表、图形或表格等形式的信息,对相关数据进行描述和比较。
这部分考试主要是考察考生的数据分析和描述能力。
为了帮助考生更好地应对雅思写作任务1,下面提供一份雅思task1写作模板供考生参考。
雅思task1写作模板第一段:引言在第一段,我们需要简要介绍图表的背景信息,如图表内容、数据来源、时间范围等。
同时简要概括图表呈现的数据趋势。
例如:This bar chart illustrates the amount of consumption of three different types of beverages in 2015 and 2020.以上就是一份简单的雅思task1写作模板,希望考生能够根据此模板进行练习和准备,提高自己的写作水平,取得理想的雅思考试成绩。
祝考生们考试顺利!第二篇示例:雅思考试是全球最著名的英语语言考试之一,被广泛认可和应用于全球范围内的教育和职业领域。
雅思写作任务1是两种写作任务之一,要求考生根据给定的图表、数据或图像来描述和解释相关信息。
为了帮助考生更好地应对雅思写作任务1,以下是一个常用的模板供考生参考:第三段:比较要点1. highlight any comparisons or contrasts shown in the graph/picture2. discuss similarities and differences between different categories or groups3. analyze the reasons behind the differences以上是一个典型的雅思写作任务1模板,考生可以根据具体情况在这个模板的基础上进行增减和调整。
在应对雅思写作任务1时,考生应该注意遵循规定的字数要求、清晰明了地描述数据和信息、合理分析数据并提出相关见解。
雅思小作文---TASK1图表题
雅思小作文TASK1图表题规律注意事项:1.Task1就是客观写作,要求客观真实。
2.客观性:不应该有任何图里没有而靠自己主观想象加入得成分。
结尾段针对图形做出得总结性结论也应该就是根据图表得实际内容做出得符合逻辑得总结。
准确性:图表里面得数据介绍要力求精确,不能抄错数字。
但当一个特征点没有落在一个准确得坐标值上时,允许进行合理得目测或估计一个大概数值。
详尽性:要有层次感,并不需要把所有得数字都推到文章里。
3.类型Table表格题LineGraph线图BarChart柱状图PieChart饼状图ProcessChart流程图4.瞧图要注意单位,标题与图例。
5.对于多数小作文题,题中给出了几个图就对应得写出几个主体段。
题目里只给出一个图,根据图中包含几类图形元素写几个主体段。
图中只给了一个图,但图中所含图形元素很多,则分类。
题目中出现多线多柱多饼,用“对应提取法“,把每组里得对应元素提出来组织主体段。
6.时态与发生时间意义对应。
陈述永恒事实得句型,其主句得谓语动词必定用一般现在时。
若题目里没有出现时间,则全文都使用一般现在时。
7.结构开头段(1~2句)改写原题主体段1总体概括具体介绍数字主体段N总体概括具体介绍数字结尾段(1~2句)介绍总数(若图里并没有明确得给出总数,则省略)结论(根据图里得数据得出有一定合理性得结论)8.开头段得改写题目中改写成Show illustrate /compareProportion percentageInformation dataThe number/amount of the figure forFamily householdMales menFemale womenInfluence affect/effectCategories kinds/typesSubway system underground railway/train systemStore shop9.介绍数据或描述变化趋势得常用词。
雅思task1写作模板
雅思task1写作模板雅思写作Task 1是许多考生感到挑战的部分,因为它要求考生在规定的时间内,对图表、表格或流程图进行分析,并以清晰、连贯的方式呈现出来。
以下是一个雅思Task 1写作模板,旨在帮助考生更好地组织文章结构,提高写作效率。
雅思Task 1写作模板:一、开头段落1.概括介绍:简要描述图表、表格或流程图的主题,说明要分析的内容。
Example: The table below presents data on the population of three countries from 2000 to 2010.2.主题句:明确指出文章要分析的主题。
Example: This report will focus on analyzing the changes in population of these countries over the given period.二、主体段落1.第一段:描述图表/表格/流程图中的第一个数据点或阶段。
a.主题句:指出要分析的数据点或阶段。
Example: The first stage of the process involves ...b.详细描述:对数据点或阶段进行详细描述,包括数据变化、比较等。
Example: In 2000, the population of Country A was 10 million, which accounted for 20% of the total population of the three countries.2.第二段:描述图表/表格/流程图中的第二个数据点或阶段。
a.主题句:指出要分析的数据点或阶段。
b.详细描述:对数据点或阶段进行详细描述,与第一段类似。
3.依次类推,描述其他数据点或阶段。
三、结尾段落1.总结句:总结文章分析的主要结果。
Example: In conclusion, the population of these three countries experienced significant changes from 2000 to 2010.2.指出可能的趋势或关联:如有必要,指出数据之间的趋势或关联。
- 1、下载文档前请自行甄别文档内容的完整性,平台不提供额外的编辑、内容补充、找答案等附加服务。
- 2、"仅部分预览"的文档,不可在线预览部分如存在完整性等问题,可反馈申请退款(可完整预览的文档不适用该条件!)。
- 3、如文档侵犯您的权益,请联系客服反馈,我们会尽快为您处理(人工客服工作时间:9:00-18:30)。
numbers pictures
objectivity
accuracy
ntheossrough
硕课英语俱乐部
The Academic Task 1 Essay
• Task 1 essays require students to describe data, diagrams or processes using English. Most students find Task 1 essays much easier to write than Task 2 essays. Nevertheless, there are a number of choices that students can make to ensure they write an effective essay.
: Coherence & Cohesion
(内容连贯与篇章衔接)
LOREM
: Task Achievement (任务完成)--1
: Task Response(任 务回应)--2
硕课英语俱乐部
Task 1
line graph, bar chart, table, pie chart map, process
IELTS WRITING
硕课英语俱乐部
An Overview of IELTS Writing
Task 1 Task 2
Time:20 min Words: 150 Time: 40 min Words: 250
硕课英语俱乐部
Task 1
以考查图表为主。考的较多的 图表有曲线图、柱状图、饼状 图、表格等。也有可能考到两 种不同种类的图表。另外,流 程图和示意图偶尔也会考到 。
For example : The bar chart shows the percentage of males and females that completed various educational qualifications in 1999.
硕课英语俱乐部
You should spend about 20 minutes on this task.
硕课英语俱乐部
硕课英语俱乐部
Task 2
以考查议论文为主。对某一社 会现象或问题表达自己的观点。
硕课英语俱乐部
硕课英语俱乐部
IELTS 写作新评分标准
GRA: Grammatical Range and Accuracy (语法范围与精确性)
LR:Lexical Resource (词汇资源)
• The first is that writers should have a clear idea of the aim of the essay. The goal of the writer should be to allow a reader who has never seen the information presented in the question to reproduce the informati.
The table below gives information on consumer spending on different items in five different countries in 2002.
Summarize the information by selecting and reporting the main features, and make comparisons where relevant.
硕课英语俱乐部
Step 1 – Organising the information – thinking time
The Task 1 response will almost always have an introduction and two body paragraphs. The first step is to analyse the data and determine how to split the data into two logical parts. Very occasionally data is best split into three parts, but this is unusual. This decision is often very simple to make, for example when there are two diagrams or two graphs. On other occasions it is more difficult and sometimes it is appropriate to combine two small logical pieces that are related into one paragraph. The way in which data is split is a critical decision in writing an essay as this defines the high level structure of the essay and have a significant impact on the essay’s readability.
硕课英语俱乐部
Step 2 – Writing the Introduction
The introduction in a Task 1 essay is usually one sentence, or very rarely two short sentences. After reading the introduction the reader should be able to describe the form of the data (i.e. diagram, graph, table etc.), provide a title for the data and draw and label axis correctly.