电容式传感器中英文翻译资料毕业设计用
红外传感器论文中英文资料对照外文翻译
中英文资料对照外文翻译外文资料Moving Object Counting with an Infrared Sensor NetworkBy KI, Chi KeungAbstractWireless Sensor Network (WSN) has become a hot research topic recently. Great benefit can be gained through the deployment of the WSN over a wide range of applications, covering the domains of commercial, military as well as residential. In this project, we design a counting system which tracks people who pass through a detecting zone as well as the corresponding moving directions. Such a system can be deployed in traffic control, resource management, and human flow control. Our design is based on our self-made cost-effective Infrared Sensing Module board which co-operates with a WSN. The design of our system includes Infrared Sensing Module design, sensor clustering, node communication, system architecture and deployment. We conduct a series of experiments to evaluate the system performance which demonstrates the efficiency of our Moving Object Counting system.Keywords:Infrared radiation,Wireless Sensor Node1.1 Introduction to InfraredInfrared radiation is a part of the electromagnetic radiation with a wavelength lying between visible light and radio waves. Infrared have be widely used nowadays including data communications, night vision, object tracking and so on. People commonly use infrared in data communication, since it is easily generated and only suffers little from electromagnetic interference. Take the TV remote control as an example, which can be found in everyone's home. The infrared remote control systems use infrared light-emitting diodes (LEDs) to send out an IR (infrared) signal when the button is pushed. A different pattern of pulses indicates the corresponding button being pushed. To allow the control of multiple appliances such as a TV, VCR, and cable box, without interference, systems generally have a preamble and an address to synchronize the receiver and identify the source and location of the infrared signal. To encode the data, systems generally vary the width of the pulses (pulse-width modulation) or the width of the spaces between the pulses (pulse space modulation). Another popular system, bi-phase encoding, uses signal transitions to convey information. Each pulse is actually a burst of IR at the carrier frequency. A 'high' means a burst of IR energy at the carrier frequency and a 'low' represents an absence of IR energy. There is no encoding standard. However, while a great many home entertainment devices use their own proprietary encoding schemes, somequasi-standards do exist. These include RC-5, RC-6, and REC-80. In addition, many manufacturers, such as NEC, have also established their own standards.Wireless Sensor Network (WSN) has become a hot research topic recently. Great benefit can be gained through the deployment of the WSN over a wide range of applications, covering the domains of commercial, military as well as residential. In this project, we design a counting system which tracks people who pass through a detecting zone as well as the corresponding moving directions. Such a system can be deployed in traffic control, resource management, and human flow control. Our design is based on our self-made cost-effective Infrared Sensing Module board which co-operates with a WSN. The design of our system includes Infrared Sensing Module design, sensor clustering, node communication, system architecture and deployment. We conduct a series of experiments to evaluate the system performance which demonstrates the efficiency of our Moving Object Counting system.1.2 Wireless sensor networkWireless sensor network (WSN) is a wireless network which consists of a vast number of autonomous sensor nodes using sensors to monitor physical or environmental conditions, such as temperature, acoustics, vibration, pressure, motion or pollutants, at different locations. Each node in a sensor network is typically equipped with a wireless communications device, a small microcontroller, one or more sensors, and an energy source, usually a battery. The size of a single sensor node can be as large as a shoebox and can be as small as the size of a grain of dust, depending on different applications. The cost of sensor nodes is similarly variable, ranging from hundreds of dollars to a few cents, depending on the size of the sensor network and the complexity requirement of the individual sensor nodes. The size and cost are constrained by sensor nodes, therefore, have result in corresponding limitations on available inputs such as energy, memory, computational speed and bandwidth. The development of wireless sensor networks (WSN) was originally motivated by military applications such as battlefield surveillance. Due to the advancement in micro-electronic mechanical system technology (MEMS), embedded microprocessors, and wireless networking, the WSN can be benefited in many civilian application areas, including habitat monitoring, healthcare applications, and home automation.1.3 Types of Wireless Sensor NetworksWireless sensor network nodes are typically less complex than general-purpose operating systems both because of the special requirements of sensor network applications and the resource constraints in sensor network hardware platforms. The operating system does not need to include support for user interfaces. Furthermore, the resource constraints in terms of memory and memory mapping hardware support make mechanisms such as virtual memory either unnecessary or impossible to implement. TinyOS [TinyOS] is possibly the first operating system specifically designed for wireless sensor networks. Unlike most other operating systems, TinyOS is based on an event-driven programming model instead of multithreading. TinyOS programs are composed into event handlers and tasks with run to completion-semantics. When an external event occurs, such as an incomingdata packet or a sensor reading, TinyOS calls the appropriate event handler to handle the event. The TinyOS system and programs are both written in a special programming language called nesC [nesC] which is an extension to the C programming language. NesC is designed to detect race conditions between tasks and event handlers. There are also operating systems that allow programming in C. Examples of such operating systems include Contiki [Contiki], and MANTIS. Contiki is designed to support loading modules over the network and supports run-time loading of standard ELF files. The Contiki kernel is event-driven, like TinyOS, but the system supports multithreading on a per-application basis. Unlike the event-driven Contiki kernel, the MANTIS kernel is based on preemptive multithreading. With preemptive multithreading, applications do not need to explicitly yield the microprocessor to other processes.1.4 Introduction to Wireless Sensor NodeA sensor node, also known as a mote, is a node in a wireless sensor network that is capable of performing processing, gathering sensory information and communicating with other connected nodes in the network. Sensor node should be in small size, consuming extremely low energy, autonomous and operate unattended, and adaptive to the environment. As wireless sensor nodes are micro-electronic sensor device, they can only be equipped with a limited power source. The main components of a sensor node include sensors, microcontroller, transceiver, and power source. Sensors are hardware devices that can produce measurable response to a change in a physical condition such as light density and sound density. The continuous analog signal collected by the sensors is digitized by Analog-to-Digital converter. The digitized signal is then passed to controllers for further processing. Most of the theoretical work on WSNs considers Passive and Omni directional sensors. Passive and Omni directional sensors sense the data without actually manipulating the environmen t with active probing, while no notion of “direction” involved in these measurements. Commonly people deploy sensor for detecting heat (e.g. thermal sensor), light (e.g. infrared sensor), ultra sound (e.g. ultrasonic sensor), or electromagnetism (e.g. magnetic sensor). In practice, a sensor node can equip with more than one sensor. Microcontroller performs tasks, processes data and controls the operations of other components in the sensor node. The sensor node is responsible for the signal processing upon the detection of the physical events as needed or on demand. It handles the interruption from the transceiver. In addition, it deals with the internal behavior, such as application-specific computation.The function of both transmitter and receiver are combined into a single device know as transceivers that are used in sensor nodes. Transceivers allow a sensor node to exchange information between the neighboring sensors and the sink node (a central receiver). The operational states of a transceiver are Transmit, Receive, Idle and Sleep. Power is stored either in the batteries or the capacitors. Batteries are the main source of power supply for the sensor nodes. Two types of batteries used are chargeable and non-rechargeable. They are also classified according to electrochemical material used for electrode such as NiCd(nickel-cadmium), NiZn(nickel-zinc), Nimh(nickel metal hydride), and Lithium-Ion. Current sensors are developed which are able to renewtheir energy from solar to vibration energy. Two major power saving policies used are Dynamic Power Management (DPM) and Dynamic V oltage Scaling (DVS). DPM takes care of shutting down parts of sensor node which are not currently used or active. DVS scheme varies the power levels depending on the non-deterministic workload. By varying the voltage along with the frequency, it is possible to obtain quadratic reduction in power consumption.1.5 ChallengesThe major challenges in the design and implementation of the wireless sensor network are mainly the energy limitation, hardware limitation and the area of coverage. Energy is the scarcest resource of WSN nodes, and it determines the lifetime of WSNs. WSNs are meant to be deployed in large numbers in various environments, including remote and hostile regions, with ad-hoc communications as key. For this reason, algorithms and protocols need to be lifetime maximization, robustness and fault tolerance and self-configuration. The challenge in hardware is to produce low cost and tiny sensor nodes. With respect to these objectives, current sensor nodes usually have limited computational capability and memory space. Consequently, the application software and algorithms in WSN should be well-optimized and condensed. In order to maximize the coverage area with a high stability and robustness of each signal node, multi-hop communication with low power consumption is preferred. Furthermore, to deal with the large network size, the designed protocol for a large scale WSN must be distributed.1.6 Research IssuesResearchers are interested in various areas of wireless sensor network, which include the design, implementation, and operation. These include hardware, software and middleware, which means primitives between the software and the hardware. As the WSNs are generally deployed in the resources-constrained environments with battery operated node, the researchers are mainly focus on the issues of energy optimization, coverage areas improvement, errors reduction, sensor network application, data security, sensor node mobility, and data packet routing algorithm among the sensors. In literature, a large group of researchers devoted a great amount of effort in the WSN. They focused in various areas, including physical property, sensor training, security through intelligent node cooperation, medium access, sensor coverage with random and deterministic placement, object locating and tracking, sensor location determination, addressing, energy efficient broadcasting and active scheduling, energy conserved routing, connectivity, data dissemination and gathering, sensor centric quality of routing, topology control and maintenance, etc.中文译文移动目标点数与红外传感器网络作者KI, Chi Keung摘要无线传感器网络(WSN)已成为最近的一个研究热点。
光学传感器毕业论文中英文文献及翻译

英文文献及中文翻译一种精确测量倾斜角度的光学传感器摘要本文主要介绍了一种新型光学传感器,它可以同时准确地测量倾斜角或两轴倾斜角度。
这种传感器是基于激光干涉原理,因此具有很高的精度。
设计制作了一个传感器的模型来论证这个新的方法,这是一个光电传感器,传感器中没有移动的部分。
由正交于铅垂面的流动水平面提供参考面。
传感器和绝对水平面之间的角度随着被测量的物体倾斜而改变,这些变化反映在条纹图案的中心位置的转移方式。
不同的干涉条纹的中心位置随倾斜角的变化而改变。
干涉条纹图案进行记录和处理,转化为两轴、水平和垂直倾斜角度。
当使用1024*1024像素的传感器时,测量范围为700弧秒,其精度可高达+/ - 1弧秒。
关键词:倾斜角度传感器,倾斜仪,激光干涉I 介绍市场上目前有几种类型的商业倾斜角度测量传感器。
有些是角度传感器,有些是倾斜仪,它们的工作原理不同。
电解液体、电容和钟摆是现在大多数倾斜角度传感器和倾斜仪的三个主要工作原理。
在这里,我们提出了一种新的光学方法,建立了一个用激光、光学元件和图像传感器的光电传感器,它可以同时做精确的倾斜角度测量,不需要进行机械的移动,其工作原理是基于光学干涉,相干激光作为光源。
光线通过一个装满液态油的玻璃油盒。
由正交于铅垂面的流动水平面提供参考面。
当激光束穿过油箱有两束光线反射回来,一束是液体的表面产生的,另一束是容器玻璃产生的,干涉条纹就是由这两条光线形成的,条纹图案将随着倾斜角度的变化产生相应的变化,条纹图案采集和处理后将反映倾斜角度信息,光学工作原理使它不受磁场的影响。
该传感器可以同时测量两轴倾角。
流动的水平面确保了参考面是一个绝对的水平面。
高灵敏度光学干涉测量原理,保证了较高的精度。
II 原理图1说明了工作原理示意图,O点是光线扩大镜头的焦点,O点可以看作是点光源,它发出球面波。
由于地球重力的影响,液体油面始终保持水平,因此用油面作为参考平面。
该容器是玻璃材料的。
当传感器被放在目标表面时,其底部表面将连同目标对象一起倾斜。
传感器技术论文中英文对照资料外文翻译文献

传感器技术论文中英文对照资料外文翻译文献Development of New Sensor TechnologiesSensors are devices that can convert physical。
chemical。
logical quantities。
etc。
into electrical signals。
The output signals can take different forms。
such as voltage。
current。
frequency。
pulse。
etc。
and can meet the requirements of n n。
processing。
recording。
display。
and control。
They are indispensable components in automatic n systems and automatic control systems。
If computers are compared to brains。
then sensors are like the five senses。
Sensors can correctly sense the measured quantity and convert it into a corresponding output。
playing a decisive role in the quality of the system。
The higher the degree of n。
the higher the requirements for sensors。
In today's n age。
the n industry includes three parts: sensing technology。
n technology。
and computer technology。
电气类(外文翻译)英文电容式传感器操作capacitive-sensor-operation-毕业论
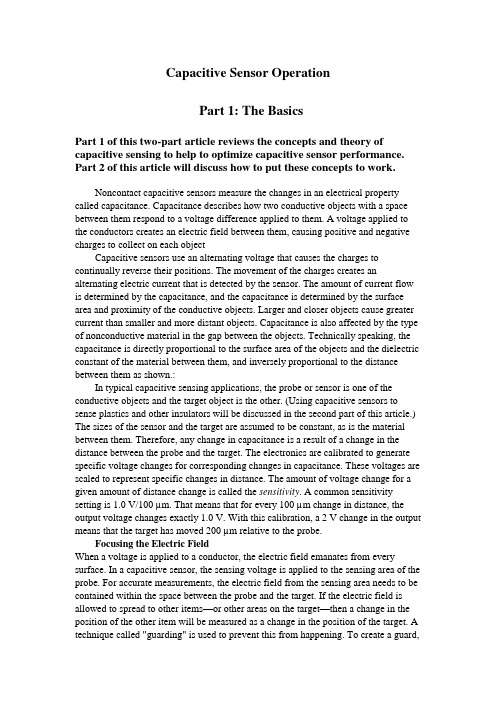
Capacitive Sensor OperationPart 1: The BasicsPart 1 of this two-part article reviews the concepts and theory of capacitive sensing to help to optimize capacitive sensor performance. Part 2 of this article will discuss how to put these concepts to work.Noncontact capacitive sensors measure the changes in an electrical property called capacitance. Capacitance describes how two conductive objects with a space between them respond to a voltage difference applied to them. A voltage applied to the conductors creates an electric field between them, causing positive and negative charges to collect on each objectCapacitive sensors use an alternating voltage that causes the charges to continually reverse their positions. The movement of the charges creates an alternating electric current that is detected by the sensor. The amount of current flow is determined by the capacitance, and the capacitance is determined by the surface area and proximity of the conductive objects. Larger and closer objects cause greater current than smaller and more distant objects. Capacitance is also affected by the type of nonconductive material in the gap between the objects. Technically speaking, the capacitance is directly proportional to the surface area of the objects and the dielectric constant of the material between them, and inversely proportional to the distance between them as shown.:In typical capacitive sensing applications, the probe or sensor is one of the conductive objects and the target object is the other. (Using capacitive sensors to sense plastics and other insulators will be discussed in the second part of this article.) The sizes of the sensor and the target are assumed to be constant, as is the material between them. Therefore, any change in capacitance is a result of a change in the distance between the probe and the target. The electronics are calibrated to generate specific voltage changes for corresponding changes in capacitance. These voltages are scaled to represent specific changes in distance. The amount of voltage change for a given amount of distance change is called the sensitivity. A common sensitivity setting is 1.0 V/100 µm. That means that for every 100 µm change in distance, the output voltage changes exactly 1.0 V. With this calibration, a 2 V change in the output means that the target has moved 200 µm relative to the probe.Focusing the Electric FieldWhen a voltage is applied to a conductor, the electric field emanates from every surface. In a capacitive sensor, the sensing voltage is applied to the sensing area of the probe. For accurate measurements, the electric field from the sensing area needs to be contained within the space between the probe and the target. If the electric field is allowed to spread to other items—or other areas on the target—then a change in the position of the other item will be measured as a change in the position of the target. A technique called "guarding" is used to prevent this from happening. To create a guard,the back and sides of the sensing area are surrounded by another conductor that is kept at the same voltage as the sensing area itself. When the voltage is applied to the sensing area, a separate circuit applies the exact same voltage to the guard. Because there is no difference in voltage between the sensing area and the guard, there is no electric field between them. Any other conductors beside or behind the probe form an electric field with the guard instead of with the sensing area. Only the unguarded front of the sensing area is allowed to form an electric field with the target.DefinitionsSensitivity indicates how much the output voltage changes as a result of a change in the gap between the target and the probe. A common sensitivity is 1 V/0.1 mm. This means that for every 0.1 mm of change in the gap, the output voltage will change 1 V. When the output voltage is plotted against the gap size, the slope of the line is the sensitivity.A system's sensitivity is set during calibration. When sensitivity deviates from the ideal value this is called sensitivity error, gain error, or scaling error. Since sensitivity is the slope of a line, sensitivity error is usually presented as a percentageof slope, a comparison of the ideal slope with the actual slope.Offset error occurs when a constant value is added to the output voltage of the system. Capacitive gauging systems are usually "zeroed" during setup, eliminating any offset deviations from the original calibration. However, should the offset error change after the system is zeroed, error will be introduced into the measurement. Temperature change is the primary factor in offset error.Sensitivity can vary slightly between any two points of data. The accumulated effect of this variation is called linearity erro. The linearity specification is the measurement of how far the output varies from a straight line.To calculate the linearity error, calibration data are compared to the straight line that would best fit the points. This straight reference line is calculated from the calibration data using least squares fitting. The amount of error at the point on the calibration line furthest away from this ideal line is the linearity error. Linearity error is usually expressed in terms of percent of full scale (%/F.S.). If the error at the worst point is 0.001 mm and the full scale range of the calibration is 1 mm, the linearity error will be 0.1%.Note that linearity error does not account for errors in sensitivity. It is only a measure of the straightness of the line rather than the slope of the line. A system with gross sensitivity errors can still be very linear.Error band accounts for the combination of linearity and sensitivity errors. It is the measurement of the worst-case absolute error in the calibrated range. The error band is calculated by comparing the output voltages at specific gaps to their expected value. The worst-case error from this comparison is listed as the system's error band. In Figure 7, the worst-case error occurs for a 0.50 mm gap and the error band (in bold)Bandwidth is defined as the frequency at which the output falls to –3 dB, a frequency that is also called the cutoff frequency. A –3 dB drop in the signal level is an approximately 30% decrease. With a 15 kHz bandwidth, a change of ±1 V at low frequency will only produce a ±0.7 V change at 15 kHz. Wide-bandwidth sensors can sense high-frequency motion and provide fast-responding outputs to maximize the phase margin when used in servo-control feedback systems; however,lower-bandwidth sensors will have reduced output noise which means higher resolution. Some sensors provide selectable bandwidth to maximize either resolution or response time.Resolution is defined as the smallest reliable measurement that a system can make. The resolution of a measurement system must be better than the final accuracy the measurement requires. If you need to know a measurement within 0.02 µm, then the resolution of the measurement system must be better than 0.02 µm.The primary determining factor of resolution is electrical noise. Electrical noise appears in the output voltage causing small instantaneous errors in the output. Even when the probe/target gap is perfectly constant, the output voltage of the driver has some small but measurable amount of noise that would seem to indicate that the gap is changing. This noise is inherent in electronic components and can be minimized, but never eliminated.If a driver has an output noise of 0.002 V with a sensitivity of 10 V/1 mm, then it has an output noise of 0.000,2 mm (0.2 µm). This means that at any instant in time, the output could have an error of 0.2 µm.The amount of noise in the output is directly related to bandwidth. Generally speaking, noise is distributed over a wide range of frequencies. If the higher frequencies are filtered before the output, the result is less noise and better resolution (Figures 8, 9). When examining resolution specifications, it is critical to know at what bandwidth the specifications apply.Capacitive Sensor Operation Part 2: System Optimization Part 2 of this two-part article focuses on how to optimize the performance of your capacitive sensor, and to understand how target material, shape, and size will affect the sensor's response.Effects of Target SizeThe target size is a primary consideration when selecting a probe for a specific application. When the sensing electric field is focused by guarding, it creates a slightly conical field that is a projection of the sensing area. The minimum targetdiameter is usually 130% of the diameter of the sensing area. The further the probe is from the target, the larger the minimum target size.Range of MeasurementThe range in which a probe is useful is a function of the size of the sensing area. The greater the area, the larger the range. Because the driver electronics are designed for a certain amount of capacitance at the probe, a smaller probe must be considerably closer to the target to achieve the desired amount of capacitance. In general, the maximum gap at which a probe is useful is approximately 40% of the sensing area diameter. Typical calibrations usually keep the gap to a value considerably less than this. Although the electronics are adjustable during calibration, there is a limit to the range of adjustment.Multiple Channel SensingFrequently, a target is measured simultaneously by multiple probes. Because the system measures a changing electric field, the excitation voltagefor each probe must be synchronized or the probes will interfere with each other. If they were not synchronized, one probe would be trying to increase the electric field while another was trying to decrease it; the result would be a false reading. Driver electronics can be configured as masters or slaves; the master sets the synchronization for the slaves in multichannel systems.Effects of Target MaterialThe sensing electric field is seeking a conductive surface. Provided that the target is a conductor, capacitive sensors are not affected by the specific target material; they will measure all conductors—brass, steel, aluminum, or salt water—as the same. Because the sensing electric field stops at the surface of the conductor, target thickness does not affect the measurement。
08湿度传感器系统毕业论文中英文资料外文翻译文献

湿度传感器系统中英文资料外文翻译文献英文:The right design for a relative humidity sensor systemOptimizing the response characteristics and accuracy of a humidity sensor system1 OverviewTo make the right choice when selecting a relative humidity sensor for an application, it is important to know and to be able to judge the deciding factors. In addition to long-term stability, which is a measure on how much a sensor changes its properties over time, these factors also include the measurement accuracy and the response characteristics of the sensor. Capacitive humidity sensors are based on the principle that a humidity-sensitive polymer absorbs or releases moisture as a function of the relative ambient humidity. Because this method is only a spot measurement at the sensor location, and usually the humidity of the surroundings is the desired quantity, the sensor must be brought into moisture equilibrium with the surroundings to obtain a precise measurement value. This process is realized by various transport phenomena (cf. the section titled "The housing effect on the response time"), which exhibit a time constant. Accuracy and response time are thus closely dependent on each other, and the design of a humidity measurement system becomes a challenge.2Measurement accuracyThe term measurement accuracy of a humidity sensor is understood primarily to refer to the deviation of the value measured by the sensor from the actual humidity. To determine the measurement accuracy, references, such as chilled mirror hygrometers, whose own tolerance must be taken into account, are used. In addition to this trivial component, humidity sensors require a given time for reaching stable humidity and temperature equilibrium (the humidity is a function of temperature and decreases with increasing temperature; a difference between sensor and ambient temperature leads to measurement errors). This response time thus has a significant effect on the value measured by the sensor and thus on the determined accuracy.This time-dependent characteristic is explained in more detail in the following.3Response characteristics and response timeThe response characteristics are defined by various parameters. These are:●The actual response characteristics of the humidity sensor at constant temperature.(1) How quickly the sensitive polymer absorbs or releases moisture until equilibrium is reached (intrinsic response time)(2) How fast the entire system reaches humidity equilibrium (housing effect)●The thermal response characteristics of the humidity sensor at a non-constant temperature(3) The thermal mass of the sensor(4) The system's thermal mass, which is thermally coupled to the sensor (e.g. printed circuit board)(5) Heat sources in the direct surroundings of the sensor (electronic components)(1) and (3) are determined entirely by the sensor itself, (1) primarily by the characteristics of the sensitive polymer.(2) and (4) are primarily determined by the construction of the entire system (shape and size of housing andreadout circuitry).(5) is determined by heat-emitting electronic components.These points will be discussed in more detail in the following.The intrinsic response time (1)Qualitatively, the response characteristics of capacitive humidity sensors look like the following (Fig. 1).Fig. 1: Typical and idealized response characteristics of capacitive humidity sensors (schematic)Because these response characteristics are especially pronounced at high humidity values,an isothermal humidity jump from 40% to 100% was selected here for illustration. The desired ideal behavior of the sensor is indicated in blue. In practice, however, the sensor behaves according to the red line, approximately according to:=(E-S)*(1-e)+SRH-t(t)Here, the time span 1 is usually very short (typ. 1 – 30 min.), in contrast, the time span 2 is very long (typ. Many hours to days). Here the connection of measurement accuracy and response characteristics becomes clear (t until RH=100% is reached). The value at t4 (Fig. 1) is considered to be an exact measured value. However, this assumes that both the humidity and also the temperature remain stable during this entire time, and that the testing waits until this very long measurement time is completed. These conditions are both very hard to achieve and unusual in practice. For the calibration, there are the following two approaches, which both find use in practice (cf. Fig. 2):1.The measured value at t2 (Fig. 1) is used as a calibration reference.Advantage:●The required measurement time for reaching the end value (in the example 100%) isclearly shortened,corresponds to practice, and achieves an apparent short responsetime of the sensor (cf. Fig. 2).Disadvantage:●If the conditions are similar for a long time (e.g., wet periods in outdoor operation),the sensors exceed the correct end value (in the example 100%) undesirably by upto 10% (cf. Fig. 2).2. The measured value at t4 (Fig. 1) is used as a calibration reference.Advantage:●Even for similar conditions over a long time (e.g., wet periods in outdoor operation),an exact measurement result is obtained (cf. Fig. 2).Disadvantage:●For a humidity jump like in Fig. 1, the sensors very quickly deliver the measuredvalue at t2, but reaching a stable end value (about 3-6% higher) takes a long time(apparent longer response time)(cf. Fig. 2).In order to take into account both approaches optimally, the measured values at t3 (cf. Fig. 1) are used as the calibration reference by Sensirion AG.Fig. 2: Response characteristics of different humidity measurement systemsThe housing effect on the response time (2)Here, two types of transport phenomena play a deciding role:●Convection: For this very fast process, the air, whose humidity is to be determined,is transported to the sensor by means of ventilation.●Diffusion: This very slow process is determined by the thermal, molecularself-motion of the water molecules. It occurs even in "stationary" air (e.g., within ahousing), but leads to a long response time.In order to achieve favorable response characteristics in the humidity measurement system, the very fast convection process must be supported by large housing openings and the slow diffusion process must be supported by a small housing around the sensor (small "deadvolume") with "stationary" air reduced to a minimum. The following applies:Thermal effects (3), (4), and (5)Because the total thermal mass of the humidity measurement system (sensor + housing)has a significant effect on its response time, the total thermal mass must be kept as low aspossible. The greater the total thermal mass, the more inert the measurement system becomesthermally and its response time, which is temperature-dependent, increases. In order toprevent measurement errors, the sensor should not be mounted in the vicinity of heatgenerating components.4Summary –what should be taken into account when designing a humidity measurement systemIn order to achieve error-free operation of a humidity-measurement system with response times as short as possible, the following points should be taken into account especially for the selection of the sensor and for the design of the system.●The selection of the humidity sensor element. It should●be as small as possible,●have a thermal mass that is as low as possible,●work with a polymer, which exhibits minimal fluctuations in measured values duringthe time span 2(cf. Fig. 1); testing gives simple information on this condition,●provide calibration, which corresponds to the requirements (see above), e. g.,SHT11/SHT15 from Sensirion.●The housing design (cf. Formula 1). It should●have air openings that are as large as possible in the vicinity of the sensor or thesensor should be operated outside of the housing à good convection!●enclose a "dead volume" that is as small as possible around the sensor àlittlediffusion!●The sensor should be decoupled thermally as much as possible from other components,so that the response characteristics of the sensor are not negatively affected by the thermal inertia of the entire system.(e.g., its own printed circuit board for the humidity sensor, structurally partitioning the housing to create a small volume for the humidity sensor, see Fig. 3)Fig. 3: Mounting example for Sensirion sensors SHT11 and SHT15 with slits for thermal decoupling●The sensor should not be mounted in the vicinity of heat sources. If it was, measuredtemperature would increase and measured humidity decrease.5Design proposalThe challenge is to realize a system that operates cleanly by optimally taking into account all of the points in section 4. The already calibrated SMD humidity sensors SHT11 and SHT15 from Sensirion are the ideal solution. For optimum integration of the sensors in a measurement system, Sensirion AG has also developed a filter cap as an adapter aid, which takes into account as much as possible the points in section 4 and also protects the sensor against contaminants with a filter membrane. Fig. 4 shows schematically how the sensors can be ideally integrated into a housing wall by means of the filter cap SF1.Fig. 4: Filter cap for SHT11 and SHT15In addition to the advantages mentioned above, there is also the option of building an IP67-compatible humidity measurement device (with O-ring, cf. Fig. 4) with optimal performance. Detailed information is available on the Sensirion Web site.译文:相对湿度传感器系统的正确设计湿度传感器系统精度及响应特性的优化1.综述为了在相对湿度的应用方面对传感器做出正确的选择,了解和评估那些起决定作用的因素是非常重要的。
传感器外文翻译文献

传感器外文翻译文献(文档含中英文对照即英文原文和中文翻译)译文:传感器的基础知识传感器是一种将能量转化为光的、机械的或者更为普遍的电信号,这种能量转换发生的过程称之为换能作用。
按照能量转换的复杂程度和控制方式,传感器被分为不同的等级,用来测量位移的电阻式传感器被分类为电阻式位移传感器,其他的分类诸如压力波纹管、压力膜和压力阀等。
1、传感器元件大多数的传感器是由感应元件,转换元件、控制元件、当然也有例外,例如:震动膜、.波纹管、应力管和应力环、低音管和悬臂都是敏感元件。
对物理量作出反应,将物理的压力和力转换为位移,这些转换量可以被用作电参数,如电压、电阻、电容或者感应系数。
机械式和电子式元件合并形成机电式传感设备或传感器。
相似量的结合可以作为能量输入例如:热的、光的、磁的、化学的相互结合产生的热电式、光电式、电磁式和电化学式传感器。
2、传感器灵敏度通过校正测量系统获得的被测物理量和传感器输出信号的关系叫做传感器灵敏度K1=输出信号增量∕被测量的增量,实际上,传感器的灵敏度是已知的通过测量输出信号,输入量由下式决定,输入量=输出信号的增量∕k1。
3、理想传感器的性能特点:a)高保真性:传感器的输出波形式对被测量的真实展现,并且失真很小。
b)被测量干扰最小,任何情况下传感器的精度不能改变。
c)尺寸:必须将传感器正确的放在所需要的场所。
d)被测量和传感器信号之间要有线性关系。
e)传感器对外部变换由很小的灵敏度,例如:压力传感器常常受到外部震动和环境温度的影响f)传感器的固有频率应能够避开被测量的频率和谐波。
4、电传感器电传感器由很多理想特性,它们不仅实现远程测量和显示,还能提供高灵敏度。
电传感器可分为如下两大类。
这些传感器依靠外界电压刺激来工作。
A、变参数型包括:ⅰ)电阻式ⅱ)电容式ⅲ)感应式ⅳ)自感应式ⅴ)互感应式B、自激型包括:ⅰ)电磁式;ⅱ)热电式ⅲ)光栅式;ⅳ)压电式。
这些传感器都是自己产生输出电压来反映被测量的输入并且这些过程是可逆的;例如,一般的电子传感器通常能产生出输出电压来反映晶体材料的性能,.然而,如果在材料上加一个自变电压,传感器可以通过变形或与变电压同频率的振动来体现可逆效应。
传感器外文翻译

毕业设计(论文)外文文献翻译院系:光电与通信工程年级专业:12电子信息工程姓名:刘燊学号:1106012133附件:Advances in Sensor Technology Development指导老师评语:指导教师签名:年月日——摘自夏伟强,樊尚春传感器技术的的新发展仪器仪表学报传感器技术的新进展传感器技术是新技术革命和信息社会的重要技术基础,是一门多学科交叉的科学技术,被公认为现代信息技术的源头。
近些年,传感器技术发展很快,取得了许多新进展,尤其在气体传感器、生物传感器、视觉传感器等方面取得了很多进展。
美国麻省理工学院华人科学家张曙光领导的研究小组借助一种特殊溶液,成功地找到了大规模制造嗅觉感受器的办法;同样是麻省理工学院的研究人员利用气相色谱-质谱技术感受识别气体分子,研制出一种能对微量有毒气体做出强烈反应的微型传感器;俄罗斯科学家以从一种普通蘑菇中提取的混合物为原料,与压电石英晶振构成谐振式传感器,能够探测空气中含量极低的酚成分;日本科学家研制出能快速识别流感病毒纳米传感器,有望以纳米技术为快速识别流感病毒、乙型肝炎病毒、疯牛病病原体和残留农药等物质提供新手段;西班牙巴塞罗那自治大学研制出新型缩微DNA分析传感器,这种传感器能将分析 DNA链的时间缩短到几分钟或几小时,智能仪器与传感器技术、空间生物智能传感技术。
可以在亲子鉴定到检测遗传修饰食物的一系列化验中应用,此外还能确定新药的遗传毒性;美国国家标准与技术研究院研发出一种超灵敏微型核磁共振(NMR)传感器,该微型传感器与微流体通道并列置于一个硅芯片之上,这项技术将核磁共振的探测灵敏度提升到一个新的台阶,将在化学分析中具有广泛的应用前景。
我国传感器技术虽然与国外相比还有很大差距,但近两年也取得了一些进展和突破,诞生了一些新产品,有些在国家重大型号工程中获得应用。
如资源环境技术领域中的环境监测及环境风险评价技术、大气复合污染关键气态污染物的快速在线监测技术和大气细粒子和超细粒子的快速在线监测技术,海洋技术领域中的海洋水质污染综合参数在线监测技术和海洋金属污染物现场和在线监测技术等。
中英文文献翻译—基于电容传感器的塑膜厚度检测系统的研究
基于电容传感器的塑膜厚度检测系统的研究摘要:采用非接触式电容传感器、电涡流传感器组合系统获取检测信号,利用基于LabVIEW软件平台的计算机实现对塑料薄膜进行在线检测的工作原理,整个系统由测试单元、电机驱动单元、数据采集与处理单元组成。
由于测试单元采用了电容、电涡流组合传感系统,信号的后续处理由基于LabVIEW软件平台的计算机自动完成,速了测量过程。
采用本系统取代传统的千分尺测量方法,可以使塑料薄膜厚度测量以完全智能的、实时的、非接触的方式进行精确测量。
最后,通过比较组合测量系统与千分尺测量的测试结果,证明了该系统具有较高的精度,良好的可靠性与可行性。
关键词:塑料薄膜;厚度测量;组合传感系统;在线测量中图分类号:TP212. 1 ; TP216 文献标识码:A文章编号:1004 - 1699 (2005) 01 - 0116 - 04目前,塑膜在塑料产品中占有一定的比例。
它们广泛应用于许多领域,比如农业、运输、医学治疗、环境保护和建筑业。
在制造过程中,膜厚是评估产品性质的重要规范。
一般而言,如果一卷中膜厚度的差异大于膜厚度的10%,它将被认为是不合格品。
膜的厚度和一致性直接影响产品的物理属性和机械性能。
在使用中,它们也直接影响使用功能、寿命和抵制外部力量的能力。
另外,塑膜经常以卷分布。
不同卷之间的厚度差异影响使用范围。
这联系到公司和顾客间的利益。
因此,对塑膜的厚度作出精确的测量是很有必要的。
全球有几种可行的方法来测量膜厚,例如机械测定法和重量分析测量法[1]。
传统的测量方法是用千分尺来精确测量,并对成品进行抽样检查,因此测量误差和阅读误差是不可避免的。
对于一片厚度远小于100mm的膜来说,测量精确度很低。
随着工农制造业对塑膜的增长需求,传统的测量方法几乎不能满足发展的需要。
在这种情况下,塑膜厚度在线检测发展了。
主要用于测量和监控低密度浇铸膜和聚丙烯浇铸膜。
就如我们所知,膜由同样的材料和同样的工艺制造而成,因此通过上述方法制造的膜的密度是一致的,我们能等距离不间断地测出日常用膜的宽度为1.4 m。
- 1、下载文档前请自行甄别文档内容的完整性,平台不提供额外的编辑、内容补充、找答案等附加服务。
- 2、"仅部分预览"的文档,不可在线预览部分如存在完整性等问题,可反馈申请退款(可完整预览的文档不适用该条件!)。
- 3、如文档侵犯您的权益,请联系客服反馈,我们会尽快为您处理(人工客服工作时间:9:00-18:30)。
Capacitive Sensor Operation Part 1: The BasicsPart 1 of this two-part article reviews the concepts and theory of capacitive sensing to help to optimize capacitive sensor performance. Part 2 of this article will discuss how to put these concepts to work.Noncontact capacitive sensors measure the changes in an electrical property called capacitance. Capacitance describes how two conductive objects with a space between them respond to a voltage difference applied to them. A voltage applied to the conductors creates an electric field between them, causing positive and negative charges to collect on each objectCapacitive sensors use an alternating voltage that causes the charges to continually reverse their positions. The movement of the charges creates an alternating electric current that is detected by the sensor. The amount of current flow is determined by the capacitance, and the capacitance is determined by the surface area and proximity of the conductive objects. Larger and closer objects cause greater current than smaller and more distant objects. Capacitance is also affected by the type of nonconductive material in the gap between the objects. Technically speaking, the capacitance is directly proportional to the surface area of the objects and the dielectric constant of the material between them, and inversely proportional to the distance between them as shown.:In typical capacitive sensing applications, the probe or sensor is one of the conductive objects and the target object is the other. (Using capacitive sensors to sense plastics and other insulators will be discussed in the second part of this article.) The sizes of the sensor and the target are assumed to be constant, as is the material between them. Therefore, any change in capacitance is a result of a change in the distance between the probe and the target. The electronics are calibrated to generate specific voltage changes for corresponding changes in capacitance. These voltages are scaled to represent specific changes in distance. The amount of voltage change for a given amount of distance change is called the sensitivity. A common sensitivity setting is 1.0 V/100 µm. That means that for every 100 µm change in distance, the output voltage changes exactly 1.0 V. With this calibration, a 2 V change in the output means that the target has moved 200 µm relative to the probe.Focusing the Electric FieldWhen a voltage is applied to a conductor, the electric field emanates from every surface. In a capacitive sensor, the sensing voltage is applied to the sensing area of the probe. For accurate measurements, the electric field from the sensing area needs to be contained within the space between the probe and the target. If the electric field is allowed to spread to other items—or other areas on the target—then a change in the position of the other item will be measured as a change in the position of the target. A technique called "guarding" is used to prevent this from happening. To create a guard, the back and sides of the sensing area are surrounded by another conductor that is kept at the same voltage as the sensing area itself. When the voltage is applied to the sensing area, a separate circuit applies the exact same voltage to the guard. Because there is no difference in voltage between the sensing area and the guard, there is no electric field between them. Any other conductors beside or behind the probe form an electric field with the guard instead of with the sensing area. Only the unguarded front of the sensing area is allowed to form an electric field with the target.DefinitionsSensitivity indicates how much the output voltage changes as a result of a change in the gap between the target and the probe. A common sensitivity is 1 V/0.1 mm. This means that for every 0.1 mm of change in the gap, the output voltage will change 1 V. When the output voltage is plotted against the gap size, the slope of the line is the sensitivity.A system's sensitivity is set during calibration. When sensitivity deviates from the ideal value this is called sensitivity error, gain error, or scaling error. Since sensitivity is the slope of a line, sensitivity error is usually presented as a percentage of slope, a comparison of the ideal slope with the actual slope.Offset error occurs when a constant value is added to the output voltage of the system. Capacitive gauging systems are usually "zeroed" during setup, eliminating any offset deviations from the original calibration. However, should the offset error change after the system is zeroed, error will be introduced into the measurement. Temperature change is the primary factor in offset error.Sensitivity can vary slightly between any two points of data. The accumulated effect of this variation is called linearity erro. The linearity specification is the measurement of how far the output varies from a straight line.To calculate the linearity error, calibration data are compared to the straight line that would best fit the points. This straight reference line is calculated from the calibration data using least squares fitting. The amount of error at the point on the calibration line furthest away from this ideal line is the linearity error. Linearity error is usually expressed in terms ofpercent of full scale (%/F.S.). If the error at the worst point is 0.001 mm and the full scale range of the calibration is 1 mm, the linearity error will be 0.1%.Note that linearity error does not account for errors in sensitivity. It is only a measure of the straightness of the line rather than the slope of the line. A system with gross sensitivity errors can still be very linear.Error band accounts for the combination of linearity and sensitivity errors. It is the measurement of the worst-case absolute error in the calibrated range. The error band is calculated by comparing the output voltages at specific gaps to their expected value. The worst-case error from this comparison is listed as the system's error band. In Figure 7, the worst-case error occurs for a 0.50 mm gap and the error band (in bold) is –0.010.Gap (mm)Expected Value (VDC)Actual Value VDC)Error (mm) 0.50 –10.000 –9.800 –0.0100.75 –5.000 –4.900 –0.0051.00 0.000 0.000 0.0001.25 5.000 5.000 0.0001.50 10.000 10.100 0.005Figure 7. Error valuesBandwidth is defined as the frequency at which the output falls to –3 dB, a frequency that is also called the cutoff frequency. A –3 dB drop in the signal level is an approximately 30% decrease. With a 15 kHz bandwidth, a change of ±1 V at low frequency will only produce a ±0.7 V change at 15 kHz. Wide-bandwidth sensors can sense high-frequency motion and provide fast-responding outputs to maximize the phase margin when used in servo-control feedback systems; however, lower-bandwidth sensors will have reduced output noise which means higher resolution. Some sensors provide selectable bandwidth to maximize either resolution or response time.Resolution is defined as the smallest reliable measurement that a system can make. The resolution of a measurement system must be better than the final accuracy the measurement requires. If you need to know a measurement within 0.02 µm, then the resolution of the measurement system must be better than 0.02 µm.The primary determining factor of resolution is electrical noise. Electrical noise appears in the output voltage causing small instantaneous errors in the output. Even when theprobe/target gap is perfectly constant, the output voltage of the driver has some small butmeasurable amount of noise that would seem to indicate that the gap is changing. This noise is inherent in electronic components and can be minimized, but never eliminated.If a driver has an output noise of 0.002 V with a sensitivity of 10 V/1 mm, then it has an output noise of 0.000,2 mm (0.2 µm). This means that at any instant in time, the output could have an error of 0.2 µm.The amount of noise in the output is directly related to bandwidth. Generally speaking, noise is distributed over a wide range of frequencies. If the higher frequencies are filtered before the output, the result is less noise and better resolution (Figures 8, 9). When examining resolution specifications, it is critical to know at what bandwidth the specifications apply.Capacitive Sensor Operation Part 2: System OptimizationPart 2 of this two-part article focuses on how to optimize the performance of your capacitive sensor, and to understand how target material, shape, and size will affect the sensor's response.Effects of Target SizeThe target size is a primary consideration when selecting a probe for a specific application. When the sensing electric field is focused by guarding, it creates a slightly conical field that is a projection of the sensing area. The minimum target diameter is usually 130% of the diameter of the sensing area. The further the probe is from the target, the larger the minimum target size.Range of MeasurementThe range in which a probe is useful is a function of the size of the sensing area. The greater the area, the larger the range. Because the driver electronics are designed for a certain amount of capacitance at the probe, a smaller probe must be considerably closer to the target to achieve the desired amount of capacitance. In general, the maximum gap at which a probe is useful is approximately 40% of the sensing area diameter. Typical calibrations usually keep the gap to a value considerably less than this. Although the electronics are adjustable during calibration, there is a limit to the range of adjustment.Multiple Channel SensingFrequently, a target is measured simultaneously by multiple probes. Because the system measures a changing electric field, the excitation voltagefor each probe must be synchronized or the probes will interfere with each other. If they were not synchronized, one probe would be trying to increase the electric field while another was trying to decrease it; the result wouldbe a false reading. Driver electronics can be configured as masters or slaves; the master sets the synchronization for the slaves in multichannel systems.Effects of Target MaterialThe sensing electric field is seeking a conductive surface. Provided that the target is a conductor, capacitive sensors are not affected by the specific target material; they will measure all conductors—brass, steel, aluminum, or salt water—as the same. Because the sensing electric field stops at the surface of the conductor, target thickness does not affect the measurement中文翻译电容式传感器操作第一部分:基础 这篇文章的第一部分回顾了电容式传感器的概念和理论来帮助我们优化电容式传感器的性能。